Chapter 17
Sequential IO REMIC
As mentioned in Chapter 16, most investors prefer to purchase par-priced ($100) bonds in the new issue market. As a consequence, dealers prefer to structure REMICs with the goal of creating par bonds. Thus the MBS pass-though security (asset) priced closest to par is the most desirable security for REMIC arbitrage because it is the lowest coupon with which to execute a REMIC transaction. However, since the profitability of a REMIC execution is largely dependent on the slope of the yield curve, the dealer is often unable to fully monetize the interest component of the MBS pass-thorough via the liability coupons (transaction notes) when creating par bonds. In order to fully monetize the interest, the dealer often relies on a derivative execution. Profitable REMIC arbitrage is often accomplished via the allocation of interest.
Recall, Chapter 15 made reference to a tranche IOette whose value resulted in a profitable arbitrage. The IOette tranche represents the unsecuritized interest portion of the underlying MBS. It is the excess interest of the MBS pass-through (asset) not paid via the REMIC's bond coupons (liabilities). The REMIC interest only class, as opposed to the grantor trust IO-PO combination, is made possible by the two-tiered REMIC structure discussed earlier in Section 13.2. The IO class, in REMIC form, must meet the specified portions test under the tax code [Service 2012a].
- Conceptually, the IO represents three interest only strips, each of which is the difference between the underling MBS pass-through coupon and the tranche's coupon prorated against the collateral based on its outstanding balance.
Building on the earlier sequential transaction, Table 17.1 illustrates the full sequential REMIC excecution. The IO tranche, because it represents the total IO exposure in the transaction, is priced and quoted on the notional amount of the underlying collateral ($200 million). Notice the following:
- The transaction's proceeds exceed that of the collateral resulting in a positive arbitrage of $28.5 million, or $
 . The deal economics are outlined in Table 17.2. Indeed, the IO proceeds of $40 million result in a profitable deal arbitrage, highlighting the importance of derivative execution to a successful REMIC execution:
- The accounting of the transaction considers the underlying collateral as the asset, and the notes issued by the REMIC as the liabilities. Viewing the REMIC transaction in this manner yields a deeper understanding of the securitization process. Specifically, securitization allows issuers to secure term funding in the capital markets through the issuance of securities that either represent a beneficial interest in the underlying loans (grantor trust) or notes (owners trust) collateralized by the underlying loans which are paid via the asset's cash flows.
- The IO spread compresses as the transaction's tranches are retired. The IO stripped from Tranche A is 3.37% (4.00% − 0.63%) whereas the IO stripped from Tranche C is 1.28% (4.00% − 2.72%). The fact that the IO spread compresses as each tranche is retired plays a crucial role in the valuation of an IO stripped from a sequential transaction.
Table 17.1 REMIC Sequential OAS Analysis
| MBS 4.00% | Tranche A | Tranche B | Tranche C | Tranche IO | |
| Net Coupon | 4.00% | 0.63% | 1.41% | 2.72% | Variable |
| Note Rate | 4.75% | 4.75% | 4.75% | 4.75% | 4.75% |
| Term | 360 mos. | 360 mos. | 360 mos. | 360 mos. | 360 mos. |
| Loan Age | 0 mos. | 0 mos. | 0 mos. | 0 mos. | 0 mos. |
| Orig. Bal | $50mm | $75mm | $75mm | $200mm | |
| Price | $105.75 | $100.00 | $100.00 | $100.00 | $20.00 |
| Yield to Maturity | 3.26% | 0.63% | 1.41% | 2.70 | 7.26% |
| OAS | 0.52% | 0.00% | 0.05% | 0.31% | 4.40% |
| ZV-Spread | 1.28% | 0.00% | 0.00% | 0.27% | 4.23% |
| Spread to the Curve | 1.52% | 0.26% | 0.11% | 0.35% | 4.03% |
| Effective Duration | 7.13 | 1.78 | 8.97 | 13.7 | −5.07 |
| Effective Convexity | −15065 | 1377 | −18941 | −41132 | 12068 |
Table 17.2 REMIC Sequential OAS Analysis
| Asset Proceeds (Debit) | Deal Proceeds (Credit) | |
| MBS 4.00% | $211.50 | |
| Tranche A | $50 | |
| Tranche B | $75 | |
| Tranche C | $75 | |
| TrancheIO | $40 | |
| Deal Proceeds | $240 | |
| Gain/(Loss) | $28.5 | |
Gain/(Loss) in  : : |
4.3 |
The bondlabSEQIO REMIC waterfall cash allocation rules may be expressed as follows:
- { Pay 100% of available interest to classes A, B, and C on a pro-rata basis, based on each class's respective accrued interest }
- { Pay remaining interest to class D }
- { Pay 100% of available principal in the following order: }
- { Tranche 1 until the outstanding balance is reduced to zero, }
- { Tranche 2 until the outstanding balance is reduced to zero, }
- { Tranche 3 until the outstanding balance is reduced to zero }
17.1 Key Rate Duration Analysis
Figures 17.1 and 17.2 illustrate the key rate duration profile of the 4.00% IO strip presented earlier versus those of the sequential IO tranche. Stripping the IO from a sequential transaction results in less stripped income given that a portion of the collateral's interest is committed to the coupon-paying tranches. The sequential IO's shorter effective duration (−5.26 years) versus that of the stripped 4.00% IO (−7.55) reflects its lower relative coupon strip.
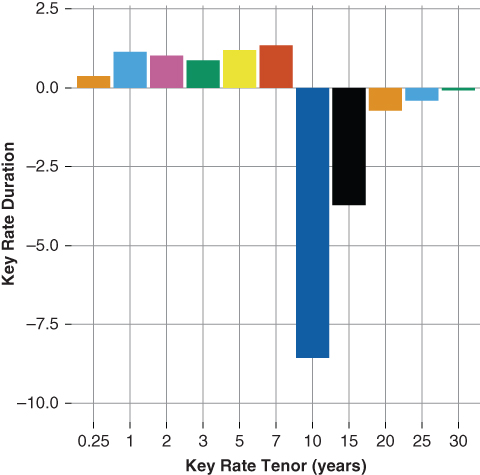
Figure 17.1 SMBS 4.00% Key Rate Duration
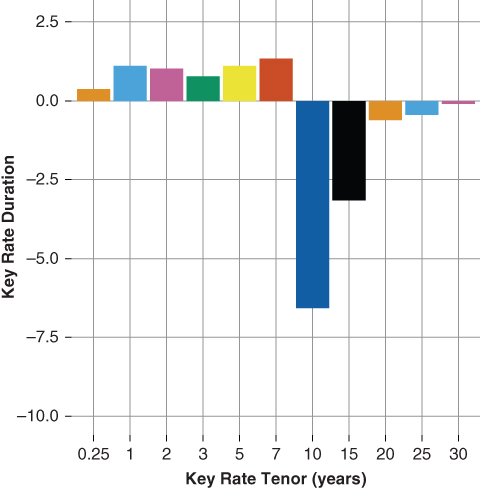
Figure 17.2 SEQ IO Key Rate Duration
Examination of the key rate duration of each tranche provides the intuition to understand how the allocation of principal and interest alter the nature of the sequential strip. Each strip's key rate duration profile is altered by the presence of the tranche from which it is taken. The sequential IO strip provides a case study to investigate the interaction between the allocation of principal and interest across a transaction's capital structure. In this case, time tranching allocates principal, while the IO allocates interest in excess of that used to support the principal-bearing bonds.
- The front strip, taken off Tranche A, is the closest in nature to the MBS 4.00% strip. The front strip is 3.37%; thus, although somewhat lower, the sequential IO's shorter tenor key rate durations are close to those of the MBS 4.00% strip.
- The middle strip, that taken off Tranche B, is 2.59%. The middle strip is 65% of the MBS 4.00% and the middle key rate duration tenors reflect its lower strip exposure. For example, the sequential IO strip's 10-year key rate duration is −6.5 while that of the MBS 4.00% is −8.3 years.
- The last strip, taken off Tranche C, is 1.28%. The last strip is 32% of the MBS 4.00% and the longer key rate duration tenors, like those of the middle strip, are also lower than those of the MBS 4.00%.
In all, the sequential IO exhibits less overall sensitivity to changes in the level and slope of the yield curve. The sequential IO's key rate duration profile is altered from that of the MBS 4.00% due to the fact that it, by virtue of its structure, represents a combination of distinct IO tranches, each stripped off its respective principal-bearing tranche and thereby satisfying the specified portions test.
17.2 OAS Distribution Analysis
OAS price distribution analysis sheds additional light on the potential difference in price performance between the MBS 4.00% full IO strip and the sequential IO strip.
Figures 17.3 and 17.4 illustrate the MBS 4.00% IO price distribution and the sequential IO tranche. The option-adjusted spread price distribution is based on 200 rate paths (trajectories) and setting the random seed to 300. The OAS analysis supports the intuition presented in the previous section. That is, the sequential IO exhibits lower relative price sensitivity to simulated rate path trajectories than does the MBS 4.00% full IO strip.
- The sequential IO relative potential price upside is less than that of the MBS 4.00% IO. However, its relative potential price downside is also less than that of the MBS 4.00% IO.
- The relative price stability of the sequential IO is due to its lower IO strip, In particular:
- The sequential IO strip reports a shorter effective duration (−5.07) versus (−7.55). The sequential IOs shorter effective duration relative to the full strip's longer effective duration implies a lower overall price volatility.
- The key rate duration analysis shows the sequential IO strip carries less key rate exposure to the longer dated key rate tenors (10-year and greater) than the does MBS 4.00% IO strip, which serves to limit its price volatility.
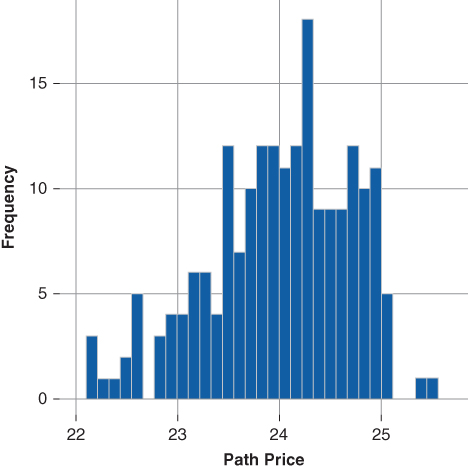
Figure 17.3 SMBS 4.00% IO Price Dist
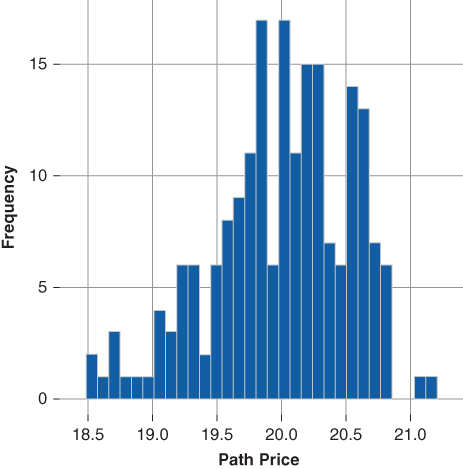
Figure 17.4 SEQ IO Price Dist.
In the case of the sequential IO strip, the division of principal (time-tranching) and interest (the coupon stripping of each sequential tranche) results in an IO cash flow and risk profile exhibiting greater overall stability relative to that of its comparable MBS 4.00% full IO strip.