EXHIBIT 8-1 Techniques for Measuring Price Sensitivity
Research Techniques to Supplement Judgment
Look into nature, and then you will understand it better.
Albert Einstein1
Quantitative estimates of customer price sensitivity and willingness-to-pay can substantially improve both price setting and price segmentation. Indeed, some estimate of price sensitivity, whether it be quantitative or qualitative, is required for the price-setting process described in Chapter 6. Sometimes research can provide very specific estimates of the impact of prices on sales volume. Other times estimates provide only a rough indication of a customer’s willingness-to-pay given a set of circumstances. At their worst, estimates of price sensitivity fail to reflect the real nature of the buying decision, misleading management to make ineffective pricing decisions. This is often the case when a research design causes respondents to pay much more attention to price than real customers would.
In almost all cases, it is possible to develop an estimate of price sensitivity. The key to using the estimate effectively is to recognize that even a precise estimate is not necessarily accurate or unbiased. It is only an approximation of the actual value of a customer’s price sensitivity. We always need to consider how differences between a real purchase situation in the future and an experiment in the present or past can change the impact of price on a customer’s choice. There are numerous procedures for measuring and estimating price sensitivity. Each procedure offers particular advantages in terms of accuracy, cost, and applicability, so the choice is not arbitrary. One must think carefully about the appropriate procedure for any particular product before beginning research. In no case should a manager use a technique just because it is cheap, convenient, or fast. Instead, managers need to carefully assess their needs and adopt techniques that are most appropriate for their situation. Even if the cost for those techniques is high, the benefit is often sufficiently large to justify the expense.
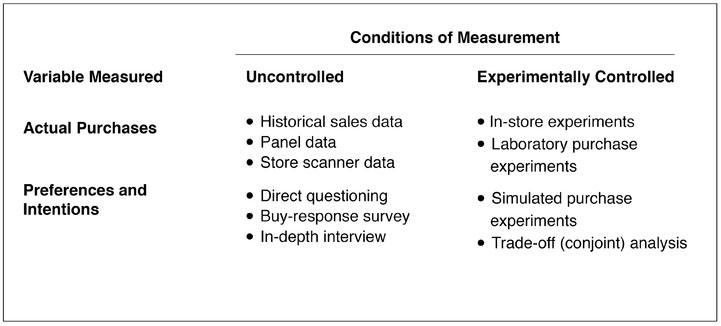
Procedures for estimating price sensitivity differ on two major dimensions: The conditions of measurement and the variable being measured. Exhibit 8-1 classifies the various procedures according to these two dimensions. The conditions of measurement range from a completely uncontrolled to a highly controlled research environment. When making uncontrolled measurements, researchers are only observers. They measure what people actually do, or say they would do, in a situation not of the researcher’s making. For example, marketing researchers might collect data on consumer purchases of laundry detergent in a grocery store, but the prices and other variables that influence those purchases are beyond their control. This is often the case when analyzing historical sales data.
In contrast, when making controlled measurements, researchers manipulate the important variables that influence consumer behavior to more precisely observe their effect. Researchers conducting a controlled study of price sensitivity for a laundry detergent could select the prices as well as the advertising and shelf placement of various brands in order to make the data more useful. They might attempt to gain even more control by conducting a laboratory experiment in a simulated store, carefully selecting the individuals whose purchases would be recorded. Participants for the experiment could be chosen to represent various demographic variables (such as geographic location, gender, income, and family size) in proportions equal to those of the product’s actual market or to represent a particular group (such as mothers with children) to whom the product was intended to appeal. Generally, controlled research produces more accurate estimates of the effects of the controlled variables on price sensitivity, but depending on the level of realism, it is often costly to implement in a real-world setting. A laboratory setting is often used to better control other factors that may affect price sensitivity as well as to reduce costs, but these improvements come at the expense of realism.
EXHIBIT 8-1 Techniques for Measuring Price Sensitivity
The dependent variable for estimating price sensitivity is either actual purchases or purchase preferences and intentions. Actual-purchase studies measure behavior, whereas preference-intention studies measure the intended choices that people claim they would make in a hypothetical purchase situation. Since the ultimate goal of the research is to estimate how people respond to price changes in actual purchase situations, research that measures actual behavior is generally more desirable, but it is also more costly, time-consuming, and sometimes impractical, given the need to move products to market quickly. The following discussion summarizes these research techniques and some of the trade-offs of choosing one method over another.
One way to estimate price sensitivity is to analyze past sales data. Naturally, one would expect this to work well in assessing the price sensitivity of customers for existing products in which consumers have prior-use experience. Given the increased use of scanners in supermarkets and mass merchandisers, databases maintained by hotels and airlines on their most frequent customers, and user profiles by online sellers, analysis of historical pricing and sales data has become an important source of information to evaluate customer response to pricing, promotions and other marketing activities. Still, changes in (i) the number of brands on the market, (ii) how recently competitors offered price promotions, (iii) the amount and effectiveness of advertising by each brand, (iv) increased price sensitivity of more-educated consumers, and (v) general economic conditions can undermine the ability of historical data analysis to diagnose the true effects of a price change.
There are three types of past sales data from which a marketing researcher might attempt to estimate price sensitivity: (i) Historical sales data—sales reports from a company’s own records or from a sales-monitoring service; (ii) panel data—individual purchase reports from members of a consumer panel; and (iii) store scanner data—sales data for an individual retail outlet.
Sales data collected as part of a company’s regular operation are cheap and available for all products that have prior sales histories. Given the ability to actually track data on a daily or even real-time basis, marketers are able to analyze trends and project future movement of product sales. One needs to be careful in recognizing that sales data only allow for the estimation of price elasticity of the next level in the channel. For example, in a retail environment, unless a manufacturer sells directly to the end-user, its sales data reflect shipments to retailers, not actual retail sales during the period. Retailers may stockpile products purchased at promotional prices with no intention of passing the savings on to the consumer, or in anticipation of increases in demand on the part of consumers in a later period. Understanding this, some marketers at manufacturers have direct links with the inventory movement of their retail outlets, combined with up-to-date retail price data. While this is generally part of a manufacturer’s inventory-management system to facilitate timely replacement of stock, it also provides the marketer with instant data that can be analyzed for important trends in demand.
In the past, using historical data for any product not sold directly to the end consumer was problematic. Sales data was usually available only at an aggregated level for a long period of time—say, a week. In any given week, some stores will charge higher prices than others. Over time, the same store will put the product on sale for a week and then return its price to the regular level. These price variations influenced sales, but were masked by the aggregation.
Unfortunately, data that aggregate sales for all stores over a number of weeks conceal these individual price differences. Given the aggregation in the data, the researcher is forced to explain sales variations by looking at only the average retail price across stores and throughout the time period. Since average prices have less variation and fewer observations than actual prices at individual stores in particular weeks, the data have less statistical power than data on individual purchase prices. In addition, some stores serve segments that are substantially more price responsive than others; for example, a drug store located in a posh downtown area is often frequented by consumers who are less price sensitive than those who might shop at a suburban location of the same retailer. As a result, aggregated sales data can mask these differences and will lead to price elasticity estimates that may, on average, be correct, but do not really apply to any single store setting.
Now, however, nearly all retailers track their sales and most sell their data to manufacturers (often via third party data aggregators). Since sales can be observed within short time-frames, and loyalty cards can enable tracking changes in an individual shopper’s behavior over time, researchers today have more tools, and more data than ever before to readily track the impact of regular and promotional price differences.
A number of marketing research companies collect individual purchase data from panels of a few thousand households. Each household keeps a daily record of all brands purchased and prices paid, or uses a special credit card that tracks purchases. Since products are purchased daily, the data for each household must be aggregated to produce a series on weekly or bi-weekly purchases. Such data have a number of advantages:
One potential drawback is that panel data may not be adequately representative of the market as a whole. Of all households invited to join a panel, fewer than 5 percent accept the offer and accurately record their purchases. There is reason to suspect, therefore, that panel members are a biased sample of the population. Moreover, the fact that panel members must record their purchases tends to make them more price aware, and thus more price sensitive. This problem increases the longer a household participates in a panel. Fortunately, technological advances have enabled research companies to develop panels that do not require consumers to record most of their purchases.4 Instead, in-store scanners record purchases automatically whenever panel members identify themselves in the store’s checkout line. This vastly simplifies panel membership, increasing the panel participation rate to more than 70 percent and attenuating the problem of heightened price awareness. Further, the data tend to be more representative of real purchasing behavior of consumers without the bias that has been problematic in the past.
A second potential drawback to panel data is that typically only one member of the household agrees to participate in the panel, yet in most households multiple people perform shopping duties. As a result, it is easy to miss purchase data from the non-participating member(s) of the household, who often have very different criteria for making purchase decisions. For example, if the non-participating family member joins a discount warehouse club and purchases cereal by the bushel, the family is essentially out of the cereal market for a while, no matter how substantial a discount is offered to the participating panel member.
Even with these caveats, panel data remains valuable. Given the ever-widening use of scanners and the ability to link scanner data with panel data, increasing numbers of consumer products can be analyzed using this type of analysis. The superiority of panel data estimates over those from aggregate sales data is due to the availability of more observations from a shorter and more comparable time period. With the availability of advertising and other promotional data, researchers are able to estimate price sensitivities for different customer groups with a reasonable degree of reliability (see “Using Panel Data to Measure the Impact of Promotion on Choice” below). Since multiple companies share the cost of the same ongoing research, estimates based on panel data are also less expensive than estimates based on an equal number of observations from proprietary research.
Using Panel Data to Measure the Impact of Promotion on Choice
As an example of how panel data can be used, consider a study where the authors asked two important questions: Whether consumers are getting more price sensitive and whether the group of price-sensitive consumers is growing. To evaluate these and other questions, the authors examined more than eight years of usage data from a panel of consumers and were able to compare those data with quarterly advertising data from manufacturers of non-food household products. They were able to evaluate three different types of price promotions: Temporary price reduction, price feature of the product, and the offering of a coupon. A multinomial logit model was used to evaluate the impact of the promotional (price and non-price) activities on the consumer’s choice of a product. Further, they were able to segment users into loyal and non-loyal segments and compare the price sensitivities of the two groups. The summarized results are shown in Exhibit 8-2.
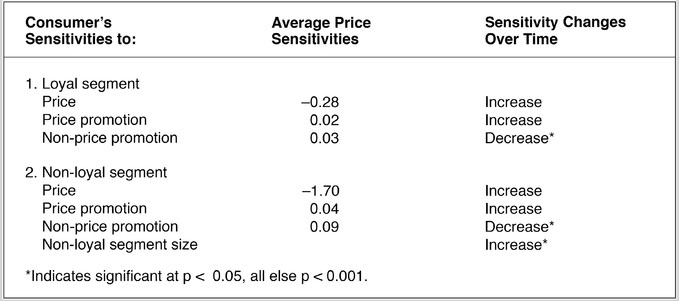
EXHIBIT 8-2 Regression Analysis Results
Price sensitivities shown are averaged across all of the periods analyzed. Based on the elasticities, the loyal segment showed little price sensitivity, but it did increase over time. The non-loyal, price-oriented segment showed higher price sensitivities that increased over time as well. The study authors did note that the size of the non-loyal segment increased over time, indicating that “an increasing proportion of consumers have become more price and promotion sensitive over time.”
Source: Carl F. Mela, Sunil Gupta, and Donald R. Lehmann, “The Long-Term Impact of Promotion and Advertising on Consumer Brand Choice,” Journal of Marketing Research 34 (May 1997), pp. 248–261.
An alternate source of actual sales comes from auditing price transactions and sales at individual retail stores. Modern point-of-sale technologies have made accurate daily sales and price data available at reasonable cost. Retailers, both online and bricks-and-mortar, generate such data as part of their normal operations. The high frequency of transaction-level data makes it vastly superior to aggregate sales data, providing marketers with almost immediate information on the movement of their product. Although transaction data alone lacks the balanced and complete demographics of consumer panel data, mechanisms such as loyalty cards and online profiles allow many transactions to be connected to specific consumers to study differences across consumer segments and to track changes in purchase behavior over time.
Transaction data generally also costs less than panel data. When store scanner data can be combined with panel data that track the demographic and broader behavioral characteristics of consumers, researchers often get huge insights into shoppers’ price sensitivity and purchasing behaviors. Transaction data are a major source of information on the price sensitivity of consumer-packaged goods.5
While transactional sales data—in the form of panels, purchase histories, and scanner data—are quite prevalent in the consumer-packaged goods industry, in many business-to-business markets there are simply too few transactions and insufficient market oversight to develop similar data sets. However, not all is lost. We recently spoke with a company that created a competitive sales database. This company, a tractor manufacturer, created an internal database in which its sales force would register any competitive bid information. Over time the company built a database of competitive price information which, combined with the record of its own bid outcome history, allows the firm to estimate the price sensitivity of customers, by segment if necessary, as well as to estimate the incremental value its tractors offered over the competition. The total investment for creating this competitive intelligence capability was on the order of $50,000—a small sum for this multi-billion dollar company.
In this case, there is some level of bias in the data that one needs to be aware of—the competitive quotes are being obtained from customers who have an incentive to provide lower-than-actual prices. One thus needs to adjust the distribution to reflect the bias; if one can confirm actual quotes for a sample of transactions, then it is possible to estimate the actual level of bias. One also needs to be careful to normalize competitive quotes so that equivalent comparisons are being made. Are after-sales services, special financing terms, or training included, for example? Companies such as Gigwalk have cultivated a cloud-based workforce that can rapidly execute a range of tasks such as gathering in-store prices across the country, sourcing competitive price information, completing short surveys, and gathering other market insights.6
Further, when the quote history is overlaid with actual sales success data, it is possible to estimate the likelihood of achieving a sale at any given price level. It also is possible to estimate the decline in the probability of a sale as price increases—a form of estimating price sensitivity as well as a way to estimate the amount of money left on the table in successful bids.
Finally, as firms update their pricing capabilities, many are discovering new opportunities to study responses to pricing actions. For example, as companies invest in technologies that allow for rapid and frequent price changes, they can look to yield management techniques that allow for the study of demand changes in response to pricing actions. Motel 6 for example, has the ability to post prices electronically on its billboards and can change these prices—at nearly no cost—by the hour. In only a short span of time, this company can study the price responsiveness of its customers by location, by day of week, and even by time of day. As companies add to their ability to set and manage prices, new opportunities will become available to create “natural experiments” to allow for the study of price reactions at relatively low cost.
Analysis of historical sales data often involves application of multivariate regression analysis. This statistical technique attempts to show how much of the historical variation in a product’s sales can be explained by each of the explanatory variables, including price, that the researcher includes in the analysis. One should not expect, however, that the researcher will necessarily succeed in identifying the effect of price with such an analysis. For example, if there has been little historical variation in a product’s price, then no statistical technique applied to its sales data can reveal the effect of price changes. Another common challenge in pricing analytics is the effect of multi-collinearity: If another variable—such as advertising—is always changed along with price, perhaps to advertise a price discount, it is very difficult to disentangle the impact of the price discount from the promotion. Fortunately, there are many sophisticated multivariate techniques available to help with such situations; a detailed discussion is beyond the scope of this book. We recommend the reader interested in advanced modeling techniques to consult a good econometrics textbook.7
In any case, one must be careful to recognize the limits of a successful analysis of historical data. To estimate any equation, the researcher must develop a mathematical form for the relationship between price and sales, taking into account other inputs that may affect the buying decision such as competitive prices, consumer confidence, weather patterns, among other factors. To the extent that the assumed form incorrectly specifies the relationship, estimates of price sensitivity may be misleading. Moreover, the researcher’s estimate of price sensitivity is valid only over the range of price and other input levels used to estimate the relationship. There is no reason to believe that the same relationship would necessarily apply to price changes outside that range. One also needs to be careful to look at the size of the corresponding error terms in the model to understand its quality and accuracy.
Finally, regardless of how well an estimated equation fits past data, its value in predicting the effect of future price changes rests on the assumption that the future is like the past. The more other factors change, the less the past can predict the future. Despite these limitations, if a researcher has a lot of historical data with enough price variation in it, useful estimates of price sensitivity are possible.8 For multiproduct companies, an understanding of price responsiveness can be used to help optimize demand flow across a product line. Specifically, prices can be adjusted to direct demand to specific products to better manage inventories, obtain better leverage with suppliers, and yet at the same time allow a wide product selection for customers who require specific items.
Exhibit 8-3 shows the results of research that utilized regression analysis to evaluate the relative importance of interest rates (a form of credit-card pricing) relative to other product attributes among two groups of credit-card holders: Those who are loyal (more than one year of ownership) and those who are new (less than one year). The categorization of customers as new or loyal was based on input from the managers of the credit-card company, who found that people who used their card for at least one year tended to stay users for an extended period of time. Of interest is the marginal increase in price sensitivity as measured by sensitivity to interest rates, for non-loyal customers (attribute importance of 0.16 compared to 0.14 for loyal customers) and the very large difference in need for service. As is the case in many product categories, the relative importance of price—and other elements of the offer—can vary significantly over time and across customer segments. Understanding where these differences reside usually leads to more precise targeting of offers and key messages in order to drive sales more cost-effectively.
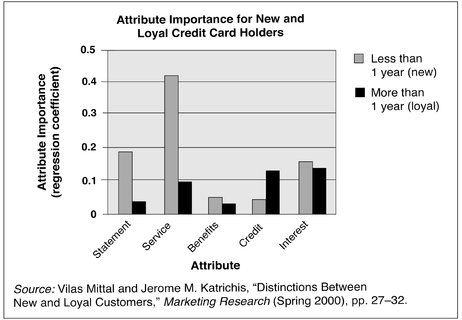
EXHIBIT 8-3 Use of Regression Analysis
A researcher might attempt to estimate price sensitivity by generating experimental purchase data. Such data may come from pricing experiments conducted in a store without the buyers’ knowledge or from pricing experiments conducted in a laboratory. Since the researcher controls the experiment, price variations can be created as desired to generate results while holding constant other marketing variables, such as advertising levels, in-store displays, or competitive prices which often change with price variations in uncontrolled sales data.
With this method, the researcher can examine the effect of a number of different prices quickly and either (i) exclude many unwanted external effects in the laboratory experiment or (ii) establish a control for the in-store experiment that will take account of them. Moreover, all this can be done while still providing buyers with purchase decisions that are comparable to those they make under normal conditions. As a result, to the degree that the experimental setting reflects the actual purchase environment, experimental research provides fairly reliable estimates of price sensitivity.
An in-store purchase experiment relies on actual purchase data collected when buyers are unaware that they are participating in an experiment. Although the term “in-store” reflects the fact that most such experiments are conducted in stores, the principles of in-store experimentation are equally applicable to any natural purchase environment. Such experiments are often easier to conduct for products sold through more controlled direct-retail methods, such as online sites, where a user’s web browser cookie history can be used to determine the offer to deliver and to track response. For example, the researcher can select a subset of registered users to receive offers with experimental prices that differ from those in the regular website. Even in direct sales to business, one can sometimes select a representative sample of customers. When, for example, Quaker Oats conducted an in-store experiment that focused on the effect of price alone, the study required 120 stores and ran for three months to provide enough data to create accurate market insights. Such studies can easily cost several million dollars.9
In addition to the financial and time cost of in-store experiments, there are other drawbacks. There is the potential loss of consumer goodwill when some buyers are charged higher prices than others. On the other hand, charging prices below normal can become too costly when the product is a large-expenditure durable such as a car or a piece of industrial equipment. An in-store test also involves the very real risk of being discovered by a competitor. If the product is new, a company may not wish to give its competitors an advance look. Moreover, when competitors find out about a test market, they may take steps, such as special promotions or advertising in selected areas, to contaminate the results.10 Thus, although in-store experiments have the potential for yielding very high-quality estimates, market researchers are more often forced to use alternatives. The closest of those alternatives is a laboratory purchase experiment.
Laboratory purchase experiments attempt to duplicate the realism of in-store experimentation without the high cost or the possible exposure to competitors. A typical laboratory experiment takes place in a research facility at a shopping mall. Interviewers intercept potential participants who are walking by and screen them to select only those who are users of the product category being researched. Based on information from a short pre-test questionnaire, the researchers can control the proportion of participants in each demographic classification (for example, gender, age, race, income, or family size) to ensure that the experimental population is representative of the actual population of buyers, a technique known as proportionate sampling. If members of some demographic categories cannot be found in adequate numbers in the mall, telephone interviews may be used to contact such people and offer them an incentive to come and participate in the experiment.
The laboratory researcher can control who participates and can quickly manipulate prices and other elements in the purchase environment (such as shelf location and point-of-purchase displays), all at a single location. Moreover, the researcher can almost entirely eliminate external factors, such as changes in competitors’ prices, stock-outs of competing products, or differences among stores that may contaminate the results of an in-store test. Participants exposed to different prices see exactly the same display at the same location in the laboratory experiment. Even effects associated with the time of day can be controlled by constantly changing prices for each new participant in the experiment. Thus, if testing three different price levels, approximately one-third of the consumers who take the test at any hour can be exposed to each price level. This ability to control the experiment so closely enables the researcher to draw inferences from far fewer purchases in much less time than would be possible with an in-store experiment.
Laboratory research facilities vary greatly depending on the sophistication of the research organization and the budget of the client company. The simplest facilities may consist of an interviewing room with a display of products from a single product category. The price for each brand is clearly marked, and the participant is invited to make a purchase. In theory, since the consumer is actually making a purchase, or can choose not to buy at all, the purchase decision in a simple laboratory experiment is the same one that the consumer would make shopping in an actual retail store. In practice, however, that conclusion may not be true. The problem lies in the artificiality of a simple laboratory environment. First, a single display in a laboratory encourages the consumer to give the purchase decision much more attention than would be typical in an actual shopping situation. Research indicates that most consumers are not entirely aware of price levels in a store, nor are they acutely aware of the magnitude of price changes.11 In a laboratory, however, consumers do not want to appear careless. They are, therefore, much more likely to note and respond to price differences. Second, when consumers know they are being watched from behind two-way mirrors, they may act “as they think they should” rather than as they would in real life. Thus some consumers may buy the low-priced brand just to appear to be smart shoppers, or the high-priced brand so as not to appear stingy. They may also buy something from the category out of a feeling of obligation to the researcher who gave them the money, even though they would not buy from that category in a store.
To overcome these limitations, a few research companies offer highly sophisticated laboratory research facilities. The most elaborate facilities attempt to duplicate as closely as possible the actual conditions under which consumers buy the product. These facilities contain complete simulated stores the size of small convenience stores. Before entering the simulated store, consumers may view reruns of television programs that have embedded television commercials for the research product, or they may read magazines that contain print advertisements for the product. When consumers finally enter the store, they are invited to do all their shopping, purchasing whatever they want, just as they would on a regular shopping trip.
The cost of even the most sophisticated laboratory experiment is only a small fraction of the cost of in-store testing. As a result, the leading marketers of consumer packaged goods and small appliances rely extensively on this research technique when making pricing decisions.12 In the past decade, the number and frequency of laboratory purchase experiments for products sold online has boomed. The cost to design a realistic purchase environment, to control the promotional message, and to recruit respondents online is so low that it is possible to test more frequently, to get answers faster, and to employ much larger samples than marketers would usually have considered. Companies that design this type of research can solicit participants via pop-up ads on targeted websites. To reach buyers in very “thin” markets, such as purchasers of industrial equipment or adventure vacations, marketers can buy specialized panel data from research vendors to solicit participants. Consequently, a realistic internet purchase experiment can take as little as a week and cost one-tenth what similar research would cost in another purchase environment. The story below, “Measuring Price Sensitivity for e-Books,” describes a laboratory experiment for a company considering entry into an existing online marketplace.
Measuring Price Sensitivity for e-Books
An online retailer wanted to test its ability to price some popular electronic book titles above the established level of $9.99 or less per download. If proven successful, the retailer felt that publishers would become less resistant to publishing their latest and best titles digitally. The retailer hoped to understand whether its customers would accept a segmented pricing model with higher prices for new, bestseller titles—particularly since bookstores generally price hard copies of newly released titles as loss leaders to draw store traffic. Such a model might use a lower e-book price for older titles that had migrated to paperback while continuing to price e-book titles that are still in hardback at higher prices.
The company engaged a research firm to design an online laboratory experiment, recruit 2,000 respondents, and analyze the results. To protect its reputation, the online laboratory store was given a fictitious name. The goal of the experiment was to understand the extent to which higher prices would affect consumers’ e-book purchase behavior. The market research company spent one-and-a-half weeks designing the experiment and recruiting respondents from email lists of electronic book purchasers. Respondents participating in the experiment were first asked their genre preferences, following which they were presented with several e-book options in each of their preferred genres. The e-books varied in price and time since publication. Some e-books were given prices above the standard $9.99 and some were priced at or below $9.99. The experiment was designed to replicate, as closely as possible, the experience a consumer would have purchasing a book online. Respondents were asked to add e-books to their shopping basket as if they were actually shopping on a website and they could monitor how much they had in their shopping cart. At the end of the experiment, respondents were presented with their total order and cost and given the opportunity to remove items from their shopping basket before confirming their order.
Only one-and-a-half weeks after the launch online, more than 2,000 respondents had completed the experiment through confirming a purchase. After another week, the research company had completed its analysis of price sensitivity by demographic, type of book, and various other segmentations.
Exhibit 8-4 shows the answer to the retailer’s main research question. The online experiment demonstrated that e-book demand is relatively price inelastic for prices below $9.99 but very elastic for prices above $9.99 for titles generally available anywhere. However, respondents did show a willingness to purchase new titles, not generally available in paperback or in e-book format, at prices above $9.99. The experiment proved very insightful for the online book retailer. They learned that there was some upward flexibility in their prices for newer books, but a downward adjustment for older books would not generate sufficient additional purchases to justify the drop in price. As a result of the experiment, the retailer decided to launch a segmented pricing model, offering publishers the chance to earn higher profits on e-book sales if they authorized them along with the hardback edition.
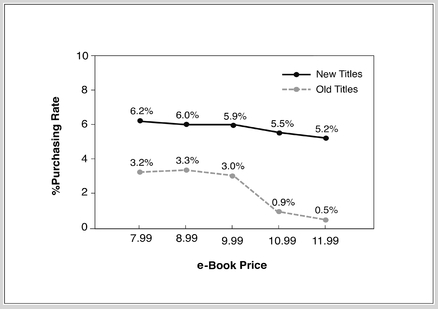
EXHIBIT 8-4 e-Books: Purchase Rate by Price Source: Deloitte research. Although this description is based on an actual study, some details have been changed to maintain client confidentiality.
The most common research technique for directly estimating price sensitivity is the survey of brand preferences or purchase intentions. Companies prefer to measure preferences or intentions, rather than actual purchases, for a number of reasons:
Unfortunately, the problem with survey research is that many consumers do not provide answers that are a reliable guide to their actual purchase behavior. The reasons are varied, but one of the main issues is that surveys require a level of abstraction that the respondent may or may not be able to perform. This is especially true of new products that are wholly unfamiliar or whose application is not readily apparent. As a result, determination of value delivered, or willingness-to-pay, is difficult to arrive at even for a committed respondent. In order to solve this problem, some research companies cross-validate the results of one survey with the results of another, often using slightly different methods of data collection and questioning. For example, a firm might collect data using personal interviews and validate the results by telephoning a different group of respondents and asking the same set of questions. The closer the results are from the two samples and methods, the more valid and accurate the final results.
Very early in the development of survey techniques for marketing, researchers learned that it was futile to ask consumers outright, “What is the most you would be willing to pay for this product?” Direct questioning sometimes elicits bargaining behavior, with consumers stating a lower price than they would actually pay. Other times, it elicits a desire to please the researcher, prompting consumers to state a higher price than they would actually pay. Frequently, it simply elicits a cursory answer that consumers would change were they to give the question the same thought as an actual purchase decision. Consequently, uncontrolled direct questioning as a research technique to estimate price sensitivity should never be accepted as a valid methodology. The results of such studies are at best useless and are potentially highly misleading.
A slight variant of the direct-question survey involves showing consumers a product at a preselected price and asking if they would purchase at that price. Surprisingly, although directly asking consumers what they would pay usually yields meaningless answers, asking them if they would buy at a preselected price yields answers that are at least plausible. When the answers given by different consumers for different price levels are aggregated, they produce what looks like a demand curve for market share, sometimes called a purchase probability curve. (For more on purchase probability curves, see “Purchase Probability Curves: A Simple Buy-Response Study,” below). Presumably, questioning willingness-to-buy generates better responses simply because it is structured more like an actual purchase decision than as an open-ended question about what the consumer would pay. Also, the consumer has no opportunity to bargain with the researcher.13 Interestingly, there are a number of studies that have documented cultural differences that lead to large amounts of substantial and systematic variation in the accuracy of buy-response surveys across countries such as the United States, Germany, and Japan, among others.14
Another method for evaluating price sensitivity is to include price as one of the attributes describing a product or a purchase situation. Consumers rate the importance of each attribute using a variety of scaling techniques. Those scales can be a 1–5 or a 1–10 importance rating, or simply an evaluation of the percent of respondents mentioning the attribute as being important.15 This approach is problematic because responses tend to be offhand and overly positive, due to halo effects, where respondents tend to not carefully discriminate among listed attributes and give similar ratings or responses to many attributes, especially those adjacent to each other.
Purchase Probability Curves: A Simple Buy-Response Study—Opportunity for a Higher Price
A maker of software had developed an innovative financial management program that allowed consumers to both manage their finances as well as prepare their tax returns. To understand the impact of price on demand, the software company conducted a national study to assess how consumers would value the new technology and whether they would be willing to pay a premium. The research started with conducting in-home interviews of consumers (a research methodology known as ethnographic research) to understand how they thought about personal finances and how they managed them. An initial finding from the interviews was that consumers typically did not enjoy managing their finances for a host of reasons, including inevitable spousal tensions that arose when assessing household spending patterns. However, there was a general interest in tools that could make it easier to manage personal finances.
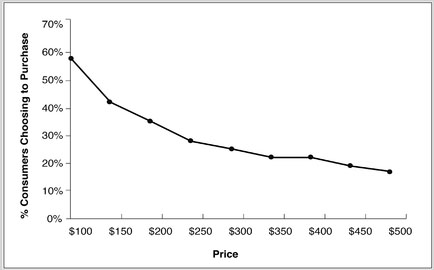
EXHIBIT 8-5 Purchase Probability Curve for Financial Software
With a basic understanding of the key attributes that consumers evaluate—such as an intuitive user interface, ability to automatically download bank statements, and automated updating of new tax codes— an online survey of 1,800 consumers was conducted. Each respondent was allowed to evaluate a sample copy of the software and was then asked the likelihood of purchase at prices that ranged from $100 to $500. The findings on purchase probability as a function of price are summarized in Exhibit 8-5. At $100, 58 percent of the consumers indicated that they would purchase the product. As price rose to $200, not surprisingly, fewer respondents were willing to buy. However for successive increases in price, the percent of respondents willing to buy did not change very much. While increasing the price from $300 to $500 made little difference in the proportion of consumers willing to buy the product, the study revealed a significant revenue opportunity by setting prices relatively high, as shown in Exhibit 8-6.
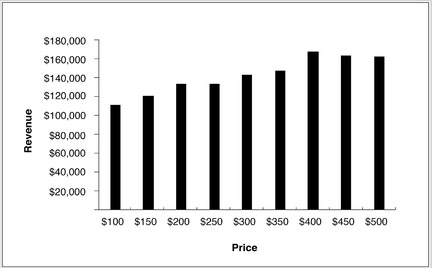
EXHIBIT 8-6 Total Revenue Estimate for Financial Software Source: Deloitte study. The product category and price levels have been changed to protect client confidentiality.
One cannot, however, treat buy-response data as directly comparable to or directly predictive of the sales that would actually occur at the corresponding prices in a store. Most problematic is the fact that consumers’ answers depend on their recollection of the actual prices of competing products. To the extent that they overestimate or underestimate competing prices, they will misjudge their willingness-to-buy. Even with this form of the question, some consumers will still want to please the researcher, or will fear appearing stingy, and so will falsely claim a willingness-to-buy the brand over competing brands regardless of the price.
Nevertheless, such research is useful (i) as a preliminary study to identify a range of acceptable prices for a new product, and (ii) to identify changes in price sensitivity at different points in time or place, assuming that the biases that affect these studies remain the same and so do not affect the observed change. For example, buy-response surveys for low-involvement consumer packaged goods often reveal little difference in consumers’ willingness-to-buy at different prices before they try a new product, but a significant difference at different price points after they have tried it. In interpreting the study, one would not want to take the absolute percentage of consumers who claimed they would buy as an accurate prediction of the percentage of consumers who would actually buy at different prices. However, differences in the stated probability of purchase before and after trial may reliably predict the change in price sensitivity caused by the product trial.
Intention measurement is also sometimes used successfully to predict actual purchases when researchers have past experience that allows them to adjust for the bias in subjects’ stated intentions. Typically, purchase intentions are measured by asking people to indicate which of the following best describes their likelihood of purchase:
The leading survey research firms have asked such questions of millions of buyers for thousands of products. Consequently, they are able to develop adjustments that reflect the average bias in these answers for various product classes.
An in-depth interview is a “semi-structured” method that is used to elicit responses from customers on how they use products and services, from which the research infers value rather than asking about value directly. The interview is often conducted one-on-one with a respondent and lasts for one to two hours. In a consumer environment, it is used to understand how individuals and families use products and how they might value different features or positioning approaches. In a business-to-business environment, the interviewers attempt to understand how businesses gain revenues or reduce costs by using a specific product or service. To do this successfully, one needs to have a deep understanding of the respondent’s business. In-depth interviews in pricing research are useful in (i) understanding which product or service features and benefits are important to a customer, (ii) assessing the monetary or psychological value of these features and benefits that a customer receives as a result of using the product or service, and (iii) assessing roughly what a customer might be willing to pay to obtain these features and benefits. In-depth interviews are also used to develop economic-value models of how much a customer could gain in monetary terms from purchase of the product. The model then becomes part of a promotional campaign to increase customers’ willingness-to-pay. Such models work well for business customers where most benefits can be translated into additional revenues or costs saved. It also works well in consumer markets where the benefit is a cost saving (for example, the value of buying a more efficient refrigerator), or where new usage opportunities may be uncovered.
Like a focus group, an in-depth interview is relatively unstructured and is usually conducted by an experienced interviewer who has a specific interview guide and objective, such as to quantify the value of differentiating features. In-depth interviews are used less frequently in market research due to the need for highly specialized interviewers, the relatively high expense per interview, and the small sample size.16 This is especially true for consumer pricing research for mass-market products and services. However, for more complex business-to-business pricing research, the interviews—in terms of the quality of information obtained with regard to customer value and willingness-to-pay—often yield fruitful insights and analysis. For example, in business markets, in-depth interviews enable the interviewer to probe customer needs, customer experiences, how they attempt to deal with problems, how the supplier’s products or services could solve these problems, and the value to the customer of the consequent savings or gains they would realize from using the firm’s products or services.
In-depth interviews do not ask customers directly how much they would be willing to pay. Instead, the interview focuses on the financial benefits to the customer that a product or service could influence. It is also possible to get a sense of perceived value by identifying other items that the customer buys to achieve the same benefit. One method used successfully in business-to-business markets, called “evocative anchoring,” asks respondents to identify items in their budget that they might consider a trade-off in order to obtain the value and benefits promised by a supplier’s proposed product or service solution. For example, when helping a software client to price relationship-management software, one identified benefit was reduction in customer turnover. By asking potential buyers to identify the costs of acquiring new customers, it became possible to estimate the value of customer retention.
In-depth interviews enable marketers to understand not only what someone might perceive their product or service to be worth, but also why it is worth that much. The in-depth interview attempts to understand the needs that the product addresses and how the product or service addresses them. The process often uncovers ways that suppliers can enhance their current product or service offerings and, in doing so, provide the basis for creating more differentiated products that can be sold at higher prices. It also exposes who in the buying organization has goals that are likely to benefit from purchase of the product.17
The interview must be conducted outside the context of a selling opportunity or a negotiation, since customers are unlikely to reveal value at such times. However, the data garnered often form the basis of a value-based selling approach in which salespeople, armed with an understanding of how their products differ from those of competitors and how those differences create value for customers, can justify their pricing to the customer and to themselves. Companies often can use the information gained from in-depth interviews to develop “value case histories.” These case histories describe the experience of a particular customer in using a firm’s products and the specific value that the customer received. These case histories eventually become a sales support tool.18
The in-depth interview is an excellent method for developing a better understanding of how different product and service features create value for customers, especially customers in a business-to-business environment. It is especially useful in moving beyond the core product and understanding how different service and support elements can create incremental value for a user and provide insights into how a product might be priced to capture that value. It often identifies similar service and support characteristics that can successfully differentiate what are often thought of as commodity products.19 A common concern is that customers won’t provide the data. However, our experience is that most customers are quite willing to share insights and data if it will help suppliers to serve them better.
Finally, a note on sample size: In-depth interviews do not require large numbers of respondents in order to elicit the key needs of the market. Multiple studies have shown that approximately 90 percent of key customer needs are uncovered with 10–12 interviews per major market segment.20 For most product categories, this translates into 40–60 interviews across the typical four to six segments that constitute a seller’s market. However, identifying key needs is not the same as estimating the prevalence of those needs. Qualitative interviews are often followed up with quantitative surveys that aim to estimate the portion of customers who identify with the key needs uncovered by the qualitative interviews.
To solve some of the problems of bias and extraneous factors when measuring preferences and intentions, researchers try to exercise some control over the purchase situation presented to respondents.
The questions must be designed to make the survey respondents consider the questions in the same way they would consider an actual purchase decision. The extent to which that can ever be fully accomplished is still an open question, but marketing researchers, recognizing the potential value of accurate survey information, are certainly trying.
Many researchers believe that the best way to get consumers to think about a survey question and to respond as they would in a purchase situation is to simulate the purchase environment as closely as possible when asking the survey questions. With this type of research, the researcher asks the consumers to imagine that they are on a shopping trip and desire to make a purchase from a particular product class. Or, in more sophisticated setting, respondents may be sent to a simulated store which can be either a physical or virtual location, to conduct the shopping exercise. In this setting, the researcher shows consumers pictorial representations, descriptions, or sometimes actual samples of brands, and asks the consumers to choose among them, given various prices. Since actual products need not be used, this technique enables one to test pricing for new product concepts, as part of a general concept test, before the concepts are actually developed into products.
The primary difference between such a simulated purchase experiment and a laboratory purchase experiment is that participants only simulate the choice decision to purchase a product and so do not get to keep their choices.21 The simulated purchase experiment is a widely used tool in pricing research that overcomes two important drawbacks of other types of surveys. If it is structured as a choice task among alternative brands, a consumer’s thought process should more closely approximate the process actually used when making a purchase. Also, since consumers have no way of knowing which brand is the one of interest to the researcher, they cannot easily think of the choice as a bargaining position or as a way to please the researcher. Thus, simulated purchase experiments can sometimes predict price sensitivity reasonably well.22
While any type of research is prone to bias, the simulated purchase experiments can often be an acceptable method for gaining quick and low-cost information on the buying behavior of consumers. If, for example, a company wants to estimate the price sensitivity of a product sold nationally, the cost of hundreds of in-store experiments throughout the country would be prohibitive. If the company conducted both an in-store experiment and a simulated purchase experiment in a few locations and found them reasonably consistent, it could confidently use the latter to cover the remaining locations and to conduct future research on that product class. Even if the experiment showed a consistent tendency to be biased, simulated purchase experiments could still be used successfully after the results had been adjusted by the amount of that previously identified bias.
An experimental technique, called trade-off (or conjoint) analysis, has become popular for measuring price sensitivity as well as sensitivity to other product attributes.23 The particular strength of trade-off analysis is its ability to disaggregate a product’s price into the values consumers attach to each attribute. Consequently, trade-off analysis can help a company identify the differentiation value of unique product attributes and, more important, design new products that include only those attributes that consumers are willing to pay for as well as how much they are likely to pay for the entire product and service package. Currently, trade-off analysis aids in the design of a range of products, from apparel and office equipment to household cleaners and vacation packages.
The basic data for trade-off analysis are consumers’ answers to questions that reveal not their directly stated purchase intentions, but rather the preferences that underlie those intentions. The researcher collects such data by asking respondents to make choices between pairs of fully described products or between different levels of product attributes. The product descriptions are designed to vary systematically in the levels of certain attributes that define the product as well as the price. When multiple priced levels are included in the study design, it is possible to assess not only the value assigned to certain product attributes but also to arrive at an estimate of price elasticity. The data are typically collected via an online survey, but can also be gathered via in-person interviews.24
After obtaining a consumer’s preferences for a number of product or attribute pairs, the researcher then manipulates the data to impute the value (called utility) that each consumer attaches to each product attribute and the relative importance that each attribute plays in the consumer’s purchase decision.25 With these data, the researcher can predict at what prices the consumer would purchase products containing various combinations of attributes, including combinations that do not currently exist in the marketplace. The researcher can also estimate how much of one attribute the consumer is willing to trade off in order to obtain more of another attribute—for example, how much more a consumer is willing to pay in order to obtain better fuel efficiency in a new automobile.
With similar data from a number of consumers who are representative of a market, the researcher can develop a model to predict the share of a market segment that would prefer any particular brand to others at any particular price. Since the researcher has collected data that reveal underlying preferences, consumers’ preferences can be predicted, or interpolated, even for levels of price and other attributes not specifically asked about in the questionnaire, provided the attributes are continuously measurable and bounded by the levels that were asked about in the survey. When the researcher knows independently the size of the market and the identity of market segments, it is possible to create a simulation model for testing different price-offer combinations. “A Conjoint Study: Blue Sky Ski Company” (below) provides an example of such a process. Readers should note how the basic features were varied along with price in order to develop a relationship between features and value, here termed “feature utility.”
It is useful to contrast trade-off analysis with direct questioning methods. By having respondents evaluate a product in its entirety rather than in the more abstract form of individual attributes, responses from a conjoint study are more likely to mimic actual choices. For example, in a recent study of MBA graduates, when asked about individual job attributes, the most important was not financial reward. Instead, MBA job seekers ranked intellectual challenge of the work and job location as more important than financial rewards.26
Of all the methods used to estimate price sensitivity from preferences or intentions, trade-off analysis promises the most useful information for strategy formulation. Researchers can do more than simply identify the price sensitivity of the market as a whole; they can identify customer segments with different price sensitivities and, to the extent that those differences result from differences in the economic value of product attributes, can also identify the specific product attributes that evoke the differences. Consequently, researchers can describe the combination of attributes that can most profitably skim or penetrate a market. The economic value of a product can also be identified, even when the product is not yet developed, by presenting consumers with different experimental product combinations in the form of pictorial and descriptive product concepts, or new product prototypes.
As a result of these promised advantages, the use of trade-off analysis by both market research firms and internal research departments has grown rapidly, but the performance of trade-off analysis is only as good as its ability to predict actual purchase behavior. There are a number of reasons why a prudent manager might suspect the reliability of this technique for some markets. Trade-off analysis is an experimental procedure that can introduce bias to the extent that it does not simulate the actual purchase environment. For items that are commonly purchased online, such as music, apparel, or insurance, online conjoint surveys can realistically mimic an actual purchase environment. For other types of purchases such as homes, restaurant meals, or many B2B transactions that are usually negotiated in person, an online conjoint survey provides more directional guidance that should be augmented with managerial judgment, experience from analogous products, or in-depth customer interviews to better understand the purchase decision process.
Another potential source of bias is that the respondent of a conjoint test sometimes focuses more attention on price and price differences than may occur in a natural purchase environment, simply because side-by-side price comparisons are provided in the choice task. In situations where purchasers have difficulty obtaining and comparing price and product attributes in a real purchase situation, the conjoint study may overestimate the role of price. For example, research companies have compared the predicted effects of price on physicians’ prescribing decisions with data on the actual price of the pharmaceuticals they prescribed. Studies invariably predict much higher price sensitivity among physicians than, in fact, is revealed by prescribing behavior.27 Also, if respondents have little experience with the product category, as is usually the case with innovative product categories, the technique poorly predicts the trade-offs that customers will make because of their inability to map differences in features into likely benefits.
A Conjoint Study: Blue Sky Ski Company
A small sporting goods manufacturer designed a downhill ski that incorporated a unique vibration control technology, promising downhill skiers easier turning, reduced “chatter” on rough surfaces, and a general reduction in the physical effort of skiing. To commercialize the most financially lucrative offer, the company commissioned a market research study to address several questions that would inform the marketing strategy. Three of the research questions involved pricing:
To address these questions, a market survey was developed that collected information on skier demographics, ability levels, and willingness-to-pay for different types of benefits. The survey was administered to 1,200 skiers across North America. The survey revealed four major segments:
In addition to questions about personal demographics and past purchases, the survey included a conjoint-based simulated purchase exercise that asked respondents to evaluate several scenarios for their next potential ski purchase and indicate their most likely choice. Respondents were informed about the benefits of the new technology and then presented with several buying scenarios that included buying new skis with the electronic damping technology, buying well-known conventional skis, or keeping the skis they have and making no new purchase.
The early analysis of the survey generated disappointing findings: Overall the market was quite sensitive to price. Revenues were maximized at a price of $450, but the product captured a disappointingly small share with a rapid drop-off at still higher prices. Complicating matters, the company would incur a high variable cost due to the relatively high cost of manufacturing and the royalty arrangement with the patent holder. Even at a profit-maximizing price for the overall market, the initial conclusion was that the potential return was not worth the risk.
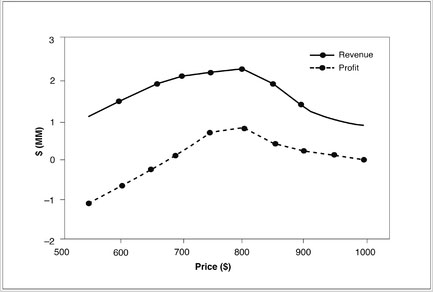
EXHIBIT 8-7 Analysis of Youth-Seeking “Innovators” Segment
Fortunately, one of the benefits of conjoint data is the ability to slice samples in different ways. Analysis of only the “innovators” revealed that they did indeed have a higher “take rate” for the product and, importantly, their take rate fell off much less rapidly at higher prices. Although only a small subset of the market, innovators could profitably support a price of $800 (see Exhibit 8-7: Youth-Seeking “Innovators” Segment). Furthermore, it turns out that it is much cheaper to sell to innovators because they actively seek out new products and tend to only shop at a handful of high-end specialty shops, not the national sporting goods stores. As a result, advertising costs are significantly lower, and the manufacturer would not require an extensive distribution network. Apparently the higher take rate among the innovators reflected a demographic subset: 35- to 50-year-old men who had, in their youth, been very good skiers but were now feeling the effects of age in their knees. The promise of lower effort, reduced chatter, and easier turning were benefits for which this group was willing and able to pay a significant premium. This finding opened the possibility that there was an opportunity to sequentially “skim” the market with a high initial price at launch.
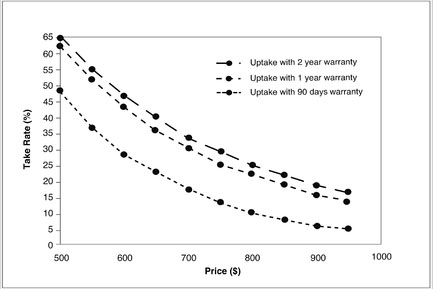
EXHIBIT 8-8 Effect of Warranty on Take Rate Source: Deloitte study. The product category and price levels have been changed to protect client confidentiality.
Finally, conjoint analysis enabled the company to isolate and measure the impact of individual features on willingness-to-pay and overall purchase rates. The research revealed that moving from a 90-day to a one-year warranty more than doubled the take rate of the product by respondents in the target segment (see Exhibit 8-8: Effect of Warranty on Take Rate).
Because trade-off analysis measures underlying preferences, researchers have the ability to check if an individual consumer’s responses are at least consistent. Consumers who are not taking the survey seriously, or who are basically irrational in their choice processes, are then easily identified and excluded from the sample. Even more comforting are three separate studies that show a high degree of consistency, or reliability, when subjects are asked to repeat a trade-off questionnaire a few days after having taken it initially.28 Since the subjects are unlikely to remember exactly how they answered the questions in the earlier session, the consistency of the answers over time strongly suggests that they do accurately reflect true underlying preferences. More comforting still is the result of a study showing that the exclusion from the questionnaire of some product attributes a subject might consider important does not bias the subject’s responses concerning the trade-offs among the attributes that are included.29 Although trade-off analysis is more costly than a simple survey, it also provides much more information. Given its relatively modest cost and the fact that it has met tests of reliability, trade-off analytics certainly warrants consideration, particularly to understand the value of features by segment when designing new products and offers.30
Numerical estimates of price sensitivity can either benefit or harm the effectiveness of a pricing strategy, depending on how management uses them. This is especially true when respondents have considerable experience with the use and purchase of a product. If managers better understand their buyers and use that knowledge to formulate judgments about buyers’ price sensitivity, as discussed in Chapter 6, an attempt to measure price sensitivity can be very useful. It can give managers new, objective information that can either increase their confidence in their prior judgments or indicate that perhaps they need to study their buyers further. An understanding of price sensitivity also provides a reference by which to judge proposed price changes—how will sales respond as we increase or decrease prices? Combined with variable cost data, it is possible to judge whether proposed changes in price will have a positive effect on profits.
Integrating soft managerial judgments about buyers and purchase behavior with numerical estimates based on hard data is fundamental to successful pricing. Managerial judgments of price sensitivity are necessarily imprecise while empirical estimates are precise numbers that management can use for profit projections and planning. However, precision doesn’t necessarily mean accuracy. Numerical estimates of price sensitivity may be far off the mark of true price sensitivity. Accuracy is a virtue in formulating pricing strategy; precision is only a convenience.
No estimation technique can capture the full richness of the factors that enter a purchase decision. In fact, measurements of price sensitivity are precise specifically because they exclude all the factors that are not conveniently measurable. Some estimation techniques enable the researcher to calculate a confidence interval around a precise estimate, indicating a range within which we may have some degree of statistical certainty that the true estimate of price sensitivity lies. In other cases a confidence interval can be estimated by considering how demand might change under different scenarios. Fortunately, a manager does not have to make the choice between judgment and empirical estimation. Used effectively, they are complementary, with the information from each improving the information that the other provides.
In any case, one needs to remember that estimating price sensitivity is both “Art” and “Science,” and both analytical rigor and managerial judgment need to be exercised. As described in earlier chapters, a consumer’s perception of price and value, and hence demand curve, can be influenced based on how the offer is structured, communicated, and based on which price metric is used.
Any study of price sensitivity should begin with the collection of information about buyers—who they are, why they buy, and how they make their purchase decisions—since those are the essential inputs in the formulation of judgment. At the outset, this information should come from open-ended, qualitative, or exploratory research that enables managers to discover facts and formulate impressions other than those for which they may have been specifically looking.31 In industrial markets, such research may consist of accompanying salespeople to observe the purchase process. After a sale, managers might follow up to ask how and why the purchase decision was made. One can also look at past bid histories to see the correlation between various price levels and the likelihood of winning the bid. In many cases, managers can interview important customers and intermediaries by telephone to gain their impressions about a variety of price and marketing issues.32 In consumer markets, such research may consist of observing consumers discussing their purchase decisions in focus groups or in-depth interviews as previously discussed. Insights generated from such informal observation could then be confirmed with more formal research in the form of a survey administered to a larger number of buyers.
Having formed judgments about buyers based on qualitative impressions developed from observing them, a manager will often find it practical and cost-effective to expand this understanding through original primary research that attempts to measure certain aspects of buyer behavior, such as price sensitivity. That attempt is far more likely to produce useful results, to the extent that management already understands the way buyers make their purchase decisions and uses that information to help structure the attempt at measurement. There are a number of ways that managerial judgment can, and should, guide the measurement effort:
The common failure to use this type of managerial input (or the failure of management to know buyers well enough to provide it) is no doubt one reason why research to measure price sensitivity is sometimes disappointing.
When measurement embodies managerial judgment, it is much more likely to provide useful information, but even then the results should never be taken uncritically. The first question to ask after any marketing research is, “Why do the results look the way they do?” The measurement of price sensitivity is not an end result but a catalyst to learn more about one’s buyers. If the results are inconsistent with prior expectations, one should consider how prior judgment might have been wrong. What factors may have been overlooked, or have been given too little weight, leading to the formulation of incorrect expectations about price sensitivity? One should also consider how bias might have been introduced into the measurement process. Perhaps the measurement technique heightened buyers’ attention to price or the sample subjects were unrepresentative of the product’s actual buyers. Regardless of the outcome of such an evaluation, one can learn more about the product’s buyers and the factors that determine their price sensitivity. Even when one concludes that the measurement technique biased the results, the bias reveals information (for example, that the low level of price sensitivity that management expected is substantially due to buyers’ low attention to price in the natural purchase environment, or that a segment of people who do not regularly buy the firm’s product has a different sensitivity to price).
Since the advent of the internet, market researchers and their clients are increasingly using online surveys for gathering customer and market data. Over 50 percent of surveys today34 are opened on mobile devices and online survey research is driving growth in the market research industry.35 Response rates are generally high because online surveys are minimally intrusive and simply require a response to an email. However, online research may be subject to some sampling bias—online respondents are not necessarily representative of the broader target population. Lower-income households, rural residents, and older people, for example, are less likely to be represented among online samples.36 Nonetheless, online research can be particularly effective for identifying very specific or specialized subgroups to target for research.
In addition to performing experiments and evaluating available sales data, one should be aware of the many external sources of data that are available to shed light on price sensitivity. Public records such as those found at government institutions or industry trade groups contain vast sources of data and information on historical sales trends, industry actions, as well as a record of other factors that may affect the market of interest. Market research firms specialize in performing the types of experiments and analyses described in this chapter. The journals published by various academic and industry institutions offer lessons from the past that may apply to new products. The Society of Competitive Intelligence Professionals (SCIP) is an industry trade group that is devoted to the quest of finding competitive intelligence.37
Other secondary sources of data for industrial markets, including the Census of Manufacturers, the Survey of Industrial Buying Power, and numerous other governmental and private sources,38 can tell sellers the types of businesses their buyers engage in and the share of the total market each accounts for, the average size of their purchases in major product classes, and their growth rates. In consumer markets, consumer panel surveys are widely available to tell managers the demographics of their buyers (income, family size, education, use of coupons), as well as those of their closest competitors. Other companies develop complete psychographic profiles of buyers that go beyond just demographics to delve into the innermost psychological motivations for purchase. These are relatively inexpensive sources of data from which management can form judgments about price sensitivity.
Regardless of the method of intelligence gathering, recognize that the key aim of the marketer is to listen to the voice of the customer, understand how product attributes get translated into benefits, and how benefits are converted into a willingness to pay money to obtain a good.
The choice among measurement techniques is not arbitrary. Each is more appropriate than another under certain circumstances. Information about trade-offs between price and attributes is most valuable when a company is developing new products or improving old ones. Since one cannot use historical data or a purchase experiment to test undeveloped products, one must turn to research on preferences and intentions that require only product descriptions or experimental prototypes. Trade-off (conjoint) analysis is a great choice at this point. But surveys of preferences, like conjoint analysis, sometimes yield poor predictions of actual price sensitivity in real-world purchase situations because they create an artificial purchase environment in which price awareness and knowledge of substitutes is made easy. At the time of product development, however, those are not factors about which management need be concerned. Product development focuses on efforts to enhance the attractiveness of the product when customers are aware of differences. Even when survey research accurately measures only the effect of product attributes on price sensitivity, it is a useful tool for product development, although it may be inadequate for actually setting prices later on.
Once a product is developed, management would like to have measurements that capture as many of the different determinants of price sensitivity as possible. In-store or sophisticated laboratory purchase experiments are definitely the first choice for frequently purchased, low-cost products. With few exceptions, such products are bought by consumers who have low price awareness and give the purchase decision little attention. Consequently, surveys to estimate price sensitivity for such products focus much more attention on price in the purchase decision than would occur naturally, thus distorting the estimates. The cost of in-store experiments, however, may make them impractical for testing on a large scale. In that case, management might best do a few in-store experiments with matched simulated purchase surveys. If the amount of bias in the latter is stable, the survey could be used for further research and adjusted by the amount of the bias between the survey and the in-store experiments.
When the fully developed product is a high-cost durable such as a television or a new car model, an in-store experiment is impractical. A laboratory purchase experiment may be practical since experimental control permits inferences from fewer purchases but will be too costly for many products. Fortunately, high-value products are also products for which consumers naturally pay great attention to price. In fact, they may give all aspects of the purchase careful thought because it involves a large expenditure. Consequently, a simple laboratory experiment or a simulated purchase survey may be reasonably accurate in predicting price sensitivity for these types of products. Even a buy-response survey may be useful to identify the range of prices that potential customers might find acceptable for such products, although the exact estimates of sales at various prices should not be treated with much confidence.
Once a product has been on the market for a while, historical data become available. Such data are most useful when managers are willing to implement marketing decisions in ways that can increase the research value of the data. For example, sales data become more useful if price changes are sometimes accompanied by a change in advertising and other times not, enabling marketing researchers to isolate their separate effects. A log of unusual events that cause distortions in the actual sales data (for instance, a strike by a competitor’s truckers may be causing stock-outs of the competitor’s product and increased sales of yours) is also extremely useful when the time comes to adjust the historical data. Moreover, as managers talk with and observe buyers, they should keep questions in mind that would aid the researcher using historical data. What is the length of the purchase cycle? To what extent do buyers purchase extra for inventories when price is expected to rise in the future? Even if historical data are so filled with random variations that no conclusions can be drawn from them with confidence, they may still point toward possible relationships between price and sales or other marketing variables that would be worth examining with another research technique.
Numerical estimation of price sensitivity is no shortcut to knowing a product’s buyers—who they are, how they buy, and why they make their purchase decisions. Numerical estimates are an important source of objective information that can supplement the more subjective observations that usually dominate managerial judgments about price sensitivity. As a supplement, they can substantially improve the accuracy of such judgments and the effectiveness of a firm’s pricing.
Measurement techniques differ in the variables they measure and in the conditions of measurement. The variable measured may be either actual purchases or preferences and intentions. Since the ultimate goal of research is to predict customers’ actual purchases, research based on actual purchase data is generally more reliable than research based on preferences and intentions. Unfortunately, collecting and analyzing actual purchase data costs more, requires much more time, and is entirely impossible for products that are not yet fully developed and ready for sale. Consequently, most research on price sensitivity infers purchase behavior from questions potential customers answer about their preferences and intentions.
Pricing research studies range from those that are completely uncontrolled to those in which the experimenter controls almost completely the alternative products, their prices, and the information that customers receive. Although research techniques that permit a high degree of experimental control are more costly than uncontrolled research, the added cost is usually worth it. Uncontrolled data on actual purchases are plagued by too little variation in prices and too many variables changing at once. Uncontrolled data on preferences and intentions are biased by people’s untruthful responses and by their inability to recall competitive prices. In contrast, controlled in-store experiments and sophisticated laboratory purchase experiments often predict actual price sensitivity well. Even experiments using preferences and intentions seem to warrant confidence when they are highly controlled. In particular, trade-off analysis is proving highly useful in predicting at least that portion of price sensitivity determined by the unique-value effect.
The appropriate technique for numerically estimating price sensitivity depends on the product’s stage of development. When a product is still in the concept or prototype stage, research measuring preferences or intentions is the only option. Trade-off analysis is especially useful at this stage because it can identify the value of individual product attributes, thus helping to decide which combination of attributes will enable the firm to price the product most profitably. When a product is ready for the market, in-store or laboratory purchase experiments are more appropriate because they more realistically simulate the actual purchase environment. After a product has been on the market for a while, actual purchase data can be an inexpensive source of estimates, provided that management monitors sales frequently and makes some price changes independently of changes in other marketing variables. Even when actual purchase data cannot provide conclusive answers, they can suggest relationships that can then be measured more reliably with other techniques.
Regardless of the technique used to measure price sensitivity, it is important that managers not allow the estimate to become a substitute for managerial judgment. The low accuracy of many numerical estimates makes blind reliance on them very risky. One always needs to be aware of the range of values an elasticity estimate can take, the factors that can influence price sensitivity, and one must generally get an understanding of the range of values one can expect. They always should be compared with a manager’s own expectations, based on his or her more general knowledge of buyers and their purchase motivations. When inconsistencies occur, the manager should reexamine both the measurement technique and the adequacy of his or her understanding of buyers. The quality of numerical estimates depends in large part on the quality of managerial judgment that guides the estimation process. Managers who know their buyers can get substantially better estimates of price sensitivity when they use that knowledge (i) to select a sample of consumers that accurately represents the product’s market, (ii) to identify and explain extraneous changes in sales that might camouflage an effect, (iii) to provide information to sort out the effects of price from other variables that tend to change with it, (iv) to identify an appropriate equation or experimental structure, and (v) to properly describe the product for survey research.
1. Albert Einstein, quoted by Margo Einstein in a letter to Carl Seelig, May 8, 1955.
2 . Actually, the researcher observes only the price that the consumer reports having paid. There is some risk of erroneous reporting, which weakens the data but does not bias it. Fortunately, this problem is being solved by technologies that enable consumers to avoid the task of reporting.
3. See Ronald E. Frank and William Massy, “Market Segmentation and the Effectiveness of a Brand’s Dealing Policies,” Journal of Business 38 (April 1965), pp. 186–200; Terry Elrod and Russell S. Winer, “An Empirical Evaluation of Aggregation Approaches for Developing Market Segments,” Journal of Marketing 46 (Fall 1982), pp. 65–74.
4 . The companies are Information Resources Inc. (headquarters in Chicago) and Burke Marketing Research (headquarters in Cincinnati, Ohio).
5 . See, for example, David R. Bell, Joengwen Chiang, and V. Padmanabhan, “The Decomposition of Promotional Response: An Empirical Generalization,” Marketing Science 18(4) (1999), pp. 504–526; Shuba Sriniva-san, Peter T. L. Popkowski Leszczyc, and Frank M. Bass, “Market Share Response and Competitive Interaction: The Impact of Temporary, Evolving, and Structural Changes in Prices,” International Journal of Research in Marketing 17 (2000), pp. 281–305; and Koen Pauwels, Shuba Srinivasan, and Philip Hans Franses, “When Do Price Thresholds Matter in Retail Categories?” Marketing Science 26(1) (January–February 2007), pp. 83–100.
6 . Gigwalk website: www.gigwalk.com.
7 . For example, Econometric Analysis, 7th edn., by William H. Greene (Boston, MA: Pearson, 2012) is an excellent resource, as is Econometric Analysis of Cross Section and Panel Data, 2nd edn., by Jeffrey Wooldridge (Cambridge, MA: MIT Press, 2010).
8. For a brief introduction to regression analysis, see Thomas C. Kinnear and James R. Taylor, Marketing Research: An Applied Approach, 4th edn. (New York: McGraw-Hill, 1991), pp. 626–628; or Mark L. Berenson and David M. Levine, Basic Business Statistics: Concepts and Application (Upper Saddle River, NJ: Prentice Hall, 1992), Chapter 16.
9 . William D. Barclay, “Factorial Design in a Pricing Experiment,” Journal of Marketing Research 6(4) (November 1969), p. 428.
10 . Paul Solman and Thomas Friedman, Life and Death on the Corporate Battlefield (New York: Simon and Schuster, 1982), Chapter 24.
11. James Allen, “You Cut Your Prices. So Why Didn’t Consumers Notice?” Wall Street Journal, February 20, 2017. Accessed at https://blogs.wsj.com/experts/2017/02/20/you-cut-your-prices-so-why-didnt-consumers-notice.
12 . Several good discussions of the increased use and application of laboratory test markets (called Simulated Test Marketing by the authors) can be found in Kevin J. Clancy and Robert S. Shulman, “Simulated Test Marketing: A New Technology for Solving an Old Problem,” in The Advertiser, by Association of National Advertisers (Fall 1995), pp. 28–33; and also in Kevin J. Clancy and Robert S. Shulman, “Test for Success: How Simulated Test Marketing Can Dramatically Improve the Forecasting of a New Product’s Sales,” Sales and Marketing Management (October 1995), pp. 111–114.
13. One might well argue that buy-response surveys should be included with the experimentally controlled studies since the researcher does exercise control over the price asked. That observation is correct. The reason that buy-response questioning is better than direct questioning is precisely because the researcher introduces a bit of control. Still, the amount of control that the researcher can exercise in these studies is slight. No attempt is made to control the respondents’ perception of competitive prices, exposure to promotion, or demographics.
14. Gerard Tellis and Deepa Chan-drasekaran, “Extent and Impact of Response Biases in Cross-National Survey Research,” International Journal of Research in Marketing 27(4) (December 2010), pp. 329–341.
15. Henry Assael, Consumer Behavior and Marketing Action, 4th edn. (Boston, MA: PWS Publishing Co., 1992).
16. For a good discussion on the application of and difference between focus group and depth interviews as unstructured/uncontrolled data-collection techniques, see Thomas C. Kinnear and James R. Taylor, Marketing Research: An Applied Approach, 4th edn. (New York: McGraw-Hill, 1991).
17. Abbie Griffin and John R. Hauser, “The Voice of the Customer,” Marketing Science 12(1) (Winter 1993), pp. 1–27.
18. James C. Anderson and James A. Narus, “Business Marketing: Understand What Customers Value,” Harvard Business Review (November– December 1998), pp. 53–65.
19. For an excellent discussion on the types of value drivers and how to uncover those value drivers in both consumer and business-to-business research, see Ian C. MacMillan and Rita Gunther McGrath, “Discovering New Points of Differentiation,” Harvard Business Review (July–August 1997), pp. 133–145.
20. Tellis and Chandrasekaran, “Extent and Impact of Response Biases in Cross-National Survey Research,” pp. 329–341.
21. D. Frank Jones, “A Survey Technique to Measure Demand under Various Pricing Strategies,” Journal of Marketing 39 (July 1975), pp. 75–77.
22. John R. Nevin, “Laboratory Experiments for Estimating Consumer Demand,” Journal of Marketing Research 11 (August 1974), pp. 261–268.
23. The first article on trade-off analysis to appear in the marketing literature was Paul E. Green and Vithala R. Rao, “Conjoint Measurement for Quantifying Judgmental Data,” Journal of Marketing Research 8 (August 1971), pp. 355–363. For a non-technical discussion of applications specifically to pricing, see Patrick J. Robinson, “Applications of Conjoint Analysis to Pricing Problems,” in Market Measurement and Analysis, ed. David B. Montgomery and Dick R. Wittink (Cambridge, MA: Marketing Science Institute, 1980), pp. 183–205.
24. For a more detailed perspective on how to design a conjoint study, see Vithala Rao, Applied Conjoint Analysis (Berlin Heidelberg: Springer-Verlag, 2014).
25. The following articles describe data manipulation procedures for conjoint analysis: J. B. Kruskal, “Analysis of Factorial Experiments by Estimating Monotone Transformations of the Data,” Journal of the Royal Statistical Society, Series B (1965), pp. 251–263; Dove Peckel-man and Subrata Sen, “Regression Versus Interpolation in Additive Conjoint Measurement,” Association for Consumer Research Proceedings (1976), pp. 29–34; Philip Cattin and Dick Wittink, “Further Beyond Conjoint Measurement: Toward Comparison of Methods,” Association for Consumer Research Proceedings (1976), pp. 41–45.
26. David B. Montgomery and Catherine A. Ramus, “Calibrating MBA Job Preferences for the 21st Century,” Academy of Management Learning & Education 10(1) (March 1, 2011), pp. 9–26.
27. Mariana Carrera, Dana Goldman, Geoffrey Joyce, and Neeraj Sood, “Do Physicians Respond to the Costs and Cost-Sensitivity of Their Patients?” American Economic Journal (2017, forthcoming).
28. Franklin Acito, “An Investigation of Some Data Collection Issues in Conjoint Measurement,” in Proceedings of the American Marketing Association, ed. B. A. Greenberg and D. N. Bellenger (Chicago: American Marketing Association, 1977), pp. 82–85); James McCullough and Roger Best, “Conjoint Measurement: Temporal Stability and Structural Reality,” Journal of Marketing Research 16 (February 1979), pp. 26–31; Madhav N. Segal, “Reliability of Conjoint Analysis: Contrasting Data Collection Procedures,” Journal of Marketing Research 19 (February 1982), pp. 139–143.
29. McCullough and Best, “Conjoint Measurement: Temporal Stability and Structural Reliability,” Journal of Marketing Research 16(1) (February 1979), pp. 26–31.
30. Bryan K. Orme, Getting Started with Conjoint Analysis (Madison, WI: Research Publishers LLC, 2005).
31. Bobby J. Calder, “Focus Groups and the Nature of Qualitative Marketing Research,” Journal of Marketing Research 14 (August 1977), pp. 353–364.
32. Johny K. Johansson and Ikujiro Nonaka, “Marketing Research the Japanese Way,” Harvard Business Review (May–June 1987), pp. 4–7.
33. For the reader trained in classical statistics, these suggestions for adjusting the data with managerial judgment may seem unscientific. But it is important to keep in mind that the purpose of numerical measurement of price sensitivity is to derive useful estimates, not to objectively test a theory. If managers have strongly held beliefs, in light of which the historical record of sales could yield much better estimates, it is simply wasteful to ignore those beliefs simply because they may not be objective. See Edward E. Leamer, “Let’s Take the Con Out of Econometrics,” American Economic Review 73 (March 1983), pp. 31–43.
34. “With mobile surveys, market research gets a makeover,” Fortune.com, March 25, 2014. Accessed April 14, 2017 at http://fortune.com/2014/03/25/with-mobile-surveys-market-research-gets-a-makeover.
35. Edward Rivera, “Market Research in the US—Industry Market Research Report”, ibisworld, report ID 199100 (October 2016).
36. “Internet Surveys,” online article at Pew Research Center. Accessed April 14, 2017 at www.peoplepress.org/methodology/collecting-survey-data/internet-surveys. See also “Who Has Home Broadband?” Internet/Broadband Fact Sheet, Pew Research Center, January 12, 2017.
37. See, for example, www.scip. org.
38. The Census of Manufacturers is a publication of the U.S. Department of Commerce. For other federal sources, see the Commerce Department publication titled A Guide to Federal Data Sources on Manufacturing. The “Survey of Industrial Buying Power” is published annually as an issue of Sales and Marketing Management magazine. Other useful sources of information about the demographics and motivations of buying firms can be obtained from the buying firms’ trade associations (such as the Rubber Manufacturers Association and the National Machine Tool Builders Association) and from privately operated industrial directory and research companies (for example, Predicasts, Inc., Dun & Bradstreet, Standard & Poor’s).