|
||
It was a German chemist living in London in 1820 who launched the first scientific attack on food fraud. Frederick Accum was not only a chemist, but also a great lover of food. He was distraught about the state of food in London at the time and began a one-man crusade to expose it for what it was. At the heart of his endeavours was his landmark book A Treatise on Adulterations of Food, and Culinary Poisons. Within its 360 pages lie numerous shocking accounts of food fraud, which opened the eyes of British consumers to the many ways they were being deceived in what they were eating and drinking. Accum’s book offered a number of easy methods – almost kitchen chemistry – for detecting some of the most common adulterations of food. He described a method for detecting alum (aluminium sulphate) in bread, using boiled distilled water, paper and pure nitric acid (no doubt a rare staple in most kitchens). There is great detail on how to recognise spurious tea leaves and test them using ammonia, a common ingredient in household cleaners. There were tests for counterfeit coffee, adulterated wine and other alcoholic beverages, cheese, spices, pickles, vinegar, cream, confectionery, custard, olive oil and mustard. There were tests to reveal sinister, even toxic or deadly materials such as red oxide and other colourants. Accum’s discoveries were a revolting revolution for the citizens of London.
Accum’s Treatise has many dispiritingly similar resonances with the questions asked of today’s food fraud detectives. The table of contents lists all too familiar vulnerable candidates for adulteration: wine, beer, spirits, tea, coffee, water, bread, dairy products, vinegar, spices, olive oil, pickles, fish sauce, etc. And the line in the preface to the Treatise ‘To such perfection of ingenuity has the system of counterfeiting and adulterating various commodities … found in the market, [been] made up so skilfully, as to elude the discrimination of the most experienced judges’ remains as true today as it was 200 years ago. Accum’s tests were a reflection of the embryonic state of analytical science at the time; nevertheless, they were able to reveal what we would now regard as crude, almost desperate deceptions. For the most part, his tests involved simple solubility, combustion, weighing, distillation and chemical ‘spot’ tests, requiring no sophisticated instruments. However, Accum’s work was just the beginning.
Arthur Hill Hassall, a British physician, chemist and microscopist, picked up on problems identified by Accum and expanded upon them using his microscope. Between 1851 and 1854, Hassall put over 2,500 food samples under microscopic scrutiny and published his findings (good and bad) in the Lancet. Hassall was highly influential in bringing into British law the Food Adulteration Act in 1860. This was reinforced in 1872 by the Adulteration of Food and Drugs Act, which was supported by the establishment of public analysts and associated enforcement officers. In 1874 the Society of Public Analysts was founded and Hassall served as its first president. His work within the Society would eventually help form the Sale of Food and Drugs Act of 1875, which introduced heavy penalties for the adulteration of food.
Around the same time, across the pond, Lewis Caleb Beck, an American physician and professor of botany and chemistry, was beginning chemical analyses of agricultural products. In 1848 Beck published his book Adulterations of Various Substances Used in Medicine and the Arts, and just like Accum, he provided the tests that could help expose these adulterations. Though Beck’s investigations weren’t directly of food, he is credited with helping to lay the groundwork for the Pure Food and Drug Act to be passed in 1906. It was Harvey Washington Wiley, Chief Chemist of the Department of Chemistry within the USDA (United States Department of Agriculture), who was a major driving force behind the establishment of the Act, which offered radically new protection mechanisms for US consumers. Wiley published a series on Foods and Food Adulterants and later a textbook entitled Foods and Their Adulterations. Most famously, Wiley established the Poison Squad (given its name by a journalist) in 1902. It was a group of volunteers Wiley co-opted to measure the deleterious effects of various food preservatives, such as borax (chemically known as sodium borate) and formaldehyde (also known as formalin – the solution used in preserving biological specimens and for embalming human bodies). All of these studies helped form the technical frameworks for the first US food laws. The Federal Meat Inspection Act was passed in the same year (1906) as the Pure Food and Drug Act, and it not only ensured the safe and sanitary processing of meat and meat products, but also helped to prevent adulteration and misbranding of meat. The Pure Food and Drug Act converted Wiley’s department to the Bureau of Chemistry and put it in charge of administering the Act. It was the Bureau of Chemistry that would later go on to become the US FDA in 1930.
Oh Dr Accum, how things have changed
Food fraud today is a global phenomenon – although the truth is that the actual scale of the problem is completely unknown. This is because no matter how sophisticated the tests become, it is impossible to screen every food item for its authenticity. The entire food industry is therefore faced with a major dilemma – a dilemma which becomes the fraudsters’ opportunity.
While the motivations for food fraudsters have changed very little since Accum’s time, the scale of the deception has moved into another league. Twenty-first-century food fraud detection now demands the analytical tools of twenty-first-century CSI-style forensic science. The tests of Accum’s time, using materials which were more akin to those now found in a high school student’s chemistry kit, are virtually useless. The fraudsters appear to be fully aware of the sophistication of the food forensic tests available and continually tweak their activities accordingly to beat the tests. For example, fertiliser or melamine (both high in nitrogen) are added to fake milk to deceive the simple tests for protein based on total nitrogen content. The economic gains of global food fraud are such that we are now all reliant upon an arms race in which the regulators are continually forced to refine their approaches in response to increasingly diverse fraudulent activities.
The way we purchase our food and the criteria we use to select it have also changed from Accum’s time. In terms of fraud, fresh fruit and vegetables offer a degree of reassurance since you can plainly see what they are – an apple looks like an apple and a carrot looks like a carrot. The criteria of smell, taste, appearance and freshness are fundamental when selecting such foods, but all too often in modern supermarkets this information is masked by packaging – broccoli sealed in plastic, and apples and carrots in bags. The modern consumer also uses a wide range of other criteria, such as country of origin, mode of production and, of increasing importance, nutritional value to make purchasing decisions. For this information we have to rely entirely on labelling and certifications. Apart from clearly recognisable wholefoods, such as vegetables, fruit, grains, pulses, whole spices and whole animals, how can we be confident that what we are eating is what we actually want to eat? We place our total trust in the supplier, whether they be an individual market stall holder or a global supermarket chain. The supplier in turn places their trust in the producers, and this raises the problem of supply chains discussed in the previous chapter.
Food processing, while revolutionising food storage, has also introduced complexity into the food chains and into the foods themselves, which opens doors for fraudsters. Most foods are processed in some way; canning tomatoes, mincing meat, extracting seed oils and making butter are all examples of processing. Even a basic apple is processed; it’s washed, graded, photographed to determine blush ratio, sorted and thrown behind a sensory deprivation force-field (plastic wrap or bag) ready for sale. We’d like to think that these simpler forms of processing are immune to fraudulent activities. Fresh tomatoes are clearly identifiable, but how confident can we be that canned tomatoes are purely tomatoes? How can you know you are not buying undeclared added water? Horsegate was proof that minced beef isn’t always the all-beef product we’re expecting. Butter looks and tastes like butter, but would you be able to detect a small proportion of added margarine or vegetable oil by taste or texture alone? And if it is supposed to be organic butter, can you be sure it was made from organic milk?
Remarkably, there are known incidences of US farmers losing their organic certifications because they unwittingly used a non-organic fertiliser that was being mis-sold as organic by leaving synthetic components (ammonium sulphate fertiliser) off the ingredients list. Interestingly, this was not picked up through analysis but by the enforcement authorities checking the fertiliser production plant. The supplier was jailed, so the laws definitely have teeth, but how can organic food be authenticated in the absence of such direct enforcement work? We will return to this in Chapter 9.
This is only the tip of the iceberg. There are even more opportunities for fraud among foods that are not as easily traced back to any plant or animal origins; that is to say those containing highly refined and even chemically produced ingredients, such as nature-identical substances, including chemically synthesised artificial colourants or flavourings. While we can read the ingredients lists on the sides of the packets, jars and bottles, few of us can fully understand what many of the ingredients actually are. Deciphering these lists requires a high-level knowledge of chemistry, biochemistry and food technology, not to mention the capacity to translate the numerous additive codes into some incomprehensible chemical name. E385, for example, is calcium disodium ethylenediaminetetraacetate (EDTA), which is a preservative; E900 dimethylpolysiloxane is an antifoaming agent, which we’ll meet again later. Even if you take the time to understand what all the ingredients actually are, how can you be sure that even these are what they say they are and they’re present in the right amounts? Extensive blending offers numerous opportunities for introducing cheaper ingredients to improve profit margins.
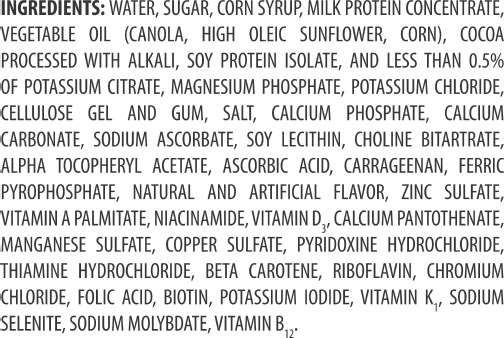
Figure 2.1. So this is food? Understanding the ingredients list on some food items requires an advanced chemistry degree in order to truly know what we’re eating.
Who’s doing the testing?
The complexity of many commercial processed foods presents a unique challenge for the twenty-first-century human. Like all animals, we use our primary senses to assess the nature and quality of the food we eat based on appearance, taste, smell and texture. There’s a reason our nose is strategically placed above where we put the food in! Food with added colourings, flavour enhancers, aromas and texture ingredients that improve the rheological or ‘mouthfeel’ properties of food make verifying its authenticity an impossible task for consumers.
One could quite reasonably expect that the authenticity of a given food item, processed or otherwise, must ultimately be the responsibility of the seller. But the array of foods on offer and the numerous ingredients used to prepare many processed foods makes their authentication by the seller a nearly impossible task. It is also relatively easy for sellers to lay blame elsewhere. Tesco, for example, was able to quickly lay the blame on its suppliers during the horse meat scandal as it had been assured the burgers being packaged under their Everyday Value label were all beef. But in the end, it was Tesco that suffered the loss of consumer trust. It is for this reason that many retailers are conducting their own authenticity testing. Since Horsegate, two UK retailers, the Co-operative and Sainsbury’s, have confirmed the use of tests, such as stable isotope analysis (which we explain later in this chapter), to verify the origins of the meat they buy as part of their own authenticity testing programmes. However, they can’t test the 30,000 or more products on their shelves, let alone the ingredients that go into them. Sellers are limited in what they can do.
Does the responsibility of authenticity testing then lie with the producers and suppliers? This is where the problem of complex supply chains comes to the fore. Even if a rogue ingredient can be detected, the complexity of food supply chains makes pinpointing its source a formidable challenge, especially given the huge numbers and volumes of products involved. In 2015, Reily Foods Company, a US food manufacturer, was conducting testing on its products in the wake of an adulterated cumin incident at the end of 2014. The company found that the cumin they were using in one of their chilli seasoning kits contained almond and peanut. It triggered a second, larger scandal that would pull products off the shelves in the US, Canada and UK. These were mainly spice kits, but also croutons, soups and chilli products, which all contained cumin that had been adulterated with ground almond and peanut shells (we go into more detail in Chapter 7). When Reily Foods notified their US supplier of their test results, the FDA had to go to work because that supplier had also sold the cumin on to 38 other food manufacturing companies – this became a high-allergen risk incident. The US supplier had purchased the cumin from a Turkish supplier, but it hadn’t been revealed at the time of writing this book whether the adulteration occurred in Turkey or whether the cumin was already adulterated when the supplier imported it. Though it may never be possible to pinpoint where the adulteration occurred, it was testing within the industry itself that helped pull potentially lethal products off the shelf in a reasonable timeframe.
Watchdog organisations, such as Which?, are doing testing, as are NGOs, but they will target specific food products related to their latest campaigns. Research is also being conducted by higher education institutions all over the world, as we will describe throughout the book. And while this research is critical in advancing testing methods, until recently there has not been a concerted effort in academia to tackle the confronting issues in detecting food fraud (though this may be changing). Government inspection agencies are also doing testing. After Horsegate, the FSA increased its food sampling programme budget from £1.6 million (US$2.5 million) to £2.2 million (US$3.5 million). But as we said in the previous chapter, these agencies are also responsible for foodborne pathogens and more acute food safety concerns, and resources are limited.
Despite the industry, retailers, NGOs, academics and government inspection agencies all doing testing, food fraud still happens. The stark reality is that the scale of food production is so massive that comprehensive routine screening is an impossible task. The best that can currently be achieved is random testing of what amounts to only a tiny fraction of all the food we consume. And this testing is conducted by a whole lot of different groups that don’t necessarily share their results with each other. It is therefore inevitable that we will be regularly consuming foods that are not what they claim to be. This will especially be the case if our supermarket trolley includes a preponderance of high-value premium commodities or highly processed food. The fraudsters have, however, also realised that huge profits can be made from adding lower-cost ingredients to much more widely consumed staples. Misrepresenting popular specialist or beneficial commodities, such as organic foods or those of specific geographical origins, is another dimension of food fraud. Detecting such activities is a monumental task requiring the application of analytical approaches and techniques every bit as sophisticated as those forensic science methods used by crime scene investigators. But instead of a victim in a crime scene, food inspectors have a bottle of oil – and there may be absolutely nothing wrong with it. So where do you start?
Framing the food fraud question
Globalisation and commoditisation of our food has got us into a situation where we can’t always trust what we eat. We have set our table, now we must sit and eat at it ... like it or not. And so we must regularly invite analytical science to dine with us as it is, without a doubt, one of our greatest allies in detecting food fraud. It is by applying the correct methods and approaches that we are able to confirm that the food sold to us is what it says it is. If we assume that the fraudsters are working in most areas of the food industry, then we need tests that will allow all commercial variants, even of the same commodity, to be scientifically distinguishable. Thus, the crucial first step is defining the problem. This involves recognising all the common types of a given foodstuff and understanding what the natural variation may be. Oil and wine are examples of this that we discuss later. There needs to be complete understanding of how the food is made in order to develop an awareness of the most likely ways it might be manipulated or misrepresented to the advantage of the fraudster. And from this list of potential manipulations, analytical scientists must choose which specific question to answer as there is no one test to answer them all. Tom Mueller’s book Extra Virginity provides a case study for olive oil, which we will return to later.
This is the overarching framework within which food fraud detectives operate. Examples of the more specific questions they seek to answer are: is the honey pure? is the salmon farmed or wild-caught? is the minced meat pure beef? is the olive oil Italian in origin? is the butter organic? and so on. The more specifically we can frame the question, the more chance there will be of developing a test to answer it. These are extremely complex questions, but are typical of the challenges facing the detection of food fraud around the world on a daily basis.
An analytical test is more precisely referred to as a determination in the analytical profession. When it’s applied, the result obtained, ideally a number, is compared with the accepted known outcome (numerical standard) for that food. We use such logic throughout our lives – we know what fresh milk smells like because we’ve smelt it thousands of times before. When we smell off milk we recognise it immediately. If the milk is only just turning sour and we are uncertain, we may decide, cautiously, to taste it to provide additional confirmation. This is exactly the process applied in detecting food fraud. One test may be enough, but sometimes a combination of tests are required to assess some characteristic, or combinations of characteristics, that can be compared to the known characteristics for that food. The known characteristics are obtained by testing many (usually thousands) of authentic examples of that foodstuff. This collection of authentic examples is known as a reference collection. The test results from the reference collection provide a database of the defining characteristics or standards (often within a range to account for natural variability) that are repeatable and reliable.
Let’s consider tomatoes. At the mention of the name we picture them immediately as a red fruit with smooth skin, but the colour varies from green through orange to red depending on ripeness. Size also varies from cherry to beefsteak, and shape from spherical to plum. Once you know all this you can use your judgement (your own database) to decide whether the fruit on offer is a tomato. As to whether it’s a vine-ripened tomato is totally bizarre; there seems to be a premium associated with having a piece of the vine still attached, even if that vine was no longer attached to the plant while the tomatoes ripened. It reminds us it came from a plant and smells quite nice, but we immediately throw the vine into the recycling bin. However, vine or otherwise, few of us will be aware of any criteria on which to judge whether a tomato is organic or locally grown. This information requires knowledge of characteristics that lie outside our regular frame of reference, and, more seriously, is beyond any capabilities we have to make such judgements. At this point we have to rely upon labelling and this is where opportunities open up for the fraudster. Questions concerning how food was produced and where it was produced are among the most challenging facing food testing laboratories.
The guiding principles of food fraud detection
The detection of rogue foodstuffs, or rogue ingredients within foodstuffs, relies upon the identification of a distinguishing physical or chemical/biochemical characteristic – a ‘fingerprint’ or ‘signature’ – that sets the adulterated foodstuff or ingredient apart from the accepted characteristic(s) of a given foodstuff or ingredient. Fingerprinting is a relatively simple idea used in the environmental, biomedical and forensic science field. It recognises that variation in chemical composition between different sources of a material can be used diagnostically to distinguish them. In the biomedical area, perturbations in metabolic biochemical ‘fingerprints’ of breath and urine are increasingly being promoted to spot different diseases, especially in early diagnosis. In the forensic field the different chemical compositions of illicit drugs, explosives and firearm residues can be used to link evidence from a criminal to a crime scene or crime object. Exactly the same idea is used in detecting food fraud, but there are some specific considerations in analysing food:
•The chemical complexity of foods. These are biological materials, animal and plant products, which are made up of highly complex mixtures of thousands of biochemically complex compounds, such as carbohydrates, proteins, lipids and nucleotides, in addition to water, minerals and trace elements. This complexity offers opportunities to both the fraudsters and the analysts. Adulterants can be hidden in complex mixtures; however, complex mixtures can also provide highly characteristic fingerprints.
•The inherent variability in the compositions of biological materials. Mother Nature’s imperfections unwittingly aid the fraudsters. The compositions of even the same foodstuff are inherently variable. This natural variation is all too familiar to biologists, especially ecologists, biogeochemists and geochemists who study the natural world. The variability is generally not large, sometimes only a few percentage points across the global range, but that’s enough to open the door to exploitation by the most skilled fraudsters. This variability, combined with the biochemical complexity of foods, offers the fraudsters numerous opportunities to hide their rogue ingredients.
•Food processing, including refining, mixing and cooking, can cause deviations in the food ‘fingerprint’ from that of the raw ingredient(s). Refining sugar, for example, involves separating components of the original product: raw cane sugar is separated into molasses, pure crystals and impurities. Refining and processing can thus remove the fingerprint capacity of the very compounds that many tests target, such as proteins and DNA. The complexity of detecting fraud generally increases with the increasing number of ingredients and the complexity of processing methods used to prepare the food in question. The fraudsters love processed foods as they are the perfect medium for hiding rogue ingredients. For the analyst, this means that a thorough understanding of how the food is processed is necessary in order to frame the right questions for detection.
Chemical fingerprinting can operate at two main levels, bulk and individual compounds, and both have their virtues. Bulk analyses tend to be quicker and cheaper, but analyses at the individual compound, or molecular species, level can give highly specific fingerprint information that increases the chances of detecting differences in different source materials. For example, bulk analysis can determine the percentage of nitrogen in a product, which might be a useful first step in assessing protein content (to test whether milk has been watered down, for example). But tests for individual compounds would be needed to determine whether all the nitrogen present is in the form of protein or to confirm the type of protein present.
One way of thinking about fingerprints is to consider the password you use to access your computer: the greater the number and range of symbols you include, the more secure your password becomes. The same principle applies to chemical fingerprints: the more chemical information you use, the more characteristic the chemical fingerprint becomes. Many food fraud questions concern the protein(s) in food. Proteins are made up of 20 common amino acids, so detecting these and determining their concentrations would confirm protein was present and how much there was, but crucially not the type of animal or plant protein present. The power of chemical fingerprinting in relation to proteins lies in the sequence, or order, in which the amino acids are arranged in protein chains, which we will discuss later.
The honey case study
To look at how the detection of food fraud works in practice, let’s work through an example with honey. It’s a beautifully sweet, rather distinctive-tasting natural golden syrup, produced by the ever industrious honey bee, Apis mellifera. Honey bees collect the nectar of plants and convert it into honey as a source of energy for the colony. But careful tending by beekeepers ensures the bees produce a surplus for our delectation. Annual global honey production amounts to an astonishing 1.2 million tonnes. That’s a lot of jars of honey, but seemingly insufficient to satisfy our needs. It’s a sobering thought that one worker bee typically makes only 0.5g (0.018oz) of honey in her lifetime.
Premium or specialist honeys are expensive as they claim a range of beneficial nutritional and curative properties, which increase their popularity. However, specialist or not, any honey we buy should be pure honey. Demand and premium prices motivates fraudsters to stretch this precious hive product by adding cheaper ingredients, such as corn syrup, fructose, glucose, beet sugar and cane sugar. Indeed, honey is recognised by the European Parliament as among the top 10 foods most likely to be adulterated.
Surely testing the purity of honey will be simple enough? As you will see, nothing could be further from the truth. There are a number of descriptors that must be included on honey labels in order to accurately describe the product and all of these claims have to be true for the product to be authentic. The Codex Alimentarius Commission, established in 1963 by the Food and Agriculture Organization of the United Nations (FAO) and the World Health Organization (WHO), sets international food standards, guidelines and codes of practice. Its 12-page standard for honey describes nine different categories relating to differences in source or means of processing honey: blossom or nectar honey, honeydew honey, comb honey, chunk or cut-comb honey, drained honey, pressed honey, extracted honey, filtered honey and baker’s honey. The country of origin and predominant plant the bees used must also be stated, as well as whether the honey was blended. What unifies all these commodities is that they are honey and any honey must be 100 per cent pure honey.
Compared to many of the foods we eat, honey is a relatively simple substance biochemically. It is a supersaturated sugar solution. Supersaturation means more sugar is dissolved in the water honey contains than is theoretically possible; that’s why honey crystallises so readily in the jar. This crystallisation is quite normal as honey ages and is not an indication of adulteration. The processing of the nectar by worker bees involves repeated regurgitation and enzymatic conversion to honey. The familiar viscosity of runny honey develops through the regurgitation process with the worker bees evaporating just enough water using their wings to make the consistency of the honey deposited in the cells of the honeycombs just right.
The resulting honey is composed of two main sugars, fructose and glucose, with a smaller proportion of sucrose and maltose. Together these sugars account for around 80 per cent of the total mass of a jar of honey. The remainder is largely water, though this is never greater than 20 per cent, otherwise the honey will ferment. There are also tiny amounts of vitamins and other organic compounds, including traces of proteins and minerals. The chemical composition of honey varies depending on the nectar collected by the bees, and it will change throughout the season and will vary by region depending on what flowers are in bloom. Often the aromatic compounds in the nectar are carried over to the honey; it’s quite easy to tell when honey has been made by bees foraging in lavender, for example, because the honey has hints of a lavender aroma. Beekeepers have a good sense of where their bees are foraging given what’s in bloom within a certain range of each hive, but it’s not an exact science as bees are free-flying insects. As we will see, many of these properties can be used as criteria in honey authentication.
Years of research have sought to establish the chemical composition of honey in order to protect the producers. Compilation of the known compositions of thousands of samples of honey has allowed the global ranges for the physical characteristics and chemical components of honey to be defined. The Codex Alimentarius standard lists detailed information on the following criteria for specified honeys: sugar content (including limits for fructose, glucose and sucrose), moisture content, water-insoluble matter content, electrical conductivity, diastase enzyme activity and hydroxymethylfurfural (an organic compound) content. Without going into the details of all of these, most of them contribute to the chemical fingerprint information of honey – they are the complex secure password that confirms the purity of the product.
Fingerprinting: how pure is our honey?
So our first forensic question is whether our jar of honey is pure. The major criterion used to authenticate the purity of honey is the sugar composition – the honey sugar fingerprint. Sugars not only make up the bulk of the honey, but the relative proportions of individual sugars are fairly consistent worldwide. The technique central to measuring mixtures of compounds, such as sugars, is chromatography. You may have had an opportunity at school to separate the different colours in ink on a filter paper. If not, here’s a quick refresher. Filter paper that the students have marked with a black marker is placed upright in a glass containing just enough water to wet the bottom edge of the paper. As the water travels up the filter paper, the pigments left by the black marker are carried along for the ride. The different coloured pigments will travel at different rates and will therefore separate out, turning a black mark into a rainbow of colour. That’s paper chromatography. And like all chromatography, it’s based on the principle that the mixture to be analysed is carried in a mobile phase (either a liquid or a gas) through a stationary phase (usually solid). The different constituents in the mixture travel at different speeds and will be retained in different spots on the stationary phase. Where the components separate out on the stationary phase can then be compared with known substances to help resolve their identities. Honey sugars can be determined by gas chromatography (GC) but it is more easily done using high-performance liquid chromatography (HPLC). This technique forces mixtures of compounds dissolved in the liquid mobile phase through the stationary phase at high pressure, which makes it faster and gives it superior resolving power for a wider range of compound classes, making it one of the most widely used separation techniques in analytical chemistry.
As shown in Figure 2.2, HPLC separates the sugars in honey into fructose, glucose and sucrose, but also quantifies the relative proportions of each – this defines the honey sugar fingerprint. Pure honey will consistently contain these sugars within the following ranges:
•Fructose: 31.2 to 42.4 per cent;
•Glucose: 23.0 to 32.0 per cent;
•Sucrose: 0 to 2.8 per cent.
Honeys with sugar compositions outside these ranges are therefore highly likely to have been adulterated. Honey’s low abundance of sucrose (the familiar cane or beet sugar is sucrose) makes this a poor choice of adulterant as adding even a small proportion would be easily detected – yet it still happens. However, the ranges for fructose and glucose are substantial, around 10 per cent, and their overall abundances are both high. Therefore, despite HPLC providing a valuable chemical fingerprint, there is plenty of scope for adding cheaper sugars or mixtures of sugars, which might never be picked up by this approach.
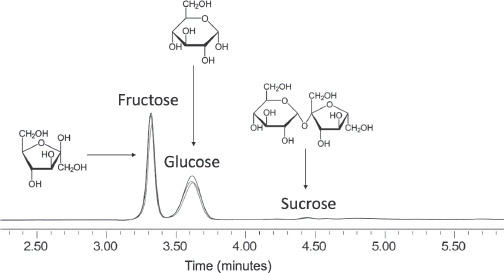
Figure 2.2. Chromatograms (overlain) of shop-bought honeys show how consistent the composition is of the three main sugars (structures shown). The areas under the peaks are proportional to the amount of the sugar present.1
A very troublesome adulterant in honey is high fructose corn syrup (HFCS). This is produced in the US as a replacement for sugar by treating corn (maize) starch with enzymes that convert some of the glucose to fructose. A range of HFCSs are produced, with one, HFCS 55, having a remarkably similar fructose and glucose content to honey. So even if the results of the HPLC are consistent with a pure honey, this does not necessarily mean the forensic analysis is over, particularly if there is evidence, such as questionable paperwork, which caused suspicion of the honey to begin with.
Stable isotopes to the rescue!
So where do we go from here with authenticating our honey? The sugar fingerprint is consistent with a pure honey, but there’s cause for suspicion nonetheless. The next question may be to determine whether HFCS, or indeed any corn syrup, has been used. This time nature is on our side as we look to answer this question. There are two major groups of plants in the world called C3 and C4 plants. The C3 and C4 terms refer to the different ways in which the plants capture carbon dioxide (CO2) from the atmosphere during photosynthesis in order to make their sugars. The C4 pathway was an adaptation among some plant groups to high light intensity, high temperatures and dry conditions as the pathway is more water-efficient. CO2 exists in two forms that are important here: 12CO2 and 13CO2. They are very similar, differing only in the fact that the carbon atom (C) in 13CO2 contains an extra neutron (12C and 13C are the stable isotopes of carbon). The extra neutron in 13C does not make a big difference and 12CO2 and 13CO2 follow each other around, behaving in the same way. However, the extra neutron makes 13CO2 physically heavier than 12CO2. Most of the time this is of no consequence; however, the enzymes involved in capturing CO2 in photosynthesis in all plants are sensitive to this small difference in mass and use 12CO2 over 13CO2. The result is that the sugars made by plants through photosynthesis have proportionally less 13C than the atmosphere. Furthermore (and this is absolutely critical), C3 plants contain less 13C compared to C4 plants due to a difference in the way they capture CO2. And this can be used to beat the food cheats.
Fortunately, the vast bulk of the honey produced in the world is produced in regions where C3 plants predominate within the ecosystems. Thus, based on the ‘you are what you eat’ (or in this case, what bees chew and spit out) principle, the honey the bees produce will have a C3 plant fingerprint. In contrast, the corn (maize) plant is a C4 plant, so any added HFCS will have a C4 plant signature. So if you start mixing HFCS into honey, the ratio of 13C/12C increases as more corn syrup is added. This can be readily determined using an isotope ratio mass spectrometer (IRMS), which is a very sensitive weighing machine capable of determining the precise ratio of 13C/12C in biological materials, including foodstuffs. There is, however, one catch: beekeepers often feed their bees on pure sugar, especially during colder periods when they don’t fly. Sugar cane is also a C4 plant, so any legitimate honey produced when it’s being fed to the bees will have a 13C/12C ratio similar to HFCS. This would suggest adulteration, when the beekeeper is simply using a perfectly acceptable practice to maintain his or her hives. Here’s a perfect example of why food analysts need to have a thorough understanding of how the food is made.
Realising this problem, a modification of the stable isotope test was proposed. The fraudulent addition of HFCS can be detected by comparing the 13C/12C ratio of both the honey sugars and the honey protein. The 13C/12C ratio of the sugars and the proteins in a genuine honey are very similar, and the small difference is relatively constant across all honeys. When bees are fed the C4 cane sugar, this is incorporated into both the sugars and the proteins of the honey as the bees process it. However, if HFCS is added to the honey after bee processing, the carbon isotope composition of the sugars changes but that of the protein doesn’t. Sufficient differences in the isotope values unambiguously confirm adulteration and can be quantified down to a 7 per cent level of added HFCS.
By judicious use of two types of analysis we could be fairly confident that the honey we are about to spread on our toast is indeed pure honey, but what about other claims on the label?
Perhaps our hypothetical jar is labelled as mānuka honey, which is extremely expensive. One UK supermarket currently sells raw mānuka honey for £39.95 (US$63) for a 340g (12oz) jar. Mānuka honey is produced by bees foraging specifically on the mānuka or tea tree (Leptospermum scoparium), which grows uncultivated throughout New Zealand and southeastern Australia. Research suggests that it has a number of curative properties, particularly outstanding antibacterial activity. As a result of the premium price, the adulteration of mānuka honey has reached astonishing proportions. It is reported that the majority of mānuka-labelled honey on supermarket and health food shop shelves worldwide is adulterated.
The New Zealand Unique Mānuka Factor Honey Association (UMFHA) estimates that just over 1,500 tonnes of pure mānuka honey are made annually in New Zealand. It is truly remarkable, therefore, that an estimated 9,070 tonnes of honey labelled as mānuka is being sold around the world annually; more than five times the amount of mānuka honey produced is sold. The UK alone consumes around 1,800 tonnes each year. Something’s dreadfully wrong somewhere!
Analyses performed by the UK FSA between 2011 and 2013 showed the majority of mānuka honeys sampled lacked the desirable non-peroxide antimicrobial activity deemed to be exclusive to true mānuka honey. While it is recognised that the antimicrobial activity can diminish between production and sale, the disparities between the true production and sales tonnages is truly mind-boggling. In response to this, in 2014 New Zealand news reported that the Ministry for Primary Industries had begun working on a new guideline for mānuka honey. To support this guideline, the UMFHA was reported to be collecting honey samples from around the country to establish a chemical profile of mānuka for use as a fingerprint and reference point in honey testing.
So how can the tests outlined above be taken a step further to confirm unambiguously that our honey is truly mānuka as it claims on the jar? This is an exceptionally challenging problem that the food forensic scientists continue to explore. The traditional approach is to test the pollen content to confirm the forage species. The standard for mānuka honey is only 70 per cent Leptospermum pollen, but pollen analysis is complicated by the fact that kānuka (Kunzea ericoides) is a tree from the same family found in the same habitats, which has identical pollen to mānuka. Likewise, the Australian native jelly bush (Leptospermum polygalifolium) is classified to the same genus as the mānuka. The bottom line is that a new test is needed to separate these different honeys if the unique classification of mānuka honey is to be upheld.
Omics and the food testing revolution
To get to the floral origins of mānuka, as well as other aspects of honey authentication, we turn to omics-type approaches. ‘Omics’ is a scientific neologism (expression) given to the fields of study in biology ending in -omics, namely genomics, proteomics and metabolomics. Given that the vast majority of food derives from living things (we hope), the use of omics approaches is heralding a new dawn in twenty-first-century food fraud detection in many areas. Overall, omics research aims at the collective characterisation and quantification of biological molecules that translate into the structure, functions and dynamics of living organisms. The goals of food fraud detection might not appear to fit comfortably within this definition. However, the most basic question addressed in the authentication of a food is species origin, and it is here that the principles of omics and the demands of food fraud detection converge.
First, a few words on the basic principles of omics. All organisms on Earth are the product of their DNA sequences. The building block chemicals for DNA are called nucleotides and the sequence in which they appear is called the genetic code. Genomics is the study of the structure, function and evolution of these sequences. Sections of the genetic code, known as genes, are the blueprint for building proteins. Proteins are made up of chains of amino acids. Proteins differ from one another primarily in their sequence of amino acids, their sizes and shapes. While we commonly associate proteins with the structural and mechanical material that makes up muscle, they are also responsible for catalysing metabolic reactions (enzymes), replicating DNA and transporting molecules from one location to another (for example, blood haemoglobin is the protein that carries oxygen). Proteins are also sensitive detectors in responding to stimuli from inside and outside the body (for example, a hormone receptor on the cell surface is a protein). The study of the structure and function of proteins is proteomics. The final omics technique in the toolkit for food fraud detection is metabolomics. While genomics and proteomics approaches are based on the DNA and proteins, metabolomics essentially looks at all the other processes happening in the cell. An example might be in toxicity screening. Urine, which contains the waste products from cellular metabolism, can be analysed to see what physiological changes a toxin has caused in the body. This is a different approach from looking at organs individually to see how the toxin has affected them. We’ll return to metabolomics and genomics shortly, but to verify our mānuka honey we’re first going to see if we can use proteomics.
The potential of proteomics
We have mentioned that the stable carbon isotopic composition of the protein in honey can be used to detect HFCS added to honey, but there is much more to proteins than their stable isotope compositions. Indeed, an emerging technique in the food fraud detection toolkit is proteomics. The amino acid sequences of proteins can be species-specific and thus can be used to define the species origins of unknown proteins. So why use proteins and not DNA to assign the origin of a foodstuff? First, the equipment necessary to analyse proteins is more common, whereas DNA sequencers are not necessarily standard equipment for many analytical labs (though this is changing as these methods become cheaper). Second, proteomics can have some major advantages when verifying the origins of highly refined or processed animal or plant products.
The proteomics approach has been around for more than 20 years in biochemistry. The method involves treating an unknown protein or mixture of proteins with an enzyme called trypsin, which cuts the proteins to produce a mixture of smaller fragments called peptides. Trypsin recognises particular amino acid sequences and clips the protein in this region every time, so it is predictable and reproducible. The resulting mixtures of protein fragments are separated by HPLC and analysed by mass spectrometry (MS), to determine the amino acid sequences of the peptides. The MS effectively weighs the individual peptides, splits them further and measures how much of each peptide fragment there is and the order of the amino acids they’re made up of. Plotting the weights (molecular masses) and how much (abundances) of each peptide gives highly diagnostic fingerprints. These can then be compared with databases of peptide sequences from known proteins from candidate food species; assignments of species of origin can be made with a very high degree of confidence. We will see later how this approach can be especially effective in detecting meat fraud, but can it be used to fingerprint species-specific proteins in our honey?
Pier Giorgio Righetti and his team from the Politecnico di Milano, Italy tried to isolate the proteins in honey from chestnut, acacia, sunflower, eucalyptus and orange.2 Sadly the protein content of the honeys they tested were many times lower than had been previously reported. Even more disappointing, their proteomics analyses showed that all but one of the proteins they could identify in the honey were derived from the bees themselves – these were enzymes in the bees’ saliva. Their attempts at identifying plant (pollen, nectar) proteins were unsuccessful, so at this stage honey proteomics seems to be a non-starter for floral source identification. We’ll have to turn to other approaches to verify the origins of our mānuka honey.
Mesmerising metabolomics
As plants and animals go about their daily functions associated with living – breathing, eating, excreting, to name a few – they produce different mixtures of compounds. Differences arise in these compounds depending on the organism and where in the world it’s living. We should, in theory, then be able to use sophisticated analytical techniques to produce a high-resolution chemical fingerprint of these compounds to determine whether our honey was produced from mānuka trees in their endemic regions of New Zealand and Australia.
One of the techniques used in metabolomics is nuclear magnetic resonance spectroscopy (NMR), which many will be familiar with in relation to medical diagnosis. The method actually has its origins in analytical chemistry laboratories where it is mainly used to investigate the structures of organic molecules. It works through the interactions of radio frequency radiation with the atoms of molecules in a magnetic field. In 2012, Italian-based researchers showed how 600MHz 1H NMR (600MHz refers to the resonance frequency used and 1H refers to the nuclei being studied) could be used to discriminate honeys of different botanical origins.3 Over a two-year period they collected NMR spectra of 353 extracts of monofloral Italian honey (such as acacia, linden, orange, eucalyptus, chestnut and honeydew), as well as polyfloral honeys. They identified specific markers for each monofloral honey, then used NMR-based metabolomic fingerprinting combined with multivariate statistics to discriminate between the different types of honey. The method required very little sample preparation; it was fast, reproducible and is claimed to be more objective than melissopalynological (pollen) analysis. A year later, a different group of researchers identified 13 metabolites in honey that had at least one unambiguous resonance using 1H NMR that could be used to quantify the compounds, including carbohydrates, aldehydes, aliphatic and aromatic organic acids.4 They used the technique to quantify these compounds for mānuka honey, but didn’t attempt to use it to discriminate mānuka from other types of honey.
Another metabolomics approach is to target the volatile compounds (organic chemicals with a high vapour pressure at room temperature) present in the aroma of honey as a means of verifying their geographical origin. The volatiles are collected from the air above the honey using a technique called solid phase micro-extraction (SPME). SPME uses a polymer-coated fibre that absorbs the honey’s volatile components. The volatiles can then be separated using different chromatography techniques and analysed using different methods of mass spectrometry. These data from the volatile components of the different honeys are used to construct a model that can classify the geographical and floral origins of those different honeys. The model can then be used to take unknown honeys and predict their origins.
In 2014, a research group from Dresden, Germany applied SPME to analyse the volatile compounds in mānuka honey as well as the pollen-identical kānuka honey and closely related jelly bush honey.5 They combined their findings for the volatile compounds with an analysis of the non-volatile compounds using HPLC and mass spectrometry. They investigated the complex chemical signatures for the eight samples of mānuka honey, seven samples of kānuka honey and one sample of jelly bush honey using chemometrics approaches; i.e. by using advanced statistical methods they were able to pinpoint characteristic substances for each honey, which allowed classification of each honey into one of three clusters. Though the model enabled them to correctly classify each of the honeys they tested, models are only as good as the data input. The researchers admit that although their approach has potential to be used for routine honey authentication, their sample size was small. A larger database of honeys collected from different production years and from different regions in New Zealand is required before these methods can be used to authenticate our mānuka honey, but metabolomics seems to hold great potential in honey authentication.
DNA: the ultimate fingerprinting approach?
Perhaps genomics can resolve our mānuka mystery. The unique genetic code for each species can be exploited in food fraud detection as a genetic fingerprint rather than a chemical fingerprint. The major difference between a simple sugar composition and a DNA sequence lies in the amount of data available in the latter. If we go back to the password analogy, DNA gives the ultimate secure password due to its specificity.
Labs all over the world sequence areas of DNA of interest and entire genomes for different species all the time. And while this is helpful in answering specific questions, the lack of standardisation isn’t particularly useful in terms of building a repository of data for species around the world; in other words, a database that could be used to identify all species, including those we eat. In 2003, Paul Hebert’s research group at the University of Guelph, Canada, proposed DNA barcoding as a method of quickly identifying all living things on Earth. Barcoding would target a standardised region of the DNA. Just as barcodes, such as the Universal Product Code (UPC) or International Article Number (EAN), are used to identify retail products, a short sequence of DNA can be used to identify species – except, instead of a series of numbers it’s a series of nucleic acids. This need to identify species is as fundamental to biological studies as the Periodic Table of Elements is to chemistry. However, unlike elements, species are going extinct faster than they can be identified ... and there are millions of them! Hebert and others proposed barcoding as a fast and simple method that could meet this urgent need to differentiate living organisms.
A UPC symbol, in its most common format, has 12 digits with 10 possible values at each digit (zero to nine). This provides one trillion (1012) possible combinations. DNA has four possible values: the nucleotides adenine (A), guanine (G), thymine (T) and cytosine (C). A gene 500 nucleotides long could theoretically provide 4500 unique codes – more than enough to assign all living species a unique code.
But which segment of DNA makes the best barcode? The segment needs to be as universal as possible among different taxonomic groups and reasonably short for efficiency reasons. It needs to be easily recognised, so it has to have a region of DNA on either side of it in the sequence that doesn’t vary much between species. This conserved region acts like a bookmark when the sample is processed. The segment itself, however, needs to be variable enough that it can be used to differentiate species, but not so variable that it differs within a species. Much like Goldilocks’s porridge, the mutation rate can’t be too fast or too slow ... it has to be just right. In plants, which is what’s relevant to our honey example, the segments of DNA that are targeted for barcoding are two gene regions in the chloroplast, known as matK and rbcL.
The simple version of the process is that DNA is extracted from the sample and then put through a process to amplify the target gene segment – known as Polymerase Chain Reaction (PCR). The sample is then run through a DNA sequencer and what’s returned is a string of As, Gs, Cs and Ts – the barcode. These data can then be uploaded to the Barcode of Life Database (BOLD) to be compared with existing barcodes that have been collected from expert-verified specimens. The unknown specimen will either match an existing sequence or come back as being divergent enough from anything else in the database that it is considered new to the database. The methodology is streamlined and relatively inexpensive and a single DNA barcoding facility can process hundreds of thousands of samples each year at a cost of about £6.31 (US$10) per sample, not including labour and supplies.
The reference database is a critical component to the Barcode of Life project. As well as providing sequence information (the barcode) and species name, there is additional information available regarding the quality and source of the sample and the reliability of the identification. A specimen from a botanic garden that has been identified by the curator, for example, is likely to be more reliable than ancient DNA harvested from a partial grain extracted from a sediment core pulled out of the bottom of a lake. This secondary information helps those using the data to establish a level of confidence in the results. While this is important in communicating scientific findings, it also helps to establish the quality of the evidence if used to help prosecute in a case of food fraud.
So can we use DNA barcoding to authenticate the plant origins of our honey? Back in 2010 Tom Gilbert and colleagues at the Natural History Museum, University of Copenhagen, Denmark, showed that even small samples of honey, one millilitre, contain enough DNA for effective PCR analysis.6 They tested a number of honey samples and recovered sufficient lengths of DNA to allow them to identify taxonomic groupings of insects and plants. Interestingly, DNA from insect mitochondria (the organelles responsible for energy production in the cell) dominated over plant organelle DNA (DNA from parts other than the nucleus, such as the chloroplast). Plant nuclear DNA was present at the lowest levels. As the target areas for barcoding are in the chloroplast DNA, this confirmed that DNA could be used for characterising the floral source of honey.
At the time of writing this chapter, Massimo Labra and his group at the Università degli Studi di Milano-Bicocca, Italy, have recently put barcoding honey to the test.7 They analysed four multifloral honeys produced at different sites in the northern Italian Alps, using the rbcL region as well as one other region as barcode markers. They assembled a DNA barcoding database for the region where the bees were foraging – a total of 315 species. From the DNA they extracted from their honey samples, they were able to identify 39 plant species in the four honeys, including Castanea (chestnut), Quercus (oak) and Fagus (beech) trees, as well as many herbaceous taxa. An unexpected finding was the DNA from a toxic plant, Atropa belladonna. Though it’s unlikely that the honey contained any toxic metabolites of the plant, it shows the potential usefulness of DNA barcoding for evaluating honey ecotoxicity and other food safety-related issues.
As we’ve already stated, the strength of barcoding lies in the database. There are currently seven barcoded specimens of the mānuka tree (L. scoparium) in BOLD, which have been mined from the GenBank database. There is very little secondary information associated with the information in the database. There is one sample that was collected by the Royal Botanic Gardens, Kew (UK), so this is a likely candidate as an expert-identified specimen. In theory, we could therefore send a sample of our honey off to a lab for analysis to see whether it contained only plant DNA from the mānuka tree.
Where does my honey come from?
If we can use barcoding to verify that our honey is from the mānuka tree, then it’s rather obvious where the honey has originated as the tree is only found in a restricted area of the world. However, what if we want to verify the geographic origins of a honey that’s either polyfloral or made predominantly from a flower that’s more widespread geographically? Knowing the origin of honey is important in understanding the risk of adulteration as well as contamination. Some countries have a history of adulterating honey. And less stringent pesticide and antibiotic regulations in some countries make their honey more prone to contamination with the residues from these chemicals. Being devious about the geographical origin of honey can present a health risk.
The movement of food around the world, often thousands of miles away from its site of production, means we are moving food to regions characterised by different ecosystems, climates and soil types. Remember the ‘you are what you eat’ principle? Plants and animals growing in different regions naturally record in their tissues the chemical and stable isotope signatures of their environment. As plants grow, they take up nutrients from the soil and atmosphere. Where they grow will be manifested in differences in the macro- and micro-nutrients they absorb due to different soil types (reflecting underlying geologies), fertilisers, rain and soil water compositions. The chemical and isotopic compositions of all plants will be directly affected by these differences in composition. The chemical and isotopic signatures recorded in the plants are then passed on to the consumers, notably grazing animals (including bees), when they eat the plants and assimilate plant nutrients into their tissues. Thus, all the food we eat, plants or animals, possesses a chemical and isotopic signature of where it was produced. For the most part, we can’t detect these chemical and isotopic signatures based on the taste or texture of the foods and beverages we consume – though a honed palate is arguably able to assign wines to certain growing regions. Decades of ecological and biogeochemical research have provided us with a detailed understanding of the major factors that affect the chemical and isotopic compositions of plants and animals.
Recognising these geographic signatures, the EU funded a major initiative known as the food traceability project (TRACE). It brought together researchers from Germany, Italy, the UK and Austria, to investigate if it was possible to discriminate between honeys produced in different parts of Europe with different climates and geological conditions. More than 500 authentic honeys were collected from 20 different regions. The honey protein was isolated and the stable isotopic compositions were determined for carbon (13C/12C), hydrogen (2H/1H), nitrogen (15N/14N) and sulfur (34S/32S). These are the major elements that make up protein. The lighter isotopes (the ones in the pair with the smaller superscripted number) are more abundant naturally. And just as 13C is the heavier version of 12C with its extra neutron (recall the differential uptake of 13CO2 and 12CO2 by C3 and C4 plants), 2H, 15N and 34S are heavier versions of these elements. These stable isotopes can record different invisible processes going on in the environment, just as they did in the different photosynthetic pathways of plants. In fact, this gives isotope biogeochemists a different view of the world. For them, rain doesn’t just bring vitality to the garden or thwart picnic plans. For the isotope biogeochemist, rain is painting the environment with different isotope compositions – an isotope landscape if you will. Water molecules that contain the lighter hydrogen isotope (1H2O) evaporate more readily from the surface of the sea than the heavier water molecules (1H2HO). As vapour in the air condenses into clouds and moves from the sea over land, 1H2HO will precipitate out first and the lighter water molecules will be carried further inland. As a result, the hydrogen isotope composition of the clouds changes in a predictable way and there is geographical fractionation of the isotopes across the landscape. Rain falling increasingly far away from the coast contains increasing proportions of 1H2O relative to 1H2HO. Plants (and animals) drink this water and the hydrogen isotope ratio for their region is incorporated into their tissues.
Together, isotope biogeochemists and food fraud detectives can exploit the stable isotope fingerprints recorded in plants to devise new ways of assigning the geographical origins of different foods. In fact the predictability of stable isotope fractionation across the landscape – known as an isoscape – has resulted in the generation of maps showing how the stable isotope compositions of elements vary across different regions of the world due to variations in rainfall, temperature, geology, land use, plant types and other underlying processes. These maps can help to verify claims of the region of origin displayed on food labels. Of course, a fraudster could in theory fake a food product that would make it isotopically identical to the real thing, but achieving this would be so costly that the economic gains would make it nigh on pointless.
Results from the EU-funded TRACE project showed that the stable isotope compositions – carbon, nitrogen, hydrogen and sulphur – in honey protein could be used to verify the origin of honey.8 Carbon and sulphur isotopes were particularly useful in confirming the origins of the European honeys tested. Other research has indicated that the utility of isotopic analysis varied depending on the honey component under investigation. The hydrogen and oxygen isotopes measured in pollen, for example, don’t seem to reflect regional precipitation isotope compositions as well as these isotopes measured in liquid honey or beeswax. There are also certain limitations with this approach because if the honey is shipped out of the region for processing, then moisture in the local atmosphere will exchange with the water in the honey, changing the isotopic signature. If the honey is unfiltered though, the hydrogen and oxygen isotopes could be measured in any beeswax retained in the honey. Beeswax, unlike liquid honey, retains the hydrogen and oxygen isotope fingerprints of where the honey originated. Of course, the intelligent fraudster will know this, and may potentially add beeswax to trick the test.
There are victories, but the game keeps changing
Food fraud detection is evolving in an ever-changing landscape. There is an increasing number of commercial foodstuffs on the market, each with inherent biochemical complexity. The scale and complexity of food supply chains is unprecedented. And for every new method of food authentication described in the literature, there are at least 20 new methods described for processing, preserving and manipulating food. The food cheats know this, and design their fraudulent methods within this world of complexity, uncertainty and chaotic practices.

Figure 2.3. Maybe I can trust my honey if it’s tested using the very best analytical methods science has to offer!
As our honey case study shows, there are some very advanced analytical chemical and biochemical methods that, when combined with informatics and chemometric techniques, are pointing the way forward. These new methods make for a well-equipped toolkit. Recent food fraud scandals have provided the impetus for governments around the world to direct financial and human resources into putting these toolkits to use. There has even been enough momentum to motivate concerted cooperative cross-border monitoring and control initiatives. Collectively, this means that our capacity to make serious dents in the activities of food fraudsters is now more advanced than it ever has been. Yet, why does it feel as if we are still playing catch-up? As the methods we’ve described in this chapter mature and we become more confident that our supermarket honey is what the label states, what new ways will fraudsters find to make their money? This is of particular concern at a time when pollinators (not just honey bees) are in crisis around the world.
In 2001, the US Department of Commerce implemented anti-dumping duties (a 300 per cent tariff) on honey imported from China to discourage suppliers from flooding the US market with cheap adulterated honey and putting their own domestic beekeepers out of business. To get around this duty, some US importers simply purchased honey from intermediary countries – ‘honey laundering’, so to speak. All honey labelled from China is subjected to veterinary testing in the US due to the likelihood of pesticide and antibiotic (some of which are banned) residues in the honey. If it’s laundered through another country and does not state that it’s a product of China, it will not be subjected to these tests. To get around this, all honey could be tested, but this is simply impractical. Honey from China also tends to be ultra-filtered so there is no pollen remaining in the honey at all. Pollen carries many of the benefits of honey, and the US FDA has ruled that honey that contains no pollen is no longer honey. It also makes origin testing more difficult. In 2011, Food Safety News purchased 60 jars of honey from around the US and had them tested by a pollen expert at Texas A&M University. Seventy-six per cent of the samples from supermarkets and cash-and-carry stores like Costco contained no pollen whatsoever. Is this even honey at all?
The solutions to this are both complex and simple. The complex solution for globalised suppliers is to commit to selling authentic products by signing up independent third-party auditors committed to socially responsible corporate practices. In the US, the True Source Honey organisation has created a certification programme that allows parties involved in the supply chain to demonstrate compliance with food purity and safety regulations. That’s the complex solution. The simple solution is to avoid the foreign imports by buying honey from your local beekeeper. Both of these solutions will probably increase the price we have to pay for honey. It’s a sad day when you have to pay a premium to know that what you’re eating is what you want to eat!