8.1 Automated Scaling Listener
8.10 State Management Database
A typical cloud technology architecture contains numerous moving parts to address distinct usage requirements of IT resources and solutions. Each mechanism covered in this chapter fulfills a specific runtime function in support of one or more cloud characteristics.
The following specialized cloud mechanisms are described in this chapter:
All of these mechanisms can be considered extensions to cloud infrastructure, and can be combined in numerous ways as part of distinct and custom technology architectures, many examples of which are provided in Part III of this book.
The automated scaling listener mechanism is a service agent that monitors and tracks communications between cloud service consumers and cloud services for dynamic scaling purposes. Automated scaling listeners are deployed within the cloud, typically near the firewall, from where they automatically track workload status information. Workloads can be determined by the volume of cloud consumer-generated requests or via back-end processing demands triggered by certain types of requests. For example, a small amount of incoming data can result in a large amount of processing.
Automated scaling listeners can provide different types of responses to workload fluctuation conditions, such as:
• Automatically scaling IT resources out or in based on parameters previously defined by the cloud consumer (commonly referred to as auto-scaling).
• Automatic notification of the cloud consumer when workloads exceed current thresholds or fall below allocated resources (Figure 8.1). This way, the cloud consumer can choose to adjust its current IT resource allocation.
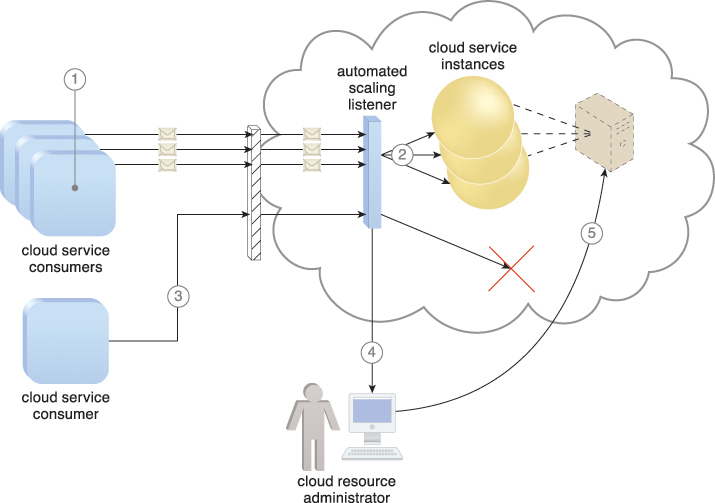
Figure 8.1 Three cloud service consumers attempt to access one cloud service simultaneously (1). The automated scaling listener scales out and initiates the creation of three redundant instances of the service (2). A fourth cloud service consumer attempts to use the cloud service (3). Programmed to allow up to only three instances of the cloud service, the automated scaling listener rejects the fourth attempt and notifies the cloud consumer that the requested workload limit has been exceeded (4). The cloud consumer’s cloud resource administrator accesses the remote administration environment to adjust the provisioning setup and increase the redundant instance limit (5).
Different cloud provider vendors have different names for service agents that act as automated scaling listeners.
Note
This case study example makes reference to the live VM migration component, which is introduced in the Hypervisor Clustering Architecture section in Chapter 12, and further described and demonstrated in subsequent architecture scenarios.
• Scaling-Down – The virtual server continues residing on the same physical host server while being scaled down to a lower performance configuration.
• Scaling-Up – The virtual server’s capacity is doubled on its original physical host server. The VIM may also live migrate the virtual server to another physical server if the original host server is overcommitted. Migration is automatically performed at runtime and does not require the virtual server to shut down.

Figure 8.2 A cloud consumer creates and starts a virtual server with 8 virtual processor cores and 16 GB of virtual RAM (1). The VIM creates the virtual server at the cloud service consumer’s request and allocates it to Physical Server 1 to join 3 other active virtual servers (2). Cloud consumer demand causes the virtual server usage to increase by over 80% of the CPU capacity for 60 consecutive seconds (3). The automated scaling listener running at the hypervisor detects the need to scale up and commands the VIM accordingly (4).
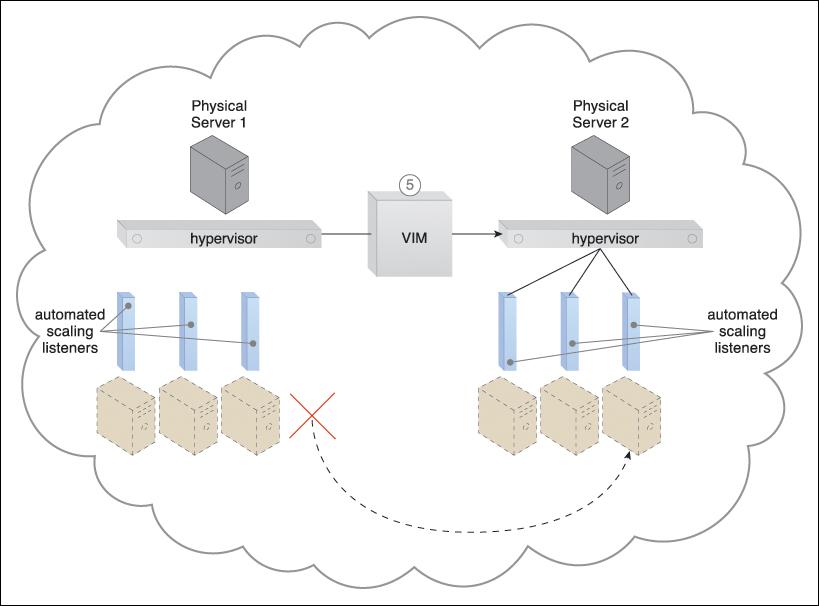
Figure 8.3 The VIM determines that scaling up the virtual server on Physical Server 1 is not possible and proceeds to live migrate it to Physical Server 2.
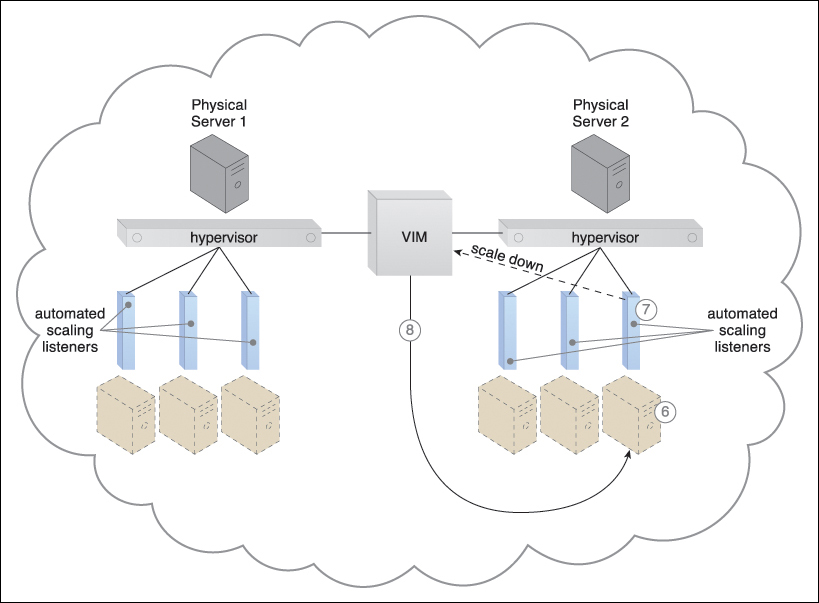
Figure 8.4 The virtual server’s CPU/RAM usage remains below 15% capacity for 60 consecutive seconds (6). The automated scaling listener detects the need to scale down and commands the VIM (7), which scales down the virtual server (8) while it remains active on Physical Server 2.
A common approach to horizontal scaling is to balance a workload across two or more IT resources to increase performance and capacity beyond what a single IT resource can provide. The load balancer mechanism is a runtime agent with logic fundamentally based on this premise.
Beyond simple division of labor algorithms (Figure 8.5), load balancers can perform a range of specialized runtime workload distribution functions that include:
• Asymmetric Distribution – larger workloads are issued to IT resources with higher processing capacities
• Workload Prioritization – workloads are scheduled, queued, discarded, and distributed workloads according to their priority levels
• Content-Aware Distribution – requests are distributed to different IT resources as dictated by the request content
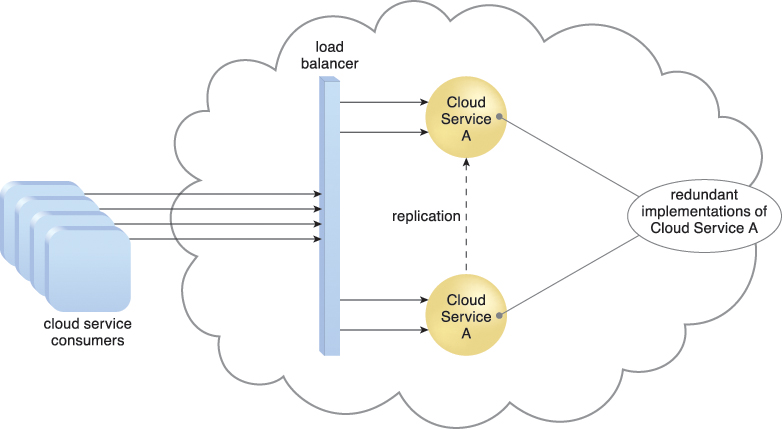
Figure 8.5 A load balancer implemented as a service agent transparently distributes incoming workload request messages across two redundant cloud service implementations, which in turn maximizes performance for the cloud service consumers.
A load balancer is programmed or configured with a set of performance and QoS rules and parameters with the general objectives of optimizing IT resource usage, avoiding overloads, and maximizing throughput.
The load balancer mechanisms can exist as a:
• multi-layer network switch
• dedicated hardware appliance
• dedicated software-based system (common in server operating systems)
• service agent (usually controlled by cloud management software)
The load balancer is typically located on the communication path between the IT resources generating the workload and the IT resources performing the workload processing. This mechanism can be designed as a transparent agent that remains hidden from the cloud service consumers, or as a proxy component that abstracts the IT resources performing their workload.
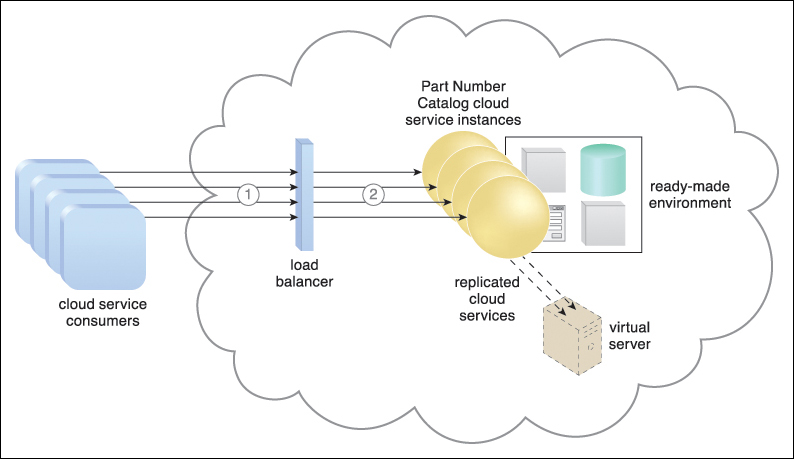
Figure 8.6 New instances of the cloud services are automatically created to meet increasing usage requests. The load balancer uses round-robin scheduling to ensure that the traffic is distributed evenly among the active cloud services.
The SLA monitor mechanism is used to specifically observe the runtime performance of cloud services to ensure that they are fulfilling the contractual QoS requirements that are published in SLAs (Figure 8.7). The data collected by the SLA monitor is processed by an SLA management system to be aggregated into SLA reporting metrics. The system can proactively repair or failover cloud services when exception conditions occur, such as when the SLA monitor reports a cloud service as “down.”
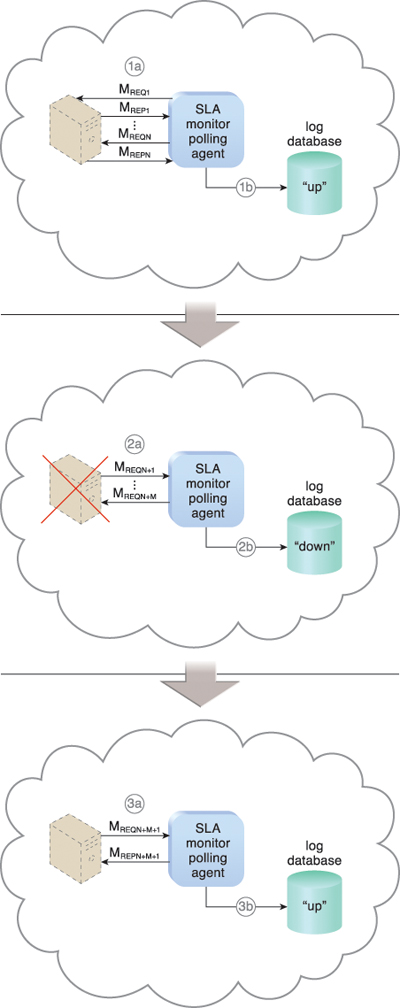
Figure 8.7 The SLA monitor polls the cloud service by sending over polling request messages (MREQ1 to MREQN). The monitor receives polling response messages (MREP1 to MREPN) that report that the service was “up” at each polling cycle (1a). The SLA monitor stores the “up” time—time period of all polling cycles 1 to N—in the log database (1b).
The SLA monitor polls the cloud service that sends polling request messages (MREQN+1 to MREQN+M). Polling response messages are not received (2a). The response messages continue to time out, so the SLA monitor stores the “down” time—time period of all polling cycles N+1 to N+M—in the log database (2b).
The SLA monitor sends a polling request message (MREQN+M+1) and receives the polling response message (MREPN+M+1) (3a). The SLA monitor stores the “up” time in the log database (3b).
The SLA management system mechanism is discussed in Chapter 9.
• PS_Timeout – the physical server polling has timed out
• PS_Unreachable – the physical server polling has consecutively timed out three times
• PS_Reachable – the previously unavailable physical server becomes responsive to polling again
• VM_Unreachable – the VIM cannot reach the VM
• VM Failure – the VM has failed and is unavailable
• VM_Reachable – the VM is reachable
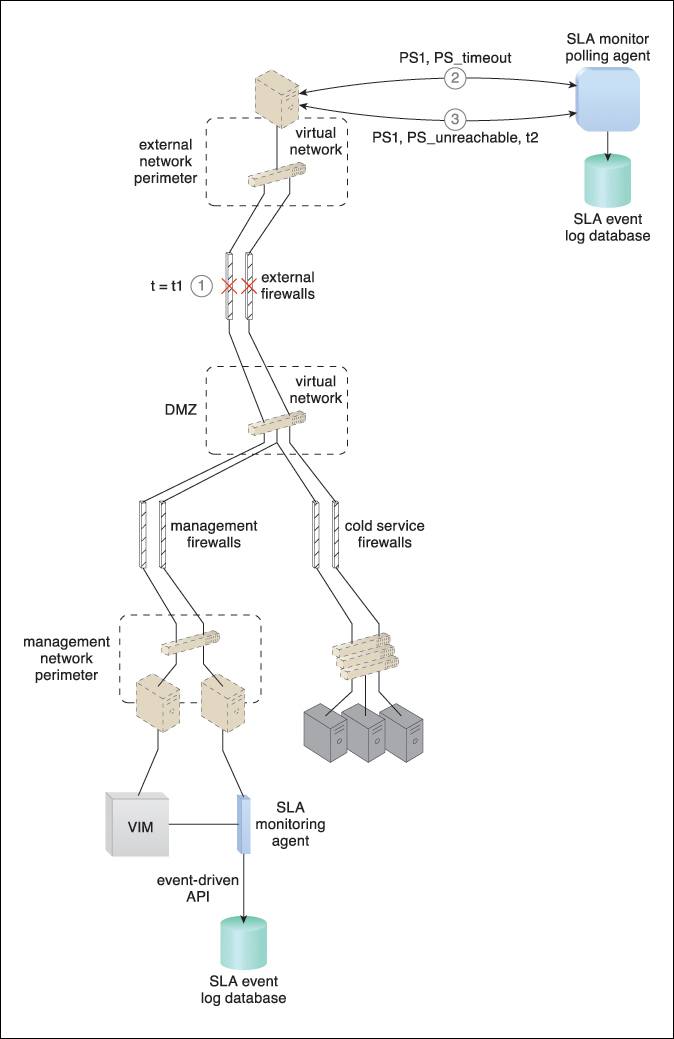
Figure 8.8 At timestamp = t1, a firewall cluster has failed and all of the IT resources in the data center become unavailable (1). The SLA monitor polling agent stops receiving responses from physical servers and starts to issue PS_timeout events (2). The SLA monitor polling agent starts issuing PS_unreachable events after three successive PS_timeout events. The timestamp is now t2 (3).

Figure 8.9 The IT resource becomes operational at timestamp = t3 (4). The SLA monitor polling agent receives responses from the physical servers and issues PS_reachable events. The timestamp is now t4 (5). The SLA monitoring agent did not detect any unavailability since the communication between the VIM platform and physical servers was not affected by the failure (6).
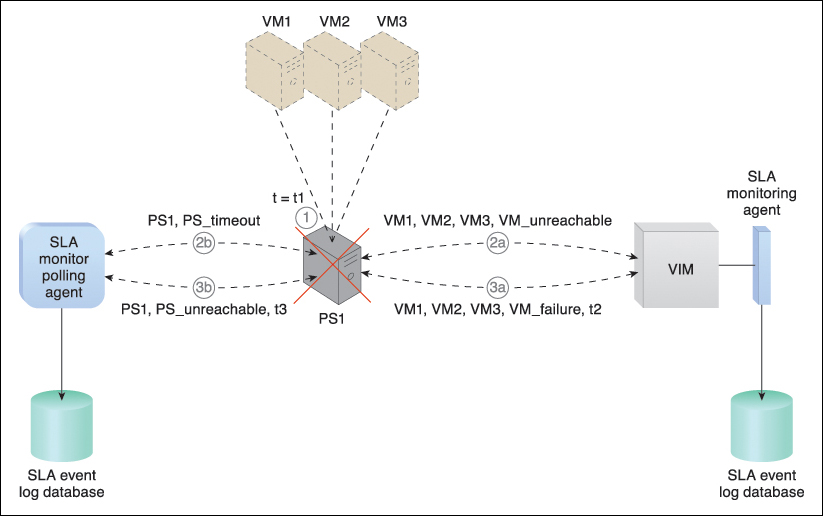
Figure 8.10 At timestamp = t1, the physical host server has failed and becomes unavailable (1). The SLA monitoring agent captures a VM_unreachable event that is generated for each virtual server in the failed host server (2a). The SLA monitor polling agent stops receiving responses from the host server and issues PS_timeout events (2b). At timestamp = t2, the SLA monitoring agent captures a VM_failure event that is generated for each of the failed host server’s three virtual servers (3a). The SLA monitor polling agent starts to issue PS_unavailable events after three successive PS_timeout events at timestamp = t3 (3b).
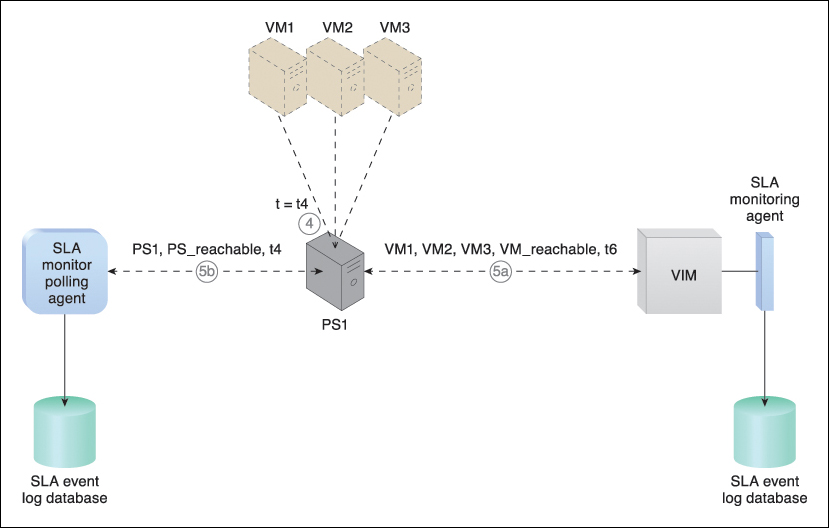
Figure 8.11 The host server becomes operational at timestamp = t4 (4). The SLA monitor polling agent receives responses from the physical server and issues PS_reachable events at timestamp = t5 (5a). At timestamp = t6, the SLA monitoring agent captures a VM_reachable event that is generated for each virtual server (5b). The SLA management system calculates the unavailability period that affected all of the virtual servers as t6 – t2.
The pay-per-use monitor mechanism measures cloud-based IT resource usage in accordance with predefined pricing parameters and generates usage logs for fee calculations and billing purposes.
Some typical monitoring variables are:
• request/response message quantity
• transmitted data volume
• bandwidth consumption
The data collected by the pay-per-use monitor is processed by a billing management system that calculates the payment fees. The billing management system mechanism is covered in Chapter 9.
Figure 8.12 shows a pay-per-use monitor implemented as a resource agent used to determine the usage period of a virtual server.
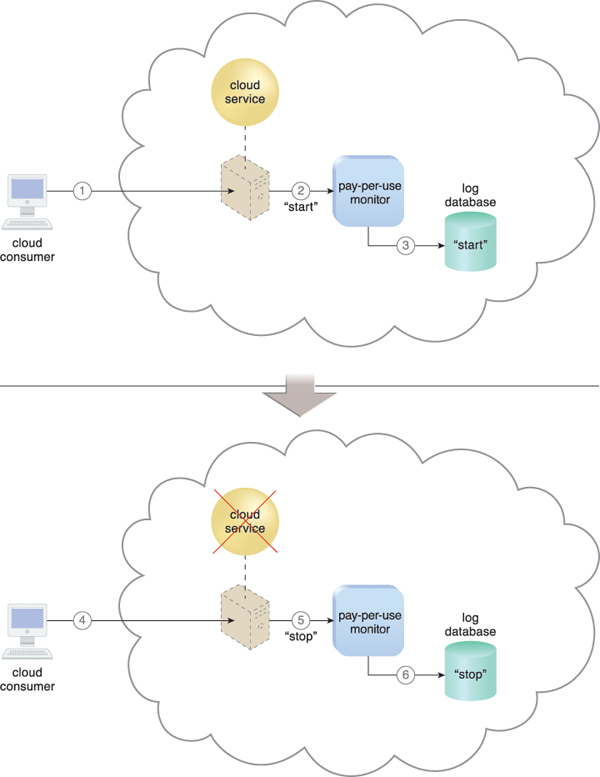
Figure 8.12 A cloud consumer requests the creation of a new instance of a cloud service (1). The IT resource is instantiated and the pay-per-use monitor receives a “start” event notification from the resource software (2). The pay-per-use monitor stores the value timestamp in the log database (3). The cloud consumer later requests that the cloud service instance be stopped (4). The pay-per-use monitor receives a “stop” event notification from the resource software (5) and stores the value timestamp in the log database (6).
Figure 8.13 illustrates a pay-per-use monitor designed as a monitoring agent that transparently intercepts and analyzes runtime communication with a cloud service.
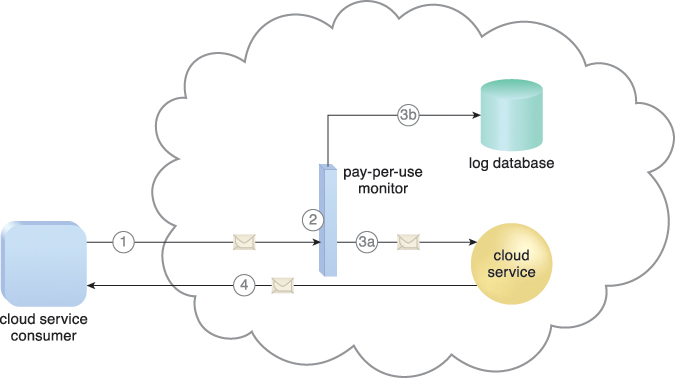
Figure 8.13 A cloud service consumer sends a request message to the cloud service (1). The pay-per-use monitor intercepts the message (2), forwards it to the cloud service (3a), and stores the usage information in accordance with its monitoring metrics (3b). The cloud service forwards the response messages back to the cloud service consumer to provide the requested service (4).
• Cloud Consumer Subscription Type – This information is used to identify the type of pricing model for usage fee calculations, including pre-paid subscription with usage quota, post-paid subscription with maximum usage quota, and post-paid subscription with unlimited usage.
• Resource Usage Category – The billing management system uses this information to identify the range of usage fees that are applicable to each usage event. Examples include normal usage, reserved IT resource usage, and premium (managed) service usage.
• Resource Usage Quota Consumption – When usage contracts define IT resource usage quotas, usage event conditions are typically supplemented with quota consumption and updated quota limits.

Figure 8.14 The cloud consumer (CS_ID = CS1) creates and starts a virtual server (VM_ID = VM1) of configuration size type 1 (VM_TYPE = type1) (1). The VIM creates the virtual server instance as requested (2a). The VIM’s event-driven API generates a resource usage event with timestamp = t1, which is captured and forwarded to the pay-per-use monitor by the cloud usage monitor (2b). The pay-per-use monitor interacts with the pricing scheme database to identify the chargeback and usage metrics that apply to the resource usage. A “started usage” billable event is generated and stored in the billable event log database (3). The virtual server’s usage increases and reaches the auto-scaling threshold (4). The VIM scales up Virtual Server VM1 (5a) from configuration type 1 to type 2 (VM_TYPE = type2). The VIM’s event-driven API generates a resource usage event with timestamp = t2, which is captured and forwarded to the pay-per-use monitor by the cloud usage monitor (5b). The pay-per-use monitor interacts with the pricing scheme database to identify the chargeback and usage metrics that apply to the updated IT resource usage. A “changed usage” billable event is generated and stored in the billable event log database (6). The cloud consumer shuts down the virtual server (7) and the VIM stops Virtual Server VM1 (8a). The VIM’s event-driven API generates a resource usage event with timestamp = t3, which is captured and forwarded to the pay-per-use monitor by the cloud usage monitor (8b). The pay-per-use monitor interacts with the pricing scheme database to identify the chargeback and usage metrics that apply to the updated IT resource usage. A “finished usage” billable event is generated and stored in the billable event log database (9). The billing system tool can now be used by the cloud provider to access the log database and calculate the total usage fee for the virtual server as (Fee(VM1)) (10).
The audit monitor mechanism is used to collect audit tracking data for networks and IT resources in support of (or dictated by) regulatory and contractual obligations. Figure 8.15 depicts an audit monitor implemented as a monitoring agent that intercepts “login” requests and stores the requestor’s security credentials, as well as both failed and successful login attempts, in a log database for future audit reporting purposes.
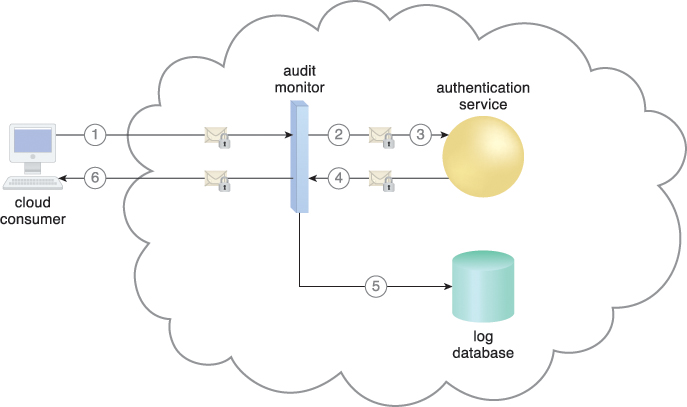
Figure 8.15 A cloud service consumer requests access to a cloud service by sending a login request message with security credentials (1). The audit monitor intercepts the message (2) and forwards it to the authentication service (3). The authentication service processes the security credentials. A response message is generated for the cloud service consumer, in addition to the results from the login attempt (4). The audit monitor intercepts the response message and stores the entire collected login event details in the log database, as per the organization’s audit policy requirements (5). Access has been granted, and a response is sent back to the cloud service consumer (6).
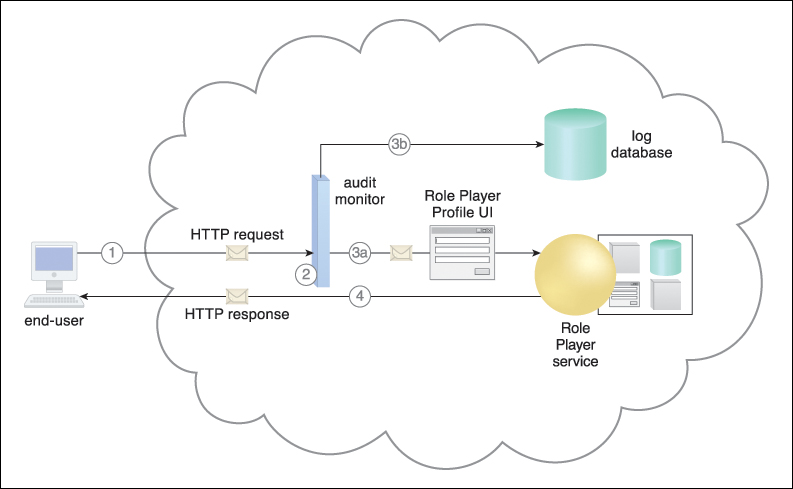
Figure 8.16 An end-user attempts access to the Role Player cloud service (1). An audit monitor transparently intercepts the HTTP request message and analyzes the message header to determine the geographical origin of the end-user (2). The audit monitoring agent determines that the end-user is from a region that Innovartus is not authorized to charge a fee for access to the application. The agent forwards the message to the cloud service (3a) and generates the audit track information for storage in the log database (3b). The cloud service receives the HTTP message and grants the end-user access at no charge (4).
The failover system mechanism is used to increase the reliability and availability of IT resources by using established clustering technology to provide redundant implementations. A failover system is configured to automatically switch over to a redundant or standby IT resource instance whenever the currently active IT resource becomes unavailable.
Failover systems are commonly used for mission-critical programs and reusable services that can introduce a single point of failure for multiple applications. A failover system can span more than one geographical region so that each location hosts one or more redundant implementations of the same IT resource.
The resource replication mechanism is sometimes utilized by the failover system to provide redundant IT resource instances, which are actively monitored for the detection of errors and unavailability conditions.
Failover systems come in two basic configurations:
In an active-active configuration, redundant implementations of the IT resource actively serve the workload synchronously (Figure 8.17). Load balancing among active instances is required. When a failure is detected, the failed instance is removed from the load balancing scheduler (Figure 8.18). Whichever IT resource remains operational when a failure is detected takes over the processing (Figure 8.19).
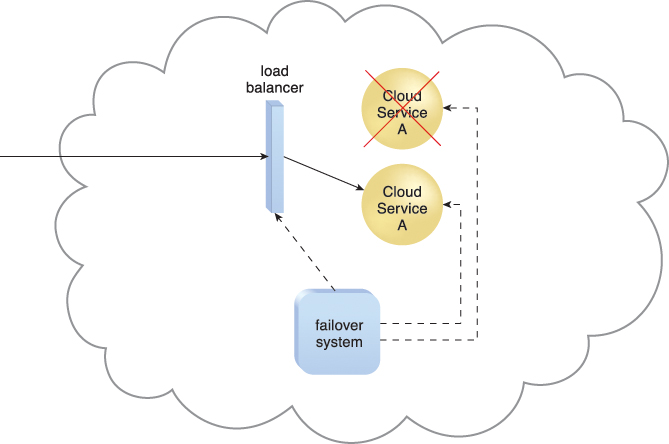
Figure 8.18 When a failure is detected in one Cloud Service A implementation, the failover system commands the load balancer to switch over the workload to the redundant Cloud Service A implementation.
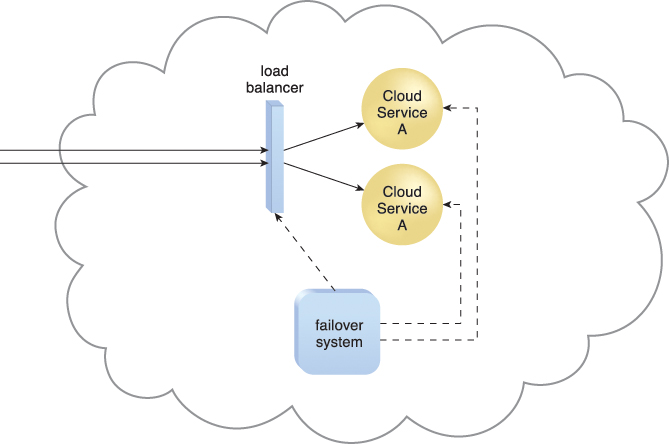
Figure 8.19 The failed Cloud Service A implementation is recovered or replicated into an operational cloud service. The failover system now commands the load balancer to distribute the workload again.
In an active-passive configuration, a standby or inactive implementation is activated to take over the processing from the IT resource that becomes unavailable, and the corresponding workload is redirected to the instance taking over the operation (Figures 8.20 to 8.22).
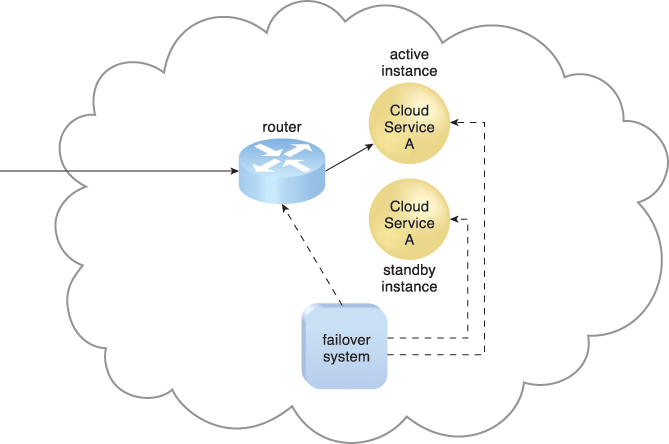
Figure 8.20 The failover system monitors the operational status of Cloud Service A. The Cloud Service A implementation acting as the active instance is receiving cloud service consumer requests.
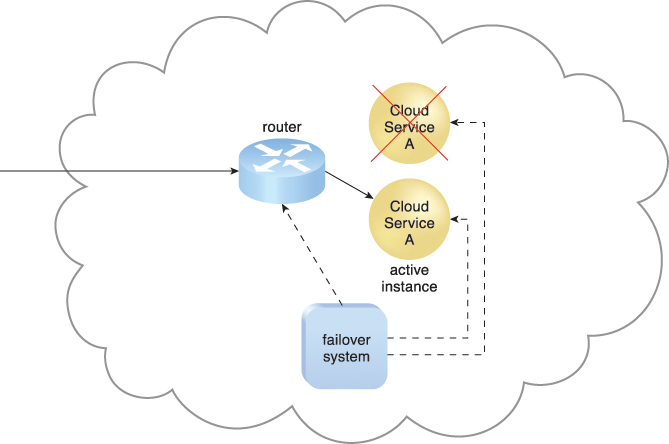
Figure 8.21 The Cloud Service A implementation acting as the active instance encounters a failure that is detected by the failover system, which subsequently activates the inactive Cloud Service A implementation and redirects the workload toward it. The newly invoked Cloud Service A implementation now assumes the role of active instance.
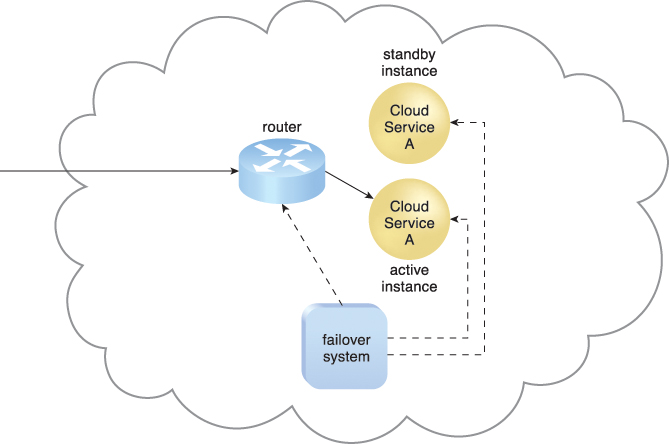
Figure 8.22 The failed Cloud Service A implementation is recovered or replicated an operational cloud service, and is now positioned as the standby instance, while the previously invoked Cloud Service A continues to serve as the active instance.
Some failover systems are designed to redirect workloads to active IT resources that rely on specialized load balancers that detect failure conditions and exclude failed IT resource instances from the workload distribution. This type of failover system is suitable for IT resources that do not require execution state management and provide stateless processing capabilities. In technology architectures that are typically based on clustering and virtualization technologies, the redundant or standby IT resource implementations are also required to share their state and execution context. A complex task that was executed on a failed IT resource can remain operational in one of its redundant implementations.
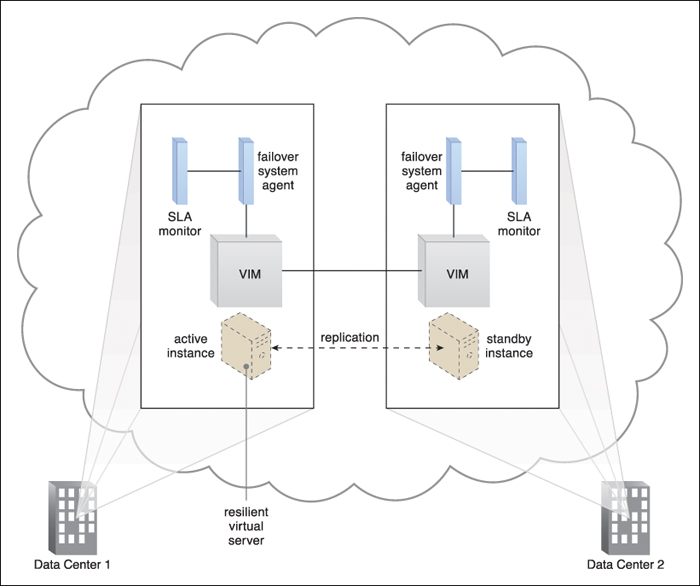
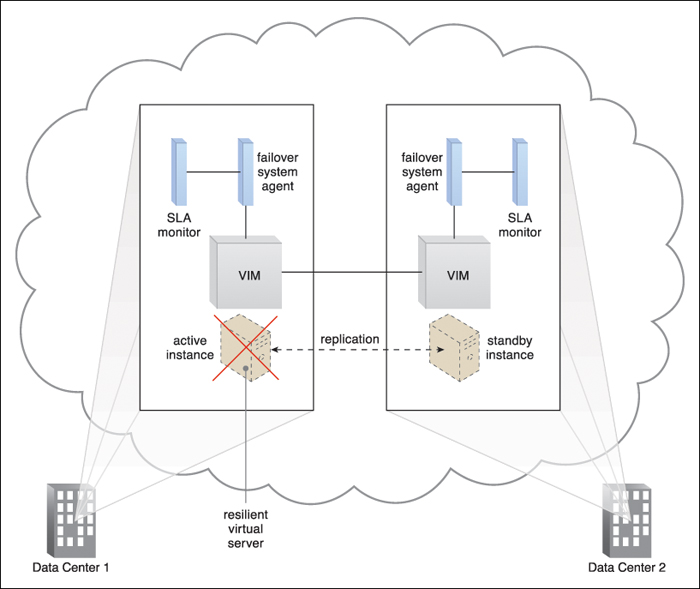
Figure 8.23 A resilient virtual server is established by replicating the virtual server instance across two different data centers, as performed by the VIM that is running at both data centers. The active instance receives the network traffic and is vertically scaling in response, while the standby instance has no workload and runs at the minimum configuration.
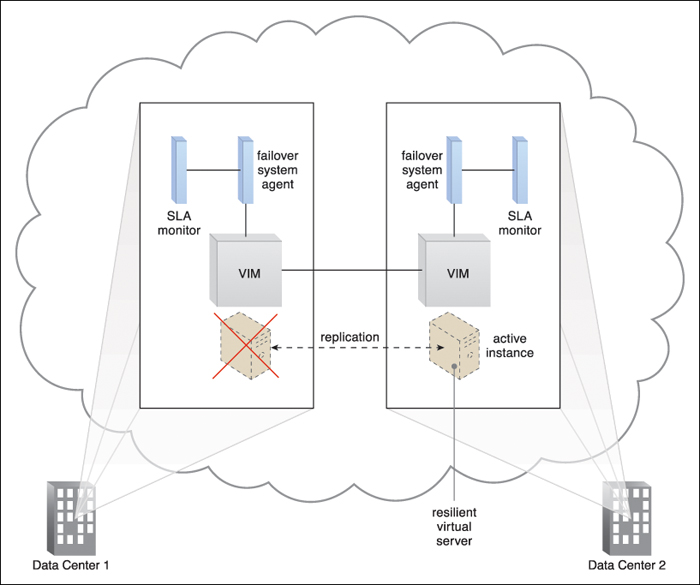
Figure 8.25 The failover system is implemented as an event-driven software agent that intercepts the message notifications the SLA monitors send regarding server unavailability. In response, the failover system interacts with the VIM and network management tools to redirect all of the network traffic to the now-active standby instance.
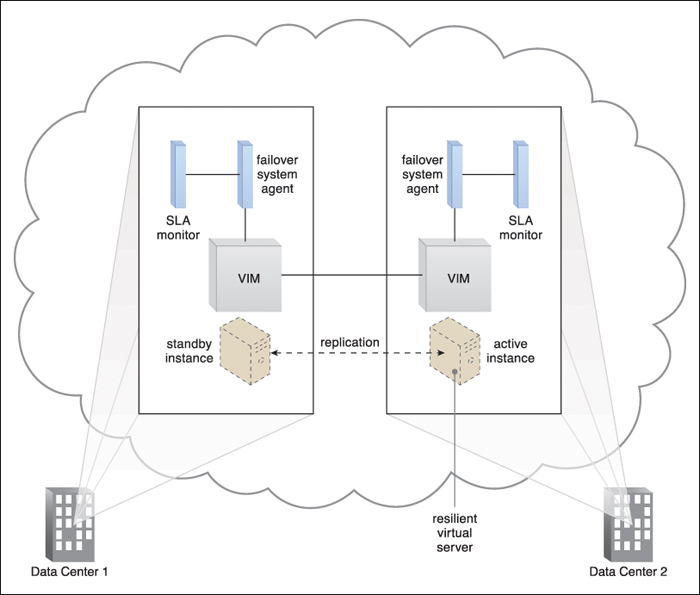
Figure 8.26 The failed virtual server instance is revived and scaled down to the minimum standby instance configuration after it resumes normal operation.
The hypervisor mechanism is a fundamental part of virtualization infrastructure that is primarily used to generate virtual server instances of a physical server. A hypervisor is generally limited to one physical server and can therefore only create virtual images of that server (Figure 8.27). Similarly, a hypervisor can only assign virtual servers it generates to resource pools that reside on the same underlying physical server. A hypervisor has limited virtual server management features, such as increasing the virtual server’s capacity or shutting it down. The VIM provides a range of features for administering multiple hypervisors across physical servers.
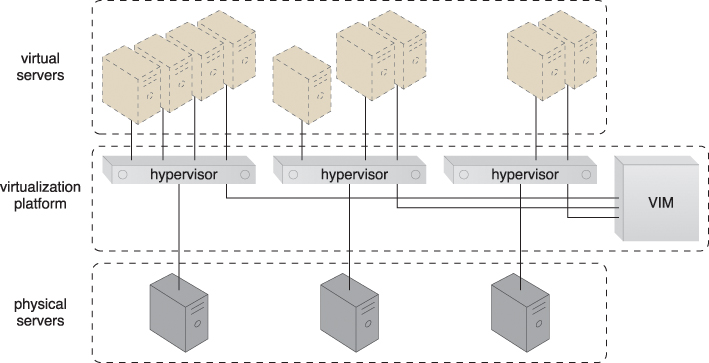
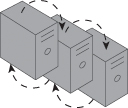
Figure 8.27 Virtual servers are created via individual hypervisor on individual physical servers. All three hypervisors are jointly controlled by the same VIM.
Hypervisor software can be installed directly in bare-metal servers and provides features for controlling, sharing and scheduling the usage of hardware resources, such as processor power, memory, and I/O. These can appear to each virtual server’s operating system as dedicated resources.
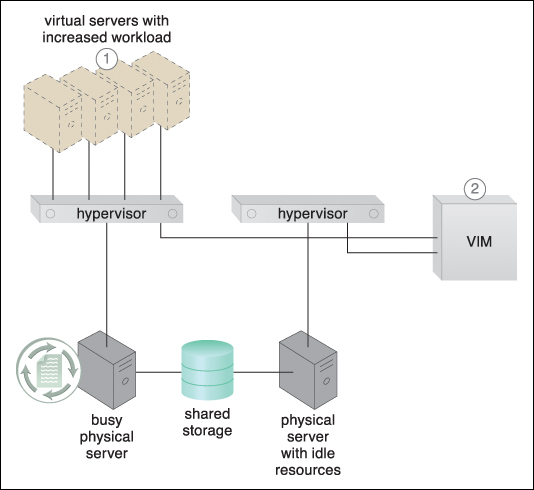
Figure 8.28 A virtual server capable of auto-scaling experiences an increase in its workload (1). The VIM decides that the virtual server cannot scale up because its underlying physical server host is being used by other virtual servers (2).
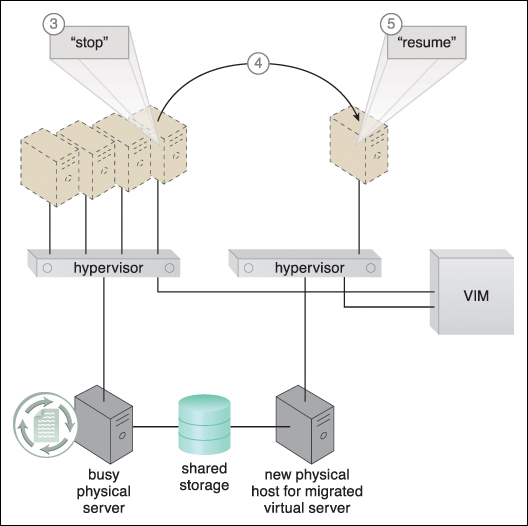
Figure 8.29 The VIM commands the hypervisor on the busy physical server to suspend execution of the virtual server (3). The VIM then commands the instantiation of the virtual server on the idle physical server. State information (such as dirty memory pages and processor registers) is synchronized via a shared cloud storage device (4). The VIM commands the hypervisor at the new physical server to resume the virtual server processing (5).
Cloud-based IT resources that are geographically diverse can be logically combined into groups to improve their allocation and use. The resource cluster mechanism (Figure 8.30) is used to group multiple IT resource instances so that they can be operated as a single IT resource. This increases the combined computing capacity, load balancing, and availability of the clustered IT resources.
Resource cluster architectures rely on high-speed dedicated network connections, or cluster nodes, between IT resource instances to communicate about workload distribution, task scheduling, data sharing, and system synchronization. A cluster management platform that is running as distributed middleware in all of the cluster nodes is usually responsible for these activities. This platform implements a coordination function that allows distributed IT resources to appear as one IT resource, and also executes IT resources inside the cluster.
Common resource cluster types include:
• Server Cluster – Physical or virtual servers are clustered to increase performance and availability. Hypervisors running on different physical servers can be configured to share virtual server execution state (such as memory pages and processor register state) in order to establish clustered virtual servers. In such configurations, which usually require physical servers to have access to shared storage, virtual servers are able to live-migrate from one to another. In this process, the virtualization platform suspends the execution of a given virtual server at one physical server and resumes it on another physical server. The process is transparent to the virtual server operating system and can be used to increase scalability by live-migrating a virtual server that is running at an overloaded physical server to another physical server that has suitable capacity.
• Database Cluster – Designed to improve data availability, this high-availability resource cluster has a synchronization feature that maintains the consistency of data being stored at different storage devices used in the cluster. The redundant capacity is usually based on an active-active or active-passive failover system committed to maintaining the synchronization conditions.
• Large Dataset Cluster – Data partitioning and distribution is implemented so that the target datasets can be efficiently partitioned without compromising data integrity or computing accuracy. Each cluster node processes workloads without communicating with other nodes as much as in other cluster types.
Many resource clusters require cluster nodes to have almost identical computing capacity and characteristics in order to simplify the design of and maintain consistency within the resource cluster architecture. The cluster nodes in high-availability cluster architectures need to access and share common storage IT resources. This can require two layers of communication between the nodes—one for accessing the storage device and another to execute IT resource orchestration (Figure 8.31). Some resource clusters are designed with more loosely coupled IT resources that only require the network layer (Figure 8.32).
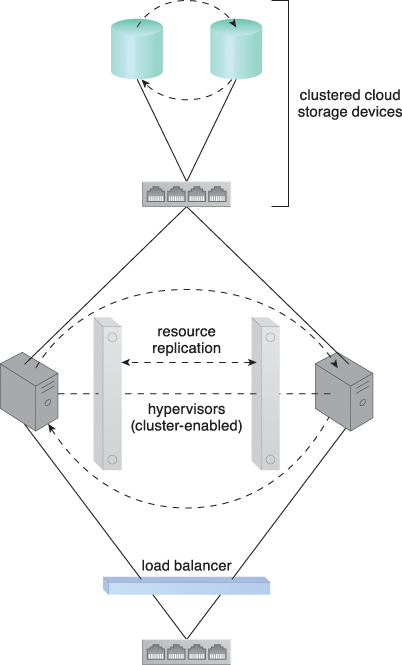
Figure 8.31 Load balancing and resource replication are implemented through a cluster-enabled hypervisor. A dedicated storage area network is used to connect the clustered storage and the clustered servers, which are able to share common cloud storage devices. This simplifies the storage replication process, which is independently carried out at the storage cluster. (See the Hypervisor Clustering Architecture section in Chapter 12 for a more detailed description.)
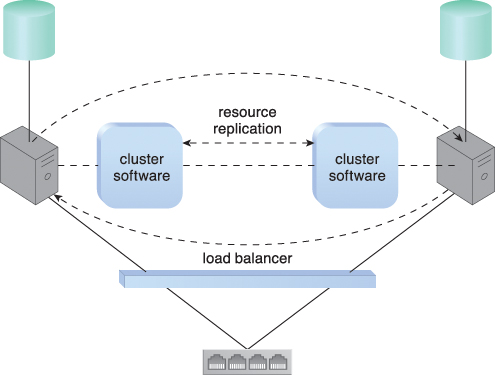
Figure 8.32 A loosely coupled server cluster that incorporates a load balancer. There is no shared storage. Resource replication is used to replicate cloud storage devices through the network by the cluster software.
There are two basic types of resource clusters:
• Load Balanced Cluster – This resource cluster specializes in distributing workloads among cluster nodes to increase IT resource capacity while preserving the centralization of IT resource management. It usually implements a load balancer mechanism that is either embedded within the cluster management platform or set up as a separate IT resource.
• HA Cluster – A high-availability cluster maintains system availability in the event of multiple node failures, and has redundant implementations of most or all of the clustered IT resources. It implements a failover system mechanism that monitors failure conditions and automatically redirects the workload away from any failed nodes.
The provisioning of clustered IT resources can be considerably more expensive than the provisioning of individual IT resources that have an equivalent computing capacity.
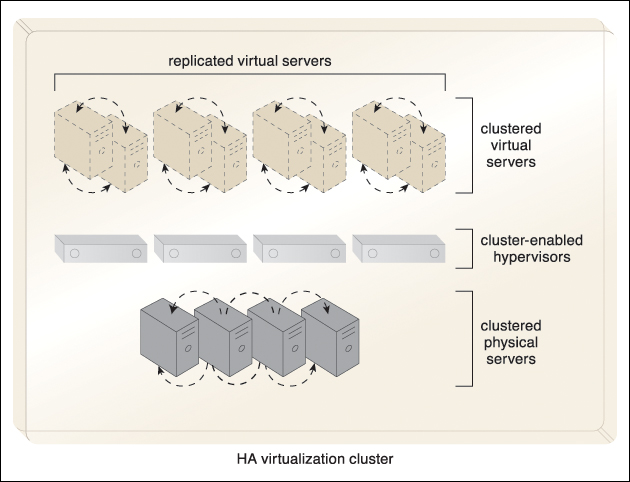
Figure 8.33 An HA virtualization cluster of physical servers is deployed using a cluster-enabled hypervisor, which guarantees that the physical servers are constantly in sync. Every virtual server that is instantiated in the cluster is automatically replicated in at least two physical servers.
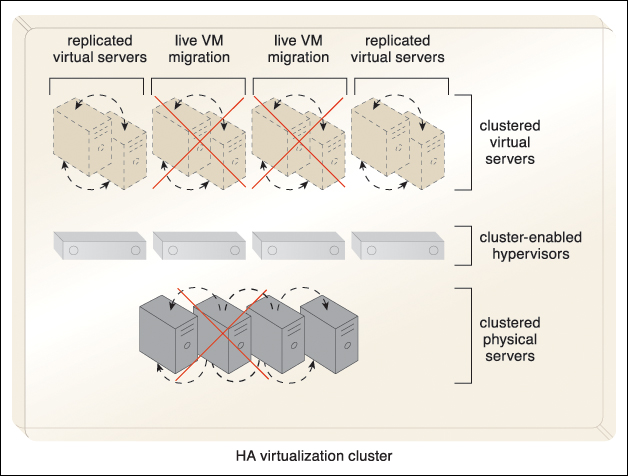
Figure 8.34 All of the virtual servers that are hosted on a physical server experiencing failure are automatically migrated to other physical servers.
An individual cloud service may need to be accessed by a range of cloud service consumers differentiated by their hosting hardware devices and/or communication requirements. To overcome incompatibilities between a cloud service and a disparate cloud service consumer, mapping logic needs to be created to transform (or convert) information that is exchanged at runtime.
The multi-device broker mechanism is used to facilitate runtime data transformation so as to make a cloud service accessible to a wider range of cloud service consumer programs and devices (Figure 8.35).
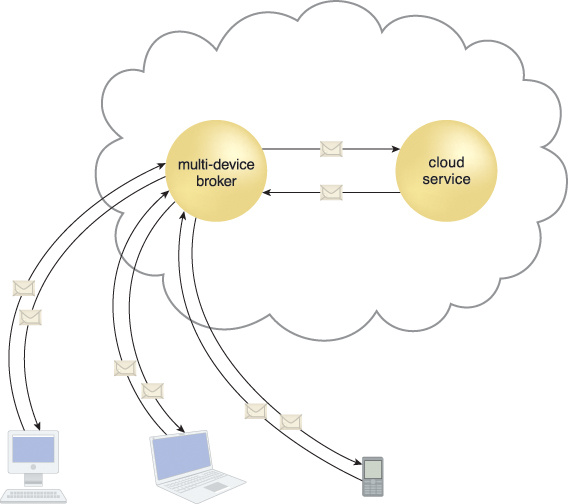
Figure 8.35 A multi-device broker contains the mapping logic necessary to transform data exchanges between a cloud service and different types of cloud service consumer devices. This scenario depicts the multi-device broker as a cloud service with its own API. This mechanism can also be implemented as a service agent that intercepts messages at runtime to perform necessary transformations.
Multi-device brokers commonly exist as gateways or incorporate gateway components, such as:
• XML Gateway – transmits and validates XML data
• Cloud Storage Gateway – transforms cloud storage protocols and encodes storage devices to facilitate data transfer and storage
• Mobile Device Gateway – transforms the communication protocols used by mobile devices into protocols that are compatible with a cloud service
The levels at which transformation logic can be created include:
• transport protocols
• messaging protocols
• storage device protocols
• data schemas/data models
For example, a multi-device broker may contain mapping logic that coverts both transport and messaging protocols for a cloud service consumer accessing a cloud service with a mobile device.
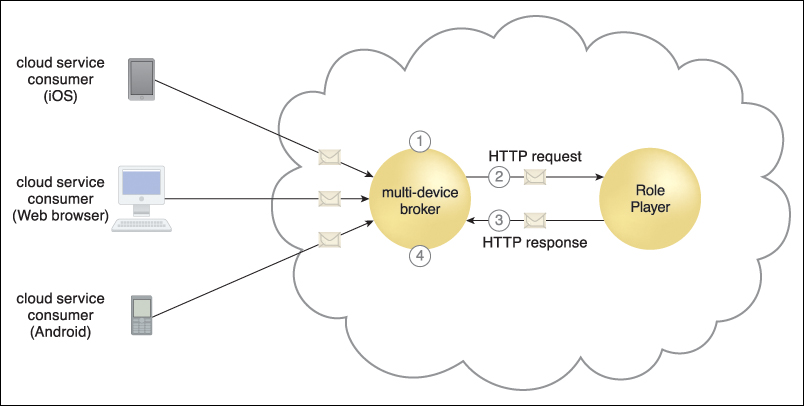
Figure 8.36 The multi-device broker intercepts incoming messages and detects the platform (Web browser, iOS, Android) of the source device (1). The multi-device broker transforms the message into the standard format required by the Innovartus cloud service (2). The cloud service processes the request and responds using the same standard format (3). The multi-device broker transforms the response message into the format required by the source device and delivers the message (4).
A state management database is a storage device that is used to temporarily persist state data for software programs. As an alternative to caching state data in memory, software programs can off-load state data to the database in order to reduce the amount of runtime memory they consume (Figures 8.37 and 8.38). By doing so, the software programs and the surrounding infrastructure are more scalable. State management databases are commonly used by cloud services, especially those involved in long-running runtime activities.

Figure 8.37 During the lifespan of a cloud service instance it may be required to remain stateful and keep state data cached in memory, even when idle.
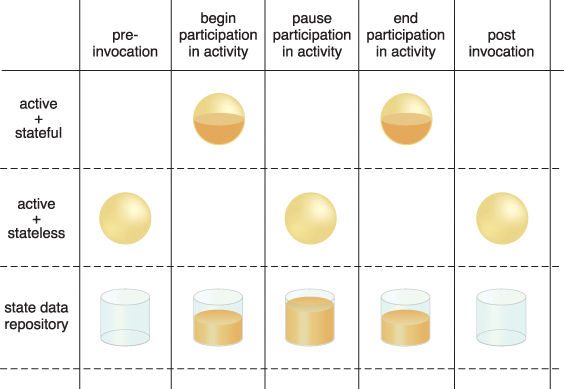
Figure 8.38 By deferring state data to a state repository, the cloud service is able to transition to a stateless condition (or a partially stateless condition), thereby temporarily freeing system resources.
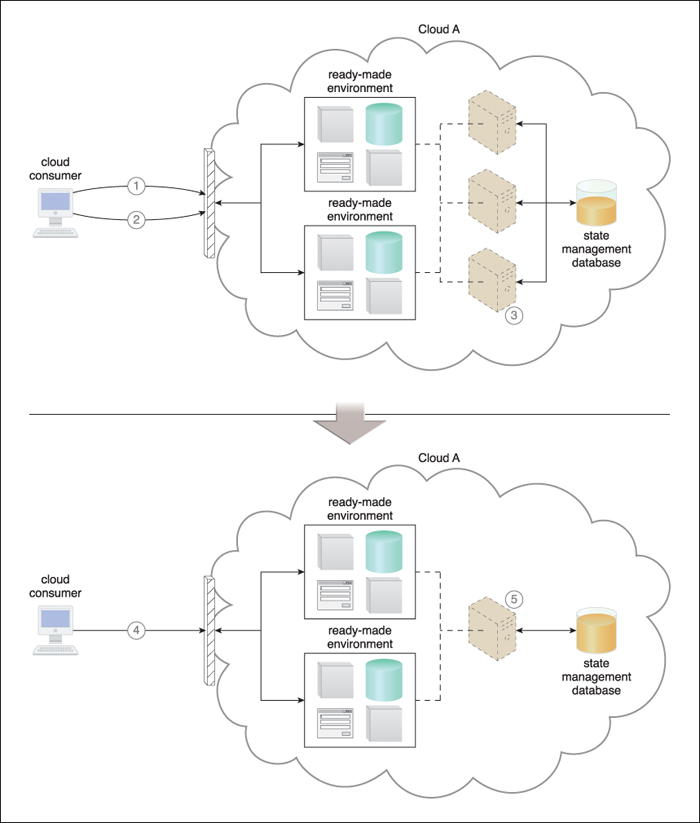
Figure 8.39 The cloud consumer accesses the ready-made environment and requires three virtual servers to perform all activities (1). The cloud consumer pauses activity. All of the state data needs to be preserved for future access to the ready-made environment (2). The underlying infrastructure is automatically scaled in by reducing the number of virtual servers. State data is saved in the state management database and one virtual server remains active to allow for future logins by the cloud consumer (3). At a later point, the cloud consumer logs in and accesses the ready-made environment to continue activity (4). The underlying infrastructure is automatically scaled out by increasing the number of virtual servers and by retrieving the state data from the state management database (5).