The concept of the market approach in business appraisal is that valuation guidance can be found in transactions involving similar companies. It is the same technique as the more familiar appraisal of a house by analyzing sales of similar houses. However, “similar” businesses have far more differences among them than do similar houses, and the appraiser must carefully analyze the similarities and differences.
The market approach to business appraisal also has several dimensions that must be considered that are either not found at all or treated differently in the real estate appraisal comparative sales approach:
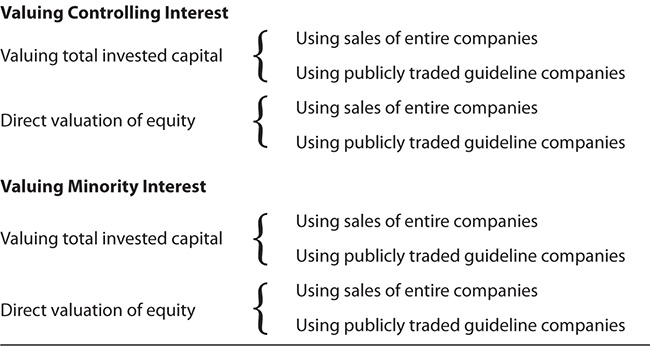
• Valuing controlling versus minority interests
• Valuing total invested capital versus direct valuation of equity
• Whether guideline transactions are sales of entire businesses or publicly traded minority interest stock market transactions
These possibilities are shown schematically in Exhibit 16.1.
Major Market Approach Business Valuation Scenarios
In real estate appraisal, the valuation is virtually always that of a controlling (fee simple) interest in the property. After that, if valuing a partial interest, some minority discount may be applied to the fractional interest’s pro rata portion of the fee simple interest value. In business appraisal, minority interests often are valued directly—that is, without ever addressing the question of what the company as a whole, on a controlling interest basis, might be worth. This is possible because there are thousands of public companies with minority shares actively traded every day.
The differences between minority and control value usually are considerably greater for businesses than for real estate. This is because owners of a fractional interest in real estate usually have the right to demand partition, thus converting their ownership interest to a controlling or fee simple interest. Owners of stock or partnership interests usually have no such right, leaving them at the mercy of policy decisions of the control owners.
If one starts with guideline sales of entire companies (merger and acquisition transactions) in the market approach (called the transaction method), then, if valuing a minority interest, it usually would be appropriate to make both a minority interest and a lack of marketability adjustment to the indicated control value. If one starts with publicly traded minority interest transactions in the market approach, then, if valuing a controlling interest, it may be appropriate to apply a control premium to the indicated value, and one might also consider a discount for lack of marketability.
However, control premiums certainly are not automatic when using publicly traded minority interest transactions to value a controlling interest.
In real estate appraisal, property normally is appraised without regard to how much debt or other claims there may be against it. In business appraisal, if all components of the capital structure are appraised, it is usually called value of invested capital or market value of invested capital (MVIC). However, in business appraisal, the equity interest sometimes is valued directly without going through the step of estimating the value of the entire company, including debt and equity interests combined.
To get to a value for the equity, one can use market multiples of various levels of income available to equity owners (for example, price-to-earnings ratios). Alternatively, one can value the entire invested capital, including returns available to holders of interest-bearing debt and preferred stock, and then subtract the value of the senior securities to get to the value of the common equity.
Either procedure can be used for valuing either controlling or minority interests. However, the invested capital procedure tends to be preferred for valuing controlling interests, and the direct valuation of equity tends to be preferred for valuing minority interests. The reason for this preference is that a controlling interest holder can change the capital structure if that may enhance the value of the equity, while the minority interest owner does not have that option. However, if the subject and guideline companies have considerably diverse capital structures, eliminating the potential effects of that difference sometimes is a reason, and even a compelling reason to use the invested capital procedure even when valuing minority interests.
There are two commonly used types of market transactions:
• Sales of entire companies, or possibly controlling interests in companies. Some would divide this into two subcategories:
 Companies that were publicly traded before the transaction
Companies that were privately owned before the transaction1
• Publicly traded company transactions (day-to-day transactions of minority interests in companies in the public stock markets).
Unfortunately, there are virtually no reliable data available on minority interest transactions in privately held companies. Therefore, if the appraiser is using the market approach to value a private company minority interest, he or she is forced to start with the above available data and adjust for the minority and marketability factors. If the standard of value is fair market value, the appraiser may consider eliminating or making adjustments for transactions that may have been representative of investment value rather than fair market value.
Fortunately, however, there have been huge improvements in recent years in the amount, quality, and ease of access to both public market transaction data and data on sales of entire companies, both public and private. This makes a good market approach valuation much more feasible today for many companies than it has been in the past.
As noted above, market data can be classified into two groups: (1) sales of entire companies or controlling interests of companies that were publicly traded or privately owned before the sale and (2) publicly traded company market transactions.
Public company data usually have the advantages of being more complete and more verifiable. On the other hand, if one is valuing a controlling interest, it may be preferable to start with controlling interest guideline transactions and not have to deal with the issue of a control premium.
Another reason to use private company controlling interest transactions in some cases is that there are many industries and professional practices that have few or no public companies.
If a public company is sold, required filings with the Securities and Exchange Commission (SEC) provide excellent data for implementing a market approach valuation. Since the transactions are not likely to be on the effective valuation date for the subject, the analyst should either explain adjustments for changes in market conditions between the transaction date and subject valuation effective date or explain why none are necessary.
There are many sources that valuation analysts use to locate sales of public companies. However, unlike currently traded stocks, there is not a single source that is totally comprehensive, so analysts often use several sources to search for transactions.
If one is relying on public company sales, it is preferable to use the actual SEC filing data rather than data summarized in secondary sources. Besides eliminating possible errors from secondary sources, original company filings usually provide more detail than secondary sources.
Data on sales of private companies usually are considerably more limited than data on sales of public companies. Unlike real estate transactions, for which data usually are required to be filed at the relevant government agency and made publicly available, there is no requirement for releasing any data on sales of privately owned companies. Therefore, unless the buyer is a public company and the purchase is of a sufficient size to require an SEC filing, the data services that collect private company transaction data usually gather them from the transaction intermediaries rather than directly from the companies sold. This usually means that the data for each individual transaction cannot be independently verified. While this is a limitation, the services have no reason to be biased. Furthermore, if valuing a private company or an interest in a private company, it often is considered more comparable to use private company rather than public company transactions as a starting point.
There are four major private sale transaction databases, all greatly expanded in recent years. These are listed and described briefly in the References section at the end of this chapter.
Over 12,000 operating companies are required to file financial data with the SEC. The major reports are the following:
• 10-K: annual report
• 10-Q: quarterly report
• 8-K: special events report
There are also thousands of public companies that are not required to file with the SEC because either their number of stockholders or the amount of their assets falls below the SEC levels that require filing.
Since May 1996, all companies required to file with the SEC must do so electronically on the Electronic Data Gathering and Retrieval (EDGAR) system. All documents filed in the EDGAR system are in the public domain and may be retrieved at no charge through the Internet. There are also commercial systems available at reasonable charges that provide enhanced capabilities to manipulate the data. The data provide the information to do all of the market multiple calculations discussed in this chapter.
Since public transactions occur daily, the price information for public companies should be as of the effective date of the subject company valuation. Usually, the public company fundamental data (sales, earnings, and so on) should be as close to the valuation date as possible, or as close to the latest date available for the subject company as possible.
As in the market approach in real estate appraisal, the market approach in business appraisal requires some “units of comparison.” In real estate, for example, price per square foot is a common unit of comparison. In business valuation, however, physical units of comparison (for example, the number of board feet per year of manufacturing capacity) are much less common. The units of comparison usually are in some form of dollar measurement of various levels of income producing capacity or asset values.
In other words, the objective is to observe the transaction price and compute the multiple of that price times some relevant fundamental variables, such as sales, earnings, gross cash flow, net asset value, or others. The fundamental variables used in the market approach are defined and illustrated in Chapter 14. This chapter will present an example of the market approach using some of the most commonly encountered market multiples.
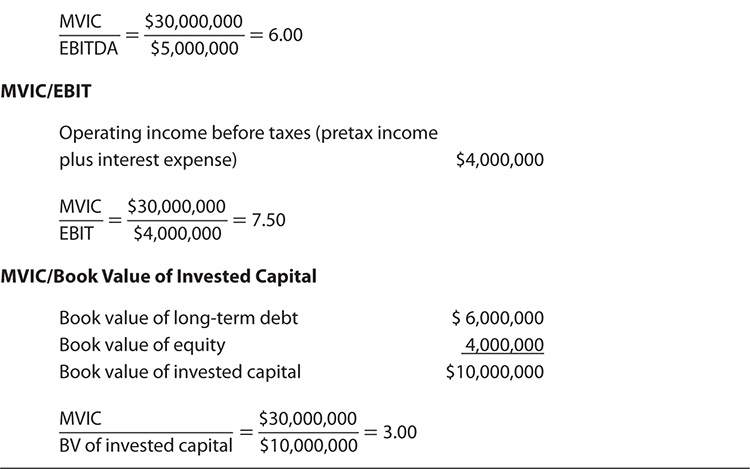
When valuing the entire invested capital of a company (that is, equity and debt), the numerator of the market multiple is the market value of invested capital (MVIC). This is defined as the market value of all the common and preferred stock and interest-bearing debt. Technically, invested capital would include only long-term debt, including the current portion. However, more often than not, short-term interest-bearing debt is also included. One reason for this is that it often is difficult or even impossible, at least for the guideline companies, to determine how much of the interest expense is attributable to long-term versus short-term debt.
Many valuation analysts and almost all investment bankers subtract the cash and cash equivalents when they are defining and computing the market value of invested capital. This is to focus on the valuations of companies’ operations without distortions of cash-rich versus cash-poor companies. If this is done for the guideline companies, then, of course, cash and equivalents for the subject company must be added back in after the multiples have been applied to estimate the company’s value.
Because of these two ambiguities in computing the market value of invested capital, it is essential that the report or analysis that uses the market value of invested capital define how it is computed.
Since the numerator includes the market value of all invested capital, the denominator used to create the multiple must include all the returns available to all the invested capital. Usually, this means adding all the interest paid in addition to all the returns available to common equity. If there is preferred stock, the dividends on the preferred stock must also be included.
To recap from Chapter 14, the denominators typically used for invested capital multiples include the following:
• Sales. This is the only income statement denominator that can logically be used in either invested capital or equity market multiples. It is a more relevant multiple for invested capital than for equity because the multiples of the market value of the equity to sales can be significantly distorted by differences in capital structures among the companies.
• Discretionary earnings. This is the gross cash flow before interest, taxes, and all compensation to one owner-manager. Typically this is used only for small businesses and professional practices with one key owner-operator.
• Earnings before interest, taxes, depreciation, and amortization (EBITDA). A multiple of the EBITDA is the market multiple most preferred by acquirers for valuing companies under the market approach. It represents gross cash flow before taxes, and it eliminates the possibly distorting effect of differing depreciation policies among companies.
• Earnings before interest and taxes (EBIT). This is the second most frequently used invested capital market multiple.
• Debt-free net income (DFNI). A multiple of the EBIT is a multiple based on an estimation of what the after-tax net income to invested capital would be if there were no interest-bearing debt.
• Debt-free cash flow (DFCF). This is a multiple based on an estimate of what the after-tax gross cash flow available to invested capital would be if there were no interest-bearing debt.
• Book value of invested capital. When this multiple is used, it may refer to the total book value (BV) or only include the tangible book value. Intangibles usually are eliminated because the different methods of acquiring intangibles and accounting for them can distort comparisons between companies.
• Adjusted book value of invested capital. In some cases, this multiple can be used if it is possible to adjust values of major assets to market value for both the subject and guideline companies. Ideally, one would adjust all assets and liabilities to market value, but this may be impractical in most cases.
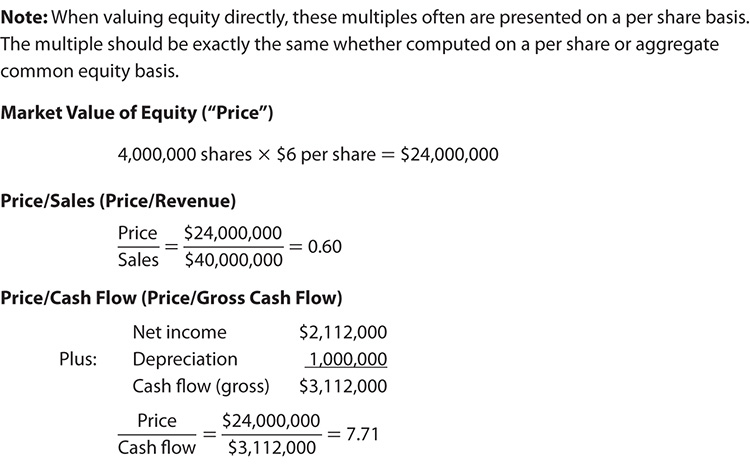
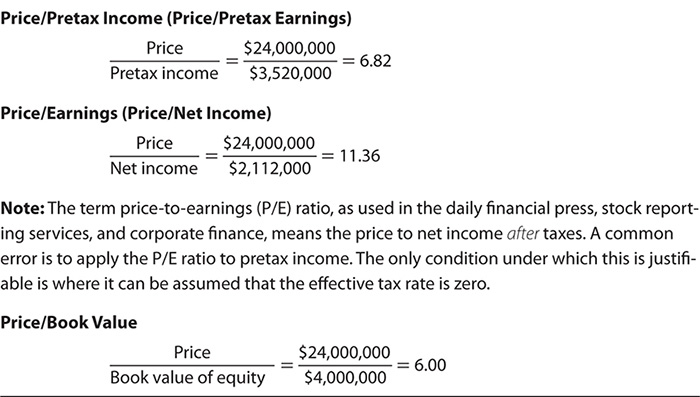
When valuing equity directly, the numerator of the market multiple is the market value of common equity, often simply referred to as “price.” This may be expressed on the basis of the aggregate value of the common stock outstanding or on the basis of a per share value. Of course, the financial fundamental in the denominator must be expressed on the same basis.
Since the numerator is the market value of common equity, the denominator used to create the multiple must consist of returns at the common equity level (after deductions for interest and preferred dividends). To recap from Chapter 14, the denominators typically used for equity valuation multiples include the following:
• Sales. One should be careful using a multiple of sales for an equity valuation because:
It may be distorted due to different degrees of leverage among companies.
Used by itself, there is an implicit assumption that the subject and guideline companies have similar cost structures, which may or may not be true. (If earnings data are available for the guideline companies, the price-to-sales multiple can, and should be, adjusted to reflect differences in the companies’ cost structures.)
It may be more appropriate for a control basis valuation than for a minority valuation on the theory that a control buyer may be able to bring the cost structure into line with industry averages after acquiring the customer base.
If sales is used in the denominator of an equity multiple (that is, stock price to sales), the level of the multiple should be justified by references to the relative return on sales between the subject and the guideline companies.
• Gross cash flow (often just called cash flow). The net income plus noncash charges is particularly helpful if the subject and guideline company have significantly different depreciation accounting policies.
• Pretax income (net income before taxes). Price-to-earnings ratios for public companies are reported on an after-tax basis. Be careful that the analyst has not used an after-tax P/E ratio and applied it to pretax earnings (a common error).
• Dividends or withdrawals. When valuing a controlling interest, the focus usually is on the capacity to pay dividends or withdrawals. However, when valuing a minority interest, the focus usually is on actual dividends or withdrawals since the minority owner cannot cause more to be paid.
• Book value of equity. Same comments apply as for the book value of invested capital.
• Adjusted book value. Same comments apply as for the adjusted book value of invested capital.
Unless there is some special reason, balance sheet data normally should be the latest available as of the valuation date. However, if using guideline public company data, there usually are many options as to the possible time periods for income data:
• Latest fiscal year
• Latest 12 months
• Some number of years’ simple average (such as 3, 5, 7, or 10 years, with 5 years the most common)
• Some number of years’ weighted average (usually weighting the latest years based more on the theory that the most current results should be the most representative of future expectations)
• Estimates for the coming year (available for earnings, but generally not for other income variables, for several thousand public companies)
It is important that the time periods for which the guideline public company data are computed are the same as those used for the subject company. If the subject company had drastic changes in its operations (such as major new or discontinued product lines), it may be appropriate to go back only as far as the latest major change. The reviewer should be satisfied that the rationale for the time period or periods chosen makes sense in terms of developing a reasonable value for the subject by reference to the guideline companies.
If one is using sales of private companies for guideline multiples, usually only the latest year’s data prior to the private company sale are available. While this is a limitation, it is often the case that the private companies sold were much more comparable to the subject than any public companies that may exist.
One succinct quote summarizes the essence of the key characteristic that should be present in a guideline company:
Do the underlying economics driving this comparable company match those that drive our company?2
In Revenue Ruling 59-60, the Internal Revenue Service (one of the strongest proponents of the guideline public company method) makes the following observation:
Although the only restrictive requirement as to comparable corporations specified in the statute is that their lines of business be the same or similar, … it is obvious that consideration must be given to other relevant factors in order that the most valid comparison possible will be obtained.3
The most obvious criterion for comparability is the line of business. The next important criterion is (depending on circumstances) probably the markets served. For example, in valuing a manufacturer of electrical controls for sawmills, the most important criterion might not be manufacturers of electrical controls but manufacturers of equipment used in the forest products industry. In Estate of Gallo4 (E.&J.Gallo Winery), in the absence of wine producers, appraisers on both sides expanded the line of business criteria to include brewers, distillers, soft-drink bottlers, and major consumer brand agricultural food producers. The tax court accepted this procedure.
Other criteria may include the following:
• Size
• Comparability of earnings patterns
• Position in industry
• Capital structure
• Maturity of company
One thing that all the selection criteria have in common is that they attempt to identify companies that are subject to the same risk factors as the subject company.
Once in a while the analyst has the luxury of lots of available guideline companies and can narrow the selection down to a few that are the most similar. More often it is necessary to broaden the criteria.
As noted earlier, it is useful to the reader of the valuation report if the appraiser states the criteria used and demonstrates that all companies that met the criteria were used, or if not, why certain ones that would appear to meet the criteria were rejected.
The more detailed and reliable the data for each company and the more similar the guideline companies are to the subject company, the fewer companies are needed. With public company data or with detailed private company data, analysts usually are comfortable with five to seven companies and sometimes as few as three.
However, in Estate of Hall5 (Hallmark greeting cards), the tax court rejected a valuation based entirely on the only other good public company at the time, American Greetings, and accepted the analysis of a broad group of high market share consumer goods, such as Parker Pens. If there is only one excellent guideline company, the analyst certainly should use it, but generally he or she should not rely on it entirely.
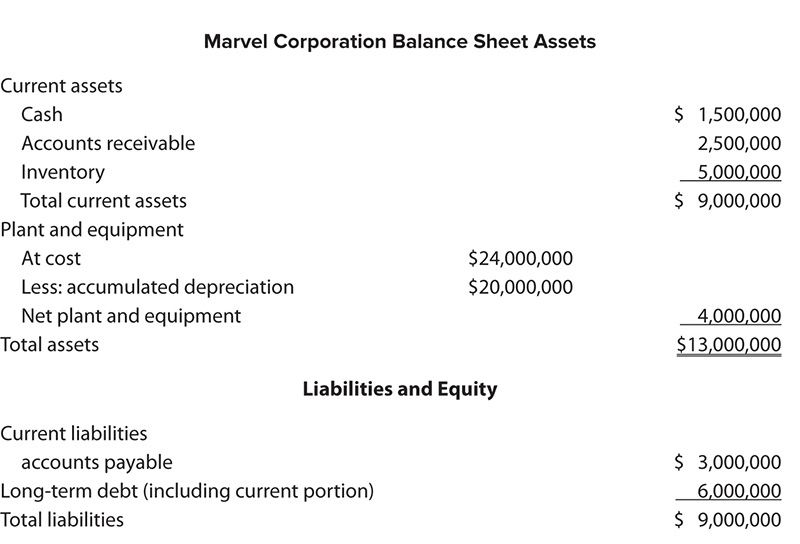
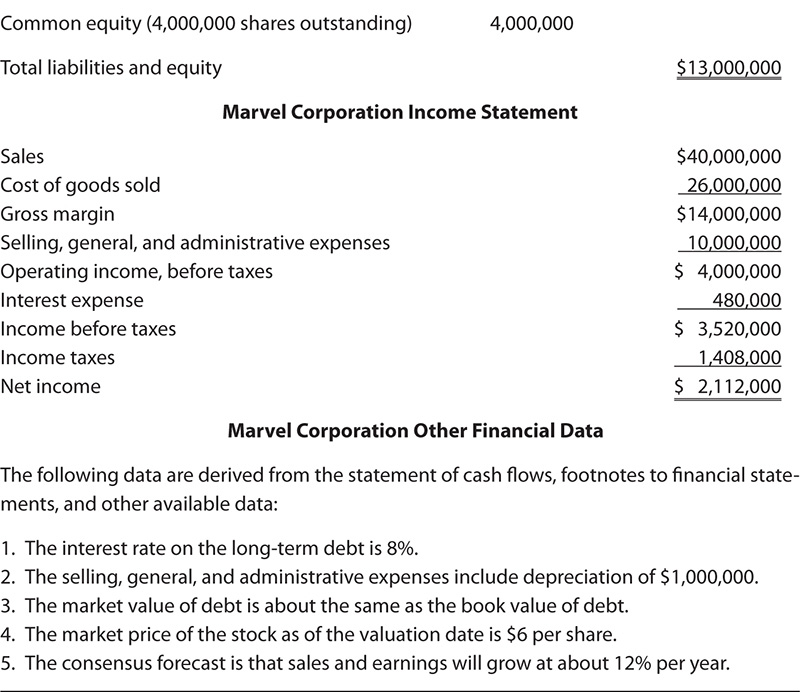
Exhibit 16.2 shows financial data for Marvel Corporation, selected as a guideline public company. Exhibit 16.3 develops four invested capital multiples for Marvel Corporation, using the information from Exhibit 16.2. Exhibit 16.4 develops five equity valuation multiples for Marvel Corporation, also using the information from Exhibit 16.2.
Marvel Corporation Financial Data
Marvel Corporation Invested Capital Valuation Multiples
Marvel Corporation Common Equity Valuation Multiples
The appraiser will have developed valuation multiples for several guideline companies in the same manner as illustrated previously for the Marvel Corporation. For each variable, the appraiser must select a multiple to apply to the subject company’s counterpart financial variable. An important step in evaluating the work of the appraiser is to evaluate how the multiple to be applied to each subject company financial variable was selected.
A multiple in the market approach is like a capitalization rate in the income approach. A multiple is actually the reciprocal of a capitalization rate. That is, 1 divided by the multiple equals the capitalization rate. Conversely, 1 divided by the capitalization rate equals the multiple.
To illustrate, assume the following:

To compute the guideline company price-to-earnings multiple, one divides the price by the earnings:
Formula 16.1
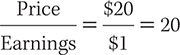
To convert the P/E multiple to a capitalization rate applicable to net income, one divides 1 by the P/E multiple:
Formula 16.2
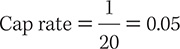
To convert the capitalization rate to a multiple, one divides 1 by the capitalization rate:
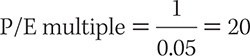
Multiplying by the P/E multiple or dividing by the capitalization rate should lead to the same result. For instance, if earnings equal $10 million, the value of the company will be $10 × 20 = $200 million, or $10/0.05 = $200 million.
The level of the multiple depends largely on two factors: expected growth and risk. In the income approach, the respective factors of risk and expected growth were quantified individually. However, in the market approach, multiples for company variables are observed in the market—that is, computed from market transaction data—and it is not possible to determine exactly how much any given company’s multiple for any variable was influenced by expected growth and how much by perceived risk. Comparative analysis between the guideline and subject companies cannot separate these factors completely, but it can give some useful clues.
Each multiple selected should be based on comparative analysis between the subject company and the guideline companies. This usually involves some combination of quantitative and qualitative analysis:
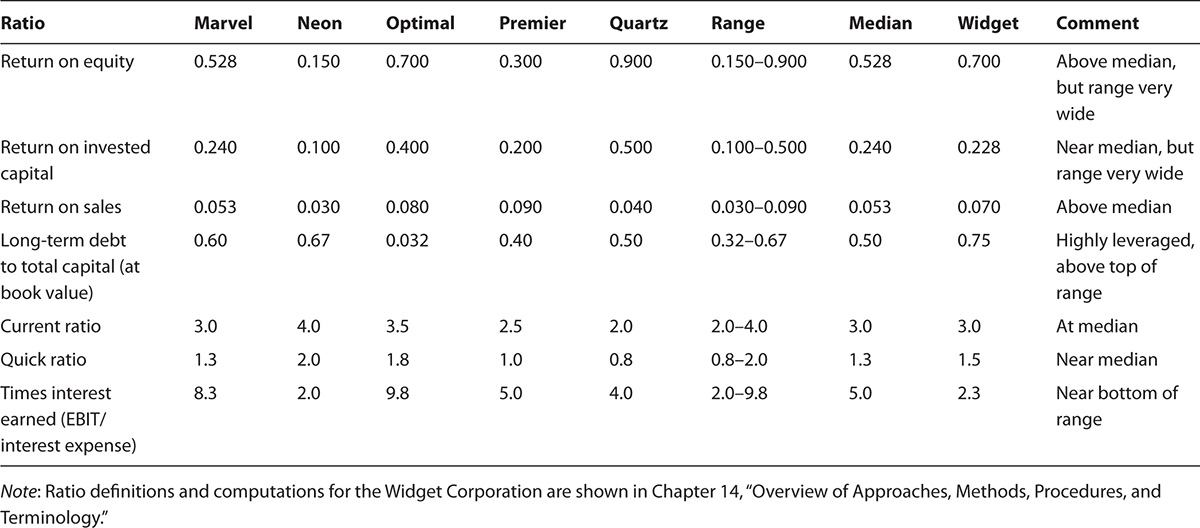
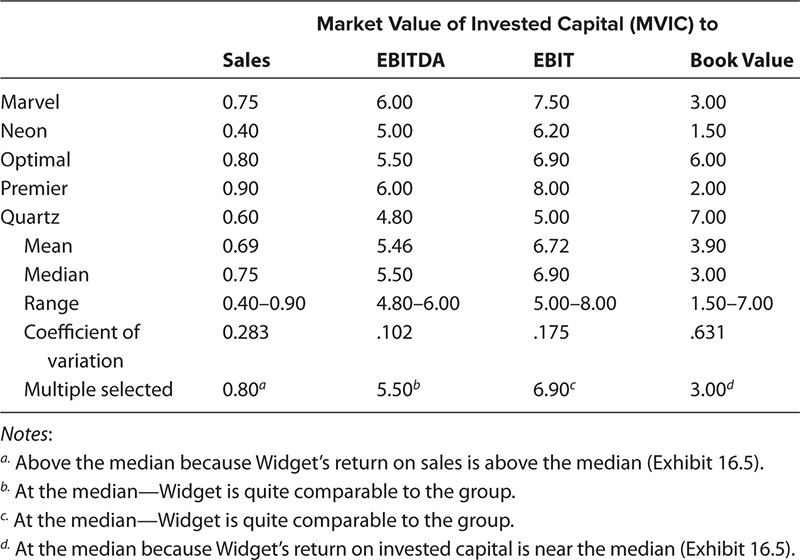
• Quantitative analysis. Exhibit 16.5 is a somewhat abbreviated example of typical comparative quantitative analysis.
Widget Corporation and Guideline Companies Comparative Financial Analysis
• Qualitative analysis. Most of the qualitative factors the analyst would consider are those that bear on assessing risk. Just as higher risk requires a higher discount rate or capitalization rate in the income approach, higher risk augers for lower multiples in the market approach. Some of the common comparative qualitative factors to consider include the following:
Depth of management
Concentration versus breadth of customer base
Concentration versus breadth of product or service base
Concentration versus breadth of geographical operations
Comparative cost structure (Make sure, however, that the analyst has not double-counted this both here and in the quantitative analysis.)
Other effects of difference in size, such as buying power, supplier dependence, affordability of advertising, and similar factors6
Having done a careful comparative analysis, the expert may conclude the subject company is so comparable to the average of the guideline companies that every multiple for every variable should be the median as observed among the guideline companies. If so, the expert should say so (not just apply median or average multiples without comment). More often than not, however, based on the comparative analysis, the expert will differentiate the subject from the guideline companies to result in a departure from average multiples for one or more variables. Reasons for selection of each multiple should be noted.
In some cases, the comparative financial analysis may indicate that the subject company is most like one, two, or a few of the guideline companies. In that case, the analyst may choose multiples close to those of the companies that appear to be more comparable to the subject than others.
We noted earlier that expected growth and risk are the two most important determinants of what multiple should be chosen for the subject company relative to the guideline companies, at least with respect to many of the variables. For example, higher leverage and lower coverage of interest obligations would be indications of higher risk.
These differences between the subject and guideline companies may lead to reductions of average multiples, the differentials chosen are sometimes referred to as fundamental discounts.
However, criteria for the selection of multiples may be influenced by factors other than just expected growth and risk. For example, price-to-sales multiples are heavily influenced by the return on sales. This is only logical since a company that earns more per dollar of sales is likely to sell for more per dollar of sales. Similarly, the return on invested capital and the return on equity influence the MVIC to book value of invested capital and the price to book value of equity valuation multiples. This also is logical because a company that earns more per dollar of book value is likely to sell for more per dollar of book value. Therefore, for example, a company with a very low return on equity may be operating very conservatively with a low degree of risk and deserve higher than average multiples for some or all income variables but a below average price-to-book value ratio.
Some valuation multiples are clearly more important for some industries than for others. For example, the values of financial assets are very important for valuing financial institutions, whereas the asset values may have very little relevance for most service businesses and professional practices.
One clue to the relative importance of different valuation multiples in any given industry is the degree of central tendency versus dispersion of the multiples observed in the market for that industry. If multiples for a certain variable cluster in a narrow range, that tends to indicate that pricing of companies in that industry tends to depend more on that financial variable than on others. On the other hand, a very wide dispersion among observed multiples suggests that the particular multiple is not very important in that industry.
On the other hand, multiples with wide dispersions can be used if they can be explained. For example, a wide dispersion of price to book value often reflects a wide dispersion of return on equity. In this case, the multiple can be used if it reflects the level of the subject’s return on equity relative to the guideline companies.
Another judgmental factor is the available data. If data to compute certain valuation multiples are not available for several companies among those chosen, the analyst may choose to put less weight on that valuation measure even if it might be considered more important if it were available for more companies.
Also, multiples for certain variables may be accorded little or no weight if they appear to be not very meaningful. For example, if an industry had such a bad year that earnings tended to be minimal, resulting in atypical P/E ratios, the P/E ratio on that year’s earnings may be accorded no weight.
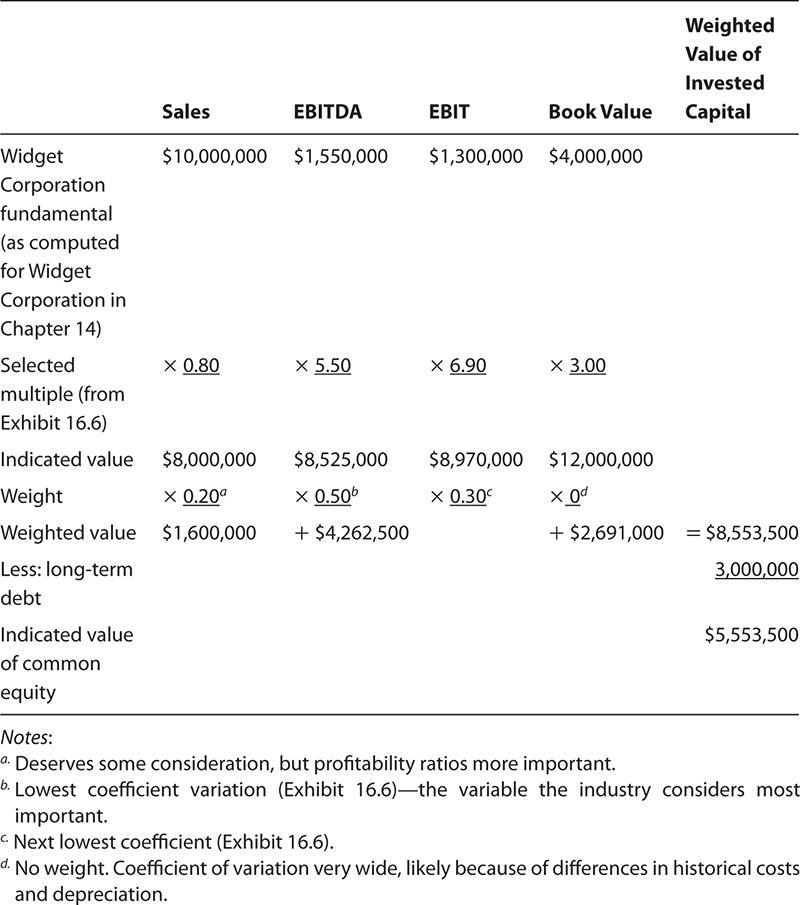
Using the data from Exhibits 16.3 through 16.5, Exhibit 16.6 develops invested capital multiples to apply to Widget Corporation. Exhibit 16.7 develops an indicated value for the Widget Corporation using the invested capital procedure. Exhibit 16.8 develops equity multiples to apply to Widget Corporation.
Widget Corporation Guideline Company Invested Capital Multiples
Widget Corporation Valuation Using Invested Capital Multiples
Widget Corporation Guideline Company Equity Multiples
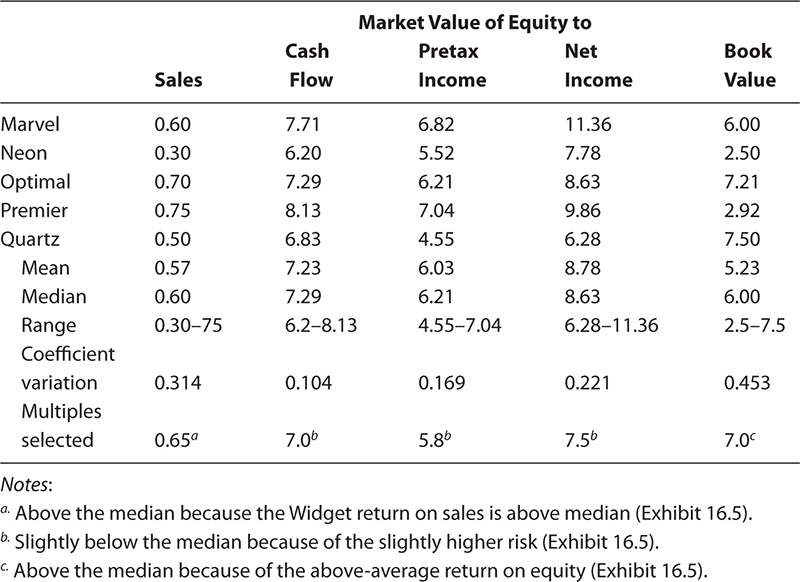
Exhibit 16.9 develops an indicated value directly for Widget Corporation’s equity. In this illustration, the rationale for the analyst’s various choices is indicated briefly in the footnotes to the tables. In most reports, the rationale would be explained more fully in the text, exploring underlying relationships and explaining reasons for the appraiser’s judgment. For example, while dispersion of observed multiples for the guideline companies is a useful quantitative observation, the analytical reasoning and judgment applied may be more important in assigning weights to variables in many cases.
Widget Corporation Valuation Using Equity Multiples
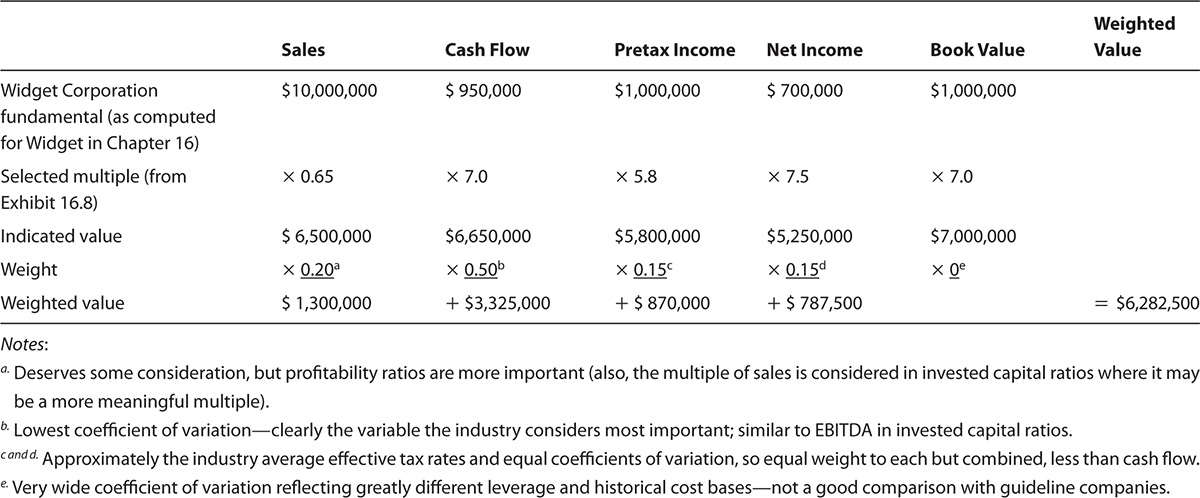
The various multiples within each group (invested capital and equity) produced similar results, but the direct equity procedure produced significantly higher values. The reason is that the company has benefited from a considerably higher degree of leverage than the guideline companies. Perhaps this risk should be reflected by equity multiples having greater discounts from the guideline medians than were actually used. The analyst in this case was cautiously optimistic and valued the equity at $5.7 million on the basis of a continued good outlook for the company. This value was based on an equal weighting of the two indications of value from the equity and the invested capital procedures.
In the following sections, we discuss the impact of considering prior transactions, offers to buy, and buy-sell agreements on the market approach because they sometimes provide some market evidence of value, and to some extent, they may be analyzed using some of the methods in the market approach.
Whether considering a transaction, an offer, or an agreement, the first question is whether the indication of value it represented was negotiated on an arm’s-length basis.
If the negotiation was among unrelated parties, it usually is assumed to be at arm’s length. Even among related parties, investigation may lead to the conclusion that there was an arm’s-length negotiation, but ascertaining this may be problematic. If the degree of arm’s-length negotiation cannot be ascertained, a valuation analyst may make a judgment as to whether or not it represented the fair market value at the time, in which case one can conclude that the parameters are controlling or at least useful guidance for valuation in the current transaction.
If reasonably arm’s length, the prior transactions may be one of the best guides to market value. Such transactions may include the following:
• A prior purchase or sale of the entire company
• Sales of minority ownership interests
• Acquisitions of subsidiary companies by the subject company
Any such transactions can be analyzed to determine the valuation multiples discussed in this chapter that the transactions represented at the time. The relevance of the actual transaction should be judged based on the time since the transaction and the changes to the company, industry, and economy. Adjustments to the actual multiples should be made if appropriate based on changes in market conditions.
If the company received a bona fide offer to buy, it can be analyzed in the same way as a prior transaction. Such bona fide offers that can be used in this manner do occur, but they are rare and should be thoroughly investigated.
Inquiries about buying companies typically don’t reach the stage of a bona fide offer that is never consummated. Even if an offer appears bona fide on the surface, inquiries should be made regarding escape clauses and prospective price changes based on due diligence and whether the buyer was legitimately willing and able to complete the transaction.
One of the most frequent controversies is the extent to which an existing buy-sell agreement should control or influence the value for any given transaction. This may ultimately be a legal determination, based on the purpose of the appraisal. For example, the buy-sell value may not be controlling for estate taxes if it fails to meet certain criteria, even though it is binding on the estate. In marital dissolutions, most courts have great discretion as to how much weight, if any, to accord the buy-sell agreement. One needs to refer to pertinent case law.
In cases determining fair value for dissenting stockholder and minority oppression suits, courts tend to look at income value, asset value, and market value. In some cases, what they consider market value may be based only on past transactions.
If this is the case, then the multiples of income statement variables derived from the guideline public company method would be subsumed under the income value, and multiples of asset variables would be considered under the asset value.
Fishman, Jay, et al. 2015. “Valuation Methods Based on Comparative Company Data.” In PPC’s Guide to Business Valuations. Ft. Worth, TX: Practioners Publishing Company, pp. 6-1 to 6-61.
Hitchner, James R. 2011. Financial Valuation: Applications and Models, 3rd ed. Hoboken, NJ: Wiley.
Pratt, Shannon P., and Alina V. Niculita. 2007. “Market Approach: Guideline Publicly Traded Company Method” and “Market Approach: Guideline Merged and Acquired Company Method.” In Valuing a Business, 5th ed. New York: McGraw_Hill, pp. 261–330. Both chapters include a bibliography.
Trugman, Gary. 2003. “Guideline Public Company Method-Control or Minority Value?” Shannon Pratt’s Business Valuation Update, December.
Bizcomps, Post Office Box 97757, Las Vegas, NV 89193. (858) 457-0366. Provides price-to-sales and price-to-discretionary earnings ratios; average transactions over $400,000. Available online at www.BVResources.com.
Done Deals, Thomson PPC, Post Office Box 966, Fort Worth, TX 76101-0966. (800) 323-8724. Provides price-to-assets ratios, book value of equity figures, revenues, net income, and cash from operations; transactions $1 million to $1 billion, with about 79 percent of the selling companies’ being privately owned.
IBA Market Database, Institute of Business Appraisers, Post Office Box 17410, Plantation, FL 33318. (954) 584-1144. Provides price-to-sales and price-to-discretionary earnings ratios; mostly small businesses and professional practices.
Pratt’s Stats, Business Valuation Resources, 1000 SW Broadway, Suite 1200, Portland, OR 97205. (888) 287-8258. Provides six invested capital multiples already computed and information for most companies to compute all market valuation ratios discussed in this chapter; transaction sizes $50,000 to $16 billion. Available online at www.BVResources.com.
Public company data fall into two categories, each of which has readily available sources of information far too extensive to list here:
• Publicly traded securities. There are over 20,000 publicly traded operating companies, the majority of which report data electronically to the Securities and Exchange Commission via the Electronic Data Gathering and Retrieval (EDGAR) system. This is accessible for free to the public. In addition, there are many services that publish summaries of the data filed, both electronically and in print, including Public Stats by Business Valuation Resources, Compustat and other Standard & Poor’s products, Factiva, Mergent (previously Moody’s), and Thomson Financial.
• Acquisitions of public companies. Several hundred public companies are acquired or “go private” every year. They are required to file the details of the transactions with the SEC, and those filings are also available for free to the public through EDGAR. In addition, many services publish summaries of such transaction data, including Mergerstat’s FactSet, Business Valuation Resources’ Mergerstate/BVU’s Control Premium Study, and Thomson Financial’s SDC Platinum. Details of the many information sources for publicly traded company data, public company acquisition, and going-private data are available in the Business Valuation Directory, published annually by Business Valuation Resources (BVR).