4
Kinetic Models of Biochemical Networks: Introduction
- 4.1 Reaction Kinetics and Thermodynamics
- 4.2 Metabolic Control Analysis
- Exercises
- References
- Further Reading
4.1 Reaction Kinetics and Thermodynamics
4.1.1 Kinetic Modeling of Enzymatic Reactions
Deterministic kinetic modeling of individual biochemical reactions has a long history. The Michaelis–Menten model for the rate of an irreversible one-substrate reaction is an integral part of biochemistry and has recently celebrated its centenary. The  value is a major characteristic of the interaction between enzyme and substrate. Biochemical reactions are catalyzed by enzymes, that is, specific proteins or ribonucleic acids, which often function in complex with cofactors. They have a catalytic center, are usually highly specific, and remain unchanged by the reaction. One enzyme molecule can catalyze thousands of reactions per second (this so-called turnover number ranges from
  to
to  ). Enzyme catalysis leads to a rate acceleration of about
  up to
up to  -fold compared to the noncatalyzed, spontaneous reaction.
The basic quantities are the concentration S of a substance S, that is, the number n of molecules (or, alternatively, moles) of this substance per volume V, and the rate v of a reaction, that is, the change of concentration S per time t. This type of modeling is macroscopic and phenomenological, compared to the microscopic approach, where single molecules and their interactions are considered. Chemical and biochemical kinetics rely on the assumption that the reaction rate v at a certain point in time and space can be expressed as a unique function of the concentrations of all substances at this point in time and space. Classical enzyme kinetics assumes for sake of simplicity a spatial homogeneity (the “well-stirred” test tube) and no direct dependency of the rate on time:

In more advanced modeling approaches paving the way for whole cell modeling, spatial inhomogeneities are taken into account. Spatial modeling pays tribute to the fact that many components are membrane bound and that cellular structures hinder the free movement of molecules. But, in most cases one can assume that diffusion is rapid enough to allow for an even distribution of all substances in space.
4.1.2 The Law of Mass Action
Biochemical kinetics is based on the mass action law, introduced by Guldberg and Waage in the nineteenth century [1–3]. It states that the reaction rate is proportional to the probability of a collision of the reactants. This probability is in turn proportional to the concentration of reactants to the power of the molecularity, which is the number in which the molecule species enter the reaction. For a simple reaction such as
the reaction rate reads
where  is the net rate,
  and
and  are the rates of the forward and backward reactions, respectively, and
  and
and  are the kinetic or rate constants, that is, the respective proportionality factors.
The molecularity is 1 for S1 and S2 and 2 for P. If we measure the concentration in moles per liter ( or M) and the time in seconds (s), then the rate has the unit
  . Accordingly, the rate constants for bimolecular reactions have the unit
  . Rate constants for monomolecular reactions have the dimension
  .
.
The general mass action rate law for a reaction transforming  substrates with concentrations Si into
  products with concentrations Pj reads
where ni and nj denote the respective molecularities of Si and Pj in this reaction.
The equilibrium constant  (we will also use the simpler symbol q) characterizes the ratio of substrate and product concentrations in equilibrium (
 and
and  ), that is, the state where the thermodynamic affinity vanishes and where the forward and backward rates become equal. The rate constants are related to
  in the following way:
The relation between the thermodynamic and the kinetic description of biochemical reactions will be outlined in Section 4.1.3.
The equilibrium constant for the reaction given in Eq. (4.2) is  . The dynamics of the concentrations far from equilibrium is described by the ODEs

The time course of  and P is obtained by integration of these ODEs (see Section 15.2).
4.1.3 Reaction Thermodynamics
Biochemical reactions in isolation or as part of a larger reaction network are governed by the laws of thermodynamics. This means that they cannot create or destroy energy, they can only convert it or store it in chemical bonds or release it from there. An important purpose of metabolism is to extract energy from nutrients, which is necessary for the synthesis of molecules, growth, and proliferation. We distinguish between energy-supplying reactions, energy-demanding reactions, and energetically neutral reactions. The principles of reversible and irreversible thermodynamics and their application to chemical reactions allow understanding of energy circulation in the cell.
A biochemical process is characterized by the direction of the reaction, by whether it occurs spontaneously or not, and by the position of the equilibrium. The first law of thermodynamics, that is, the law of energy conservation, tells us that the total energy of a closed system remains constant during any process. The second law of thermodynamics states that a process occurs spontaneously only if it increases the total entropy of the system. Unfortunately, entropy is usually not directly measurable. A more suitable measure is the Gibbs free energy G, which is the energy capable of carrying out work under isotherm–isobar conditions, that is, at constant temperature and constant pressure. The change of the Gibbs free energy is given as

where  is the change in enthalpy,
  is the change in entropy, and T is the absolute temperature in Kelvin.
  is a measure for the driving force, the spontaneity of a chemical reaction. The reaction proceeds spontaneous under release of energy, if
  (exergonic process). If
  , then the reaction is energetically not favorable and will not occur spontaneously (endergonic process).
  implies that the system has reached its equilibrium. Endergonic reactions may proceed if they obtain energy from a strictly exergonic reaction by energetic coupling. In tables, Gibbs free energy is usually given for standard conditions (
 ), that is, for a concentration of the reaction partners of 1 M, a temperature of
  , and, for gaseous reactions, a pressure of
  . The unit is kJ mol−1. Gibbs free energy differences satisfy a set of relations as follows. The Gibbs free energy difference for a reaction can be calculated from the balance of free energies of formation of its products and substrates:

The enzyme cannot change the Gibbs free energies of the substrates and products of a reaction, neither their difference, but it changes the way the reaction proceeds microscopically, the so-called reaction path, thereby lowering the activation energy for the reaction. The transition state theory explains this as follows. During the course of a reaction, the metabolites must pass one or more transition states of maximal free energy, in which bonds are solved or newly formed. The transition state is unstable; the respective molecule configuration is called an activated complex. It has a lifetime of around one molecule vibration, 10−14–10−13 s, and it can hardly be experimentally verified. The difference  of Gibbs free energy between the reactants and the activated complex determines the dynamics of a reaction: the higher this difference, the lower the probability that the molecules may pass this barrier and the lower the rate of the reaction. The value of
  depends on the type of altered bonds, on steric, electronic, or hydrophobic demands, and on temperature.
Figure 4.2 presents a simplified view of the reaction course of the noncatalyzed reaction and with an enzyme. The substrate and the product are situated in local minima of the free energy; the active complex is assigned to the local maximum. The Gibbs free energy difference  is proportional to the logarithm of the equilibrium constant
  of the respective reaction:
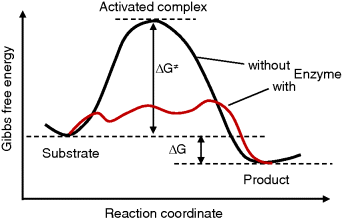
Figure 4.2 Change of Gibbs free energy along the course of a reaction. The substrate and the product are situated in local minima of the free energy; the active complex is assigned to the local maximum. The enzyme may change the reaction path and thereby lower the barrier of Gibbs free energy.
where R is the gas constant,  . The value of
  corresponds to the kinetic constant
  of the forward reaction (Eqs. (4.3)–(4.5)) by
  , while
  is related to the rate constant
  of the backward reaction.
The interaction of the reactants with an enzyme may alter the reaction path and, thereby, lead to lower values of  as well as higher values of the kinetic constants. However, the enzyme will not change the equilibrium constant of the reaction. The Gibbs free energy may assume several local minima and maxima along the path of reaction. They are related to unstable intermediary complexes. Values for the difference of free energy for some biologically important reactions are given in Table 4.1. Note that the free energy differences always refer to specific standard concentrations.
| Reaction |  /(kJ mol−1) /(kJ mol−1) |
| 2 H2 + O2 → 2 H2O | −474 |
| 2 H2O2 → 2 H2O + O2 | −99 |
| PPi + H20 → 2 Pi | −33.49 |
| ATP + H20 → ADP + Pi | −30.56 |
| Glucose-6-phosphate + H20 → Glucose + Pi | −13.82 |
| Glucose + Pi → Glucose-6-phosphate + H20 | +13.82 |
| Glucose-1-phosphate → Glucose-6-phosphate | −7.12 |
| Glucose-6-phosphate → Fructose-6-phosphate | +1.67 |
| Glucose + 6 O2 → 6 CO2 + 6 H20 | −2890 |
| a Source: ZITAT: Lehninger, A.L. Biochemistry, 2nd edition, New York, Worth, 1975, p. 397. | |
A biochemical reaction is reversible if it may proceed in both directions, leading to a positive or negative sign of the rate v. The actual direction depends on the current reactant concentrations. In theory, every reaction should be reversible. In practice, we can consider many reactions as irreversible, since (i) reactants in cellular environment cannot assume any concentration, (ii) coupling of a chemical conversion to ATP consumption leads to a severe drop in free energy and therefore makes a reaction reversal energetically unfavorable, and (iii) for compound destruction, such as protein degradation, reversal by chance is extremely unlikely.
The detailed consideration of enzyme mechanisms by applying the mass action law for the single events has led to a number of standard kinetic descriptions, which will be explained in the following. For further information on equilibrium thermodynamics in reaction systems also see Section 15.6.
4.1.4 Michaelis–Menten Kinetics
Brown [4] proposed an enzymatic mechanism for invertase, catalyzing the cleavage of saccharose to glucose and fructose. This mechanism holds in general for all one-substrate reactions without backward reaction and without effectors, such as
It comprises a reversible formation of an enzyme–substrate complex ES from the free enzyme E and the substrate S and an irreversible release of the product P. The ODE system for the dynamics of this reaction reads
The reaction rate is equal to the negative decay rate of the substrate as well as to the rate of product formation:
This ODE system (Eqs. (4.12)–(4.16)) cannot be solved analytically. Figure 4.3 shows numerical solutions for different parameter sets.
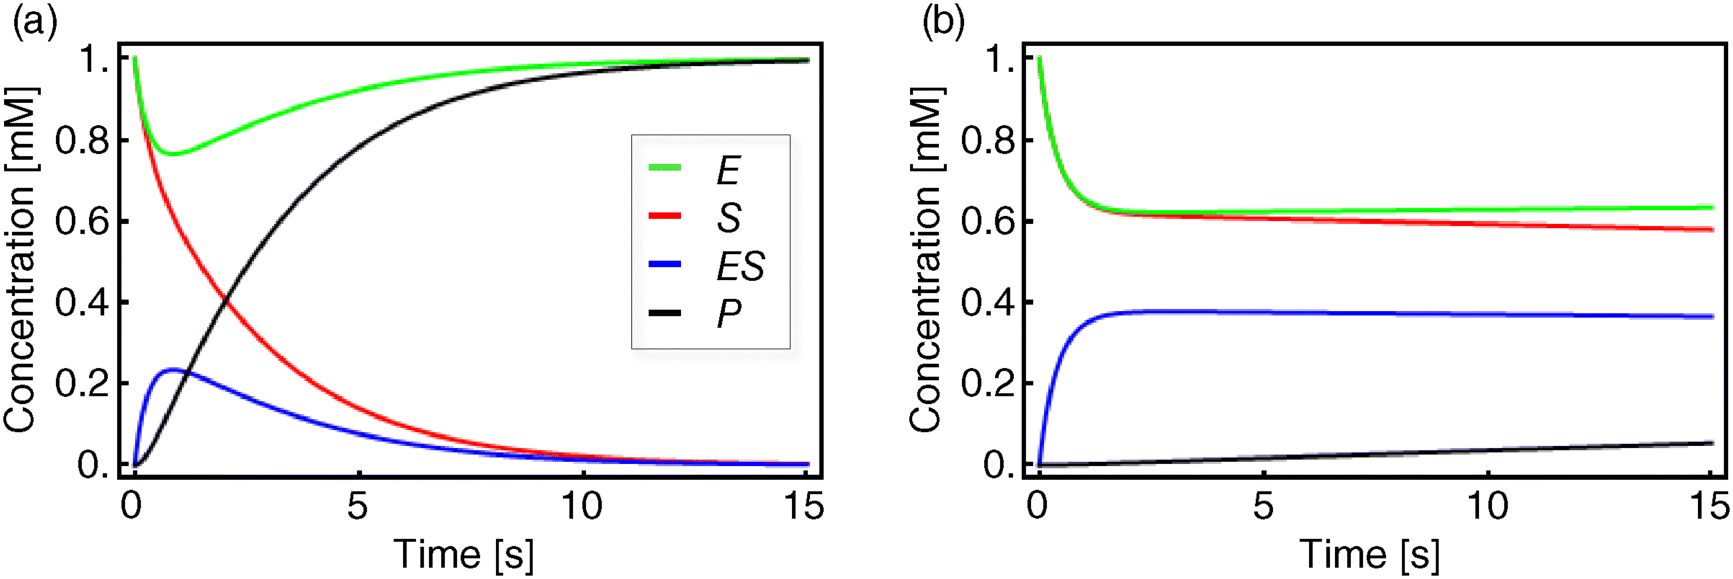
Figure 4.3 Temporal evolution of the equation system (4.12)–(4.15). Shown are S (red), E (green), ES (blue), and P (black). The initial concentrations are in both panels  and
and  . Parameter values:
  ,
,  , and either
  (a) or
  (b).
(b).
Different assumptions have been used to simplify this system in a satisfactory way. Michaelis and Menten [5] considered a quasi-equilibrium between the free enzyme and the enzyme–substrate complex, meaning that the reversible conversion of E and S to ES is much faster than the decomposition of ES into E and P, or in terms of the kinetic constants, that is,
This is the situation as shown in Figure 4.3b.
Briggs and Haldane [6] assumed that during the course of reaction a state is reached where the concentration of the ES complex remains constant, the so-called quasi-steady state. This assumption is justified only if the initial substrate concentration is much larger than the enzyme concentration,  , otherwise such a state will never be reached. In mathematical terms, we obtain
In the following, we derive an expression for the reaction rate from the ODE system (4.12)–(4.15) and the quasi-steady-state assumption for ES. First, adding (Eqs. 4.13) and (4.14) results in
This expression shows that enzyme is neither produced nor consumed in this reaction; it may be free or part of the complex, but its total concentration remains constant. Introducing (4.19) into (4.13) under the steady-state assumption (4.18) yields

For the reaction rate, this gives
In enzyme kinetics, it is convention to present Eq. (4.21) in a simpler form, which is important in theory and practice
(Equation 4.22) is the expression for Michaelis–Menten kinetics. The parameters have the following meaning: the maximal velocity,

is the maximal rate that can be attained, when the enzyme is completely saturated with substrate. The Michaelis constant,

is equal to the substrate concentration that yields the half-maximal reaction rate. For the quasi-equilibrium assumption (Eq. (4.17)), it holds that  . The maximum velocity divided by the enzyme concentration (here
  ) is often called the turnover number,
  . The meaning of the parameters is illustrated in the plot of rate versus substrate concentration (Figure 4.4).
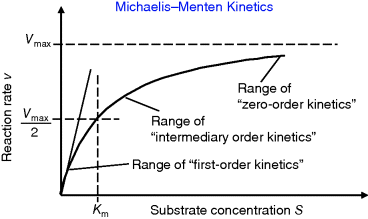
Figure 4.4 Dependence of reaction rate v on substrate concentration S in Michaelis–Menten kinetics.  denotes the maximal reaction rate that can be reached for large substrate concentration.
  is the substrate concentration that results in half-maximal reaction rate. For low substrate concentration, v increases almost linearly with S, while for high substrate concentrations v is almost independent of S.
4.1.4.1 How to Derive a Rate Equation
Below, we will present some enzyme kinetic standard examples. Individual mechanisms for your specific enzyme of interest may be more complicated or merely differ from these standards. Therefore, we summarize here the general way of deriving a rate equation.
- Draw a wiring diagram of all steps to consider (e.g., (Eq. (4.11)). It contains all substrates and products (S and P) and n free or bound enzyme species (E and ES).
- The right sides of the ODEs for the concentrations changes sum up the rates of all steps leading to or away from a certain substance (e.g., Eqs. (4.12)–(4.15)). The rates follow mass action kinetics (Eq. (4.3)).
- The sum of all enzyme-containing species is equal to the total enzyme concentration
 (the right side of all differential equations for enzyme species sums up to zero). This constitutes one equation.
 - The assumption of quasi-steady state for n − 1 enzyme species (i.e., setting the right sides of the respective ODEs equal to zero) together with (3) result in n algebraic equations for the concentrations of the n enzyme species.
- The reaction rate is equal to the rate of product formation (e.g., (Eq. (4.16)). Insert the respective concentrations of enzyme species resulting from (4).
4.1.4.2 Parameter Estimation and Linearization of the Michaelis–Menten Equation
To assess the values of the parameters  and
and  for an isolated enzyme, one measures the initial rate for different initial concentrations of the substrate. Since the rate is a nonlinear function of the substrate concentration, one has to determine the parameters by nonlinear regression. Another way is to transform Eq. (4.22) to a linear relation between variables and then apply linear regression.
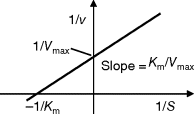
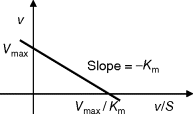
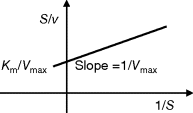
The advantage of the transformed equations is that one may read the parameter value more or less directly from the graph obtained by linear regression of the measurement data. In the Lineweaver–Burk plot [7] (Table 4.2), the values for  and
and  can be obtained from the intersections of the graph with the ordinate and the abscissa, respectively. The Lineweaver–Burk plot is also helpful to easily discriminate different types of inhibition (see below). The drawback of the transformed equations is that they may be sensitive to errors for small or high substrate concentrations or rates. Eadie and Hofstee [8] and Hanes and Woolf [9] have introduced other types of linearization to overcome this limitation.
Table 4.2 Different approaches for the linearization of Michaelis–Menten enzyme kinetics.
| Lineweaver–Burk | Eadie–Hofstee | Hanes–Woolf | |
| Transformed equation. |  |
 |
 |
| New variables |  , ,  |
 , ,  |
 , ,  |
| Graphical representation |
|
|
|
4.1.4.3 The Michaelis–Menten Equation for Reversible Reactions
In practice, many reactions are reversible. The enzyme may catalyze the reaction in both directions. Consider the following mechanism:

The product formation is given by

The respective rate equation reads

While the parameters  and
and  are the kinetic constants of the individual reaction steps, the phenomenological parameters
  and
and  denote the maximal velocity in forward or backward direction, respectively, under zero product or substrate concentration, and the phenomenological parameters
  and
and  denote the substrate or product concentration causing half-maximal forward or backward rate. They are related by the so-called Haldane relation in the following way [10]:
4.1.5 Regulation of Enzyme Activity by Effectors
Enzymes may immensely increase the rate of a reaction, but this is not their only function. Enzymes are involved in metabolic regulation in various ways. Their production and degradation is often adapted to the current requirements of the cell. Furthermore, they may be targets of effectors, both inhibitors and activators.
The effectors are small molecules, or proteins, or other compounds that influence the performance of the enzymatic reaction. The interaction of effector and enzyme changes the reaction rate. Such regulatory interactions that are crucial for the fine-tuning of metabolism will be considered here [11].
Basic types of inhibition are distinguished by the state, in which the enzyme may bind the effector (i.e., the free enzyme E, the enzyme–substrate complex ES, or both), and by the ability of different complexes to release the product. The general pattern of inhibition is schematically represented in Figure 4.5. The different types result, if some of the interactions may not occur.
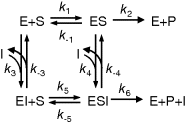
Figure 4.5 General scheme of inhibition in Michaelis–Menten kinetics. Reactions 1 and 2 belong to the standard scheme of Michaelis–Menten kinetics. Competitive inhibition is given, if in addition reaction 3 (and not reactions 4, 5, or 6) occurs. Uncompetitive inhibition involves reactions 1, 2, and 4, and noncompetitive inhibition comprises reactions 1, 2, 3, 4, and 5. Occurrence of reaction 6 indicates partial inhibition.
The rate equations are derived according to the following scheme:
- Consider binding equilibriums between compounds and their complexes:
Note that, if all reactions may occur, the Wegscheider condition [12] holds in the form
(4.30)
which means that the difference in the free energies between two compounds (e.g., E and ESI) is independent of the choice of the reaction path (here via ES or via EI).
- Take into account the moiety conservation for the total enzyme (include only those complexes that occur in the course of reaction):
- The reaction rate is equal to the rate of product formation
Equations (4.29)–(4.31) constitute four independent equations for the four unknown concentrations of E, ES, EI, and ESI. Their solution can be inserted into Eq. (4.32). The effect of the inhibitor depends on the concentrations of substrate and inhibitor and on the relative affinities to the enzyme. Table 4.3 lists the different types of inhibition for irreversible and reversible Michaelis–Menten kinetics together with the respective rate equations.
Table 4.3 Types of inhibition for irreversible and reversible Michaelis–Menten kineticsb.
| Name | Implementation | Equation – irreversible | Equation – reversible case | Characteristics |
| Competitive inhibition | I binds only to free E; P-release only from ES-complex  |
 |
 |
 changes, changes,  remains same. remains same.S and I compete for the binding place; high S may out compete I. |
| Uncompetitive Inhibition | I binds only to the ES-complex; P-release only from ES-complex  |
 |
 |
 and and  change, but their ratio remains same. S may not out compete I change, but their ratio remains same. S may not out compete I |
| Noncompetitive inhibition | I binds to E and ES; P-release only from ES , ,  |
 |
 |
 remains, remains,  changes. S may not out compete I changes. S may not out compete I |
| Mixed inhibition | I binds to E and ES; P-release only from ES  , ,  |
 |
 and and  change. change. : competitive-noncompetitive inhibition : competitive-noncompetitive inhibition : noncompetitive-uncompetitive inhibition : noncompetitive-uncompetitive inhibition | |
| Partial Inhibition | I may bind to E and ES; P-release from ES and ESI , ,  |
 |
 and and  change if change if  : activation instead of inhibition. : activation instead of inhibition. | |
b The following abbreviations are used:  , ,  , ,  , ,  . . |
||||
In the case of competitive inhibition, the inhibitor competes with the substrate for the binding site (or inhibits substrate binding by binding elsewhere to the enzyme) without being transformed itself. An example for this type is the inhibition of succinate dehydrogenase by malonate. The enzyme converts succinate to fumarate forming a double bond. Malonate has two carboxyl groups, like the proper substrates, and may bind to the enzyme, but the formation of a double bond cannot take place. Since substrates and inhibitor compete for the binding sites, a high concentration of one of them may displace the other one. For very high substrate concentrations, the same maximal velocity as without inhibitor is reached, but the effective  value is increased.
In the case of uncompetitive inhibition, the inhibitor binds only to the ES complex. The reason may be that the substrate binding caused a conformational change, which opened a new binding site. Since S and I do not compete for binding sites, an increase in the concentration of S cannot displace the inhibitor. In the presence of inhibitor, the original maximal rate cannot be reached (lower  ). For example, an inhibitor concentration of
  halves the
  value as well as
  . Uncompetitive inhibition occurs rarely for one-substrate reactions, but more frequently in the case of two substrates. One example is inhibition of arylsulphatase by hydracine.
Noncompetitive inhibition is present, if substrate binding to the enzyme does not alter the binding of the inhibitor. There must be different binding sites for substrate and inhibitor. In the classical case, the inhibitor has the same affinity to the enzyme with or without bound substrate. If the affinity changes, this is called mixed inhibition. A standard example is inhibition of chymotrypsin by H+-ions.
If the product may also be formed from the enzyme–substrate–inhibitor complex, the inhibition is only partial. For high rates of product release (high values of  ), this can even result in an activating instead of an inhibiting effect.
The general types of inhibition, competitive, uncompetitive, and noncompetitive inhibition, also apply for the reversible Michaelis–Menten mechanism. The respective rate equations are also listed in Table 4.3.
4.1.5.1 Substrate Inhibition
A common characteristic of enzymatic reaction is the increase of the reaction rate with increasing substrate concentration S up to the maximal velocity  . But in some cases, a decrease of the rate above a certain value of S is recorded. A possible reason is the binding of a further substrate molecule to the enzyme–substrate complex yielding the complex ESS that cannot form a product. This kind of inhibition is reversible if the second substrate can be released. The rate equation can be derived using the scheme of uncompetitive inhibition by replacing the inhibitor by another substrate. It reads
This expression has an optimum, that is, a maximal value of v, at

The dependence of v on S is shown in Figure 4.6. A typical example for substrate inhibition is the binding of two succinate molecules to malonate dehydrogenase, which possesses two binding pockets for the carboxyl group. This is schematically represented in Figure 4.6.
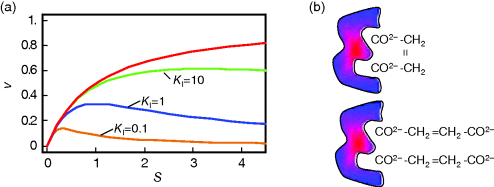
Figure 4.6 Substrate inhibition. (a) Plot of reaction rate v against substrate concentration S for an enzyme with substrate inhibition. The upper curve shows Michaelis–Menten kinetics without inhibition, the lower curves show kinetics for the indicated values of binding constant  . Parameter values:
  ,
,  . (b) Visualization of a possible mechanism for substrate inhibition: The enzyme (gray item) has two binding pockets to bind different parts of a substrate molecule (upper scheme). In case of high substrate concentration, two different molecules may enter the binding pockets, thereby preventing the specific reaction (lower scheme).
4.1.5.2 Binding of Ligands to Proteins
Every molecule that binds to a protein is a ligand, irrespective of whether it is subject of a reaction or not. Below we consider binding to monomer and oligomer proteins. In oligomers, there may be interactions between the binding sites on the subunits.
Consider binding of one ligand (S) to a protein (E) with only one binding site:

The binding constant  is given by

The reciprocal of  is the dissociation constant
  . The fractional saturation Y of the protein is determined by the number of subunits that have bound ligands, divided by the total number of subunits. The fractional saturation for one subunit is

The plot of Y versus S at constant total enzyme concentration is a hyperbola, like the plot of v versus S in the Michaelis–Menten kinetics (Eq. (4.22)). At a process where the binding of S to E is the first step followed by product release and where the initial concentration of S is much higher as the initial concentration of E, the rate is proportional to the concentration of ES and it holds

If the protein has several binding sites, then interactions may occur between these sites, that is, the affinity to further ligands may change after binding of one or more ligands. This phenomenon is called cooperativity. Positive or negative cooperativity denote increase or decrease in the affinity of the protein to a further ligand, respectively. Homotropic or heterotropic cooperativity denotes that the binding to a certain ligand influences the affinity of the protein to a further ligand of the same or another type, respectively.
4.1.5.3 Positive Homotropic Cooperativity and the Hill Equation
Consider a dimeric protein with two identical binding sites. The binding to the first ligand facilitates the binding to the second ligand.
where E is the monomer and E2 is the dimer. The fractional saturation is given by

If the affinity to the second ligand is strongly increased by binding to the first ligand, then  will react with S as soon as it is formed and the concentration of
  can be neglected. In the case of complete cooperativity, that is, every protein is either empty or fully bound, Eq. (4.39) reduces to

The binding constant reads

and the fractional saturation is

Generally, for a protein with n subunits it holds:
This is the general form of the Hill equation. To derive it, we assumed complete homotropic cooperativity. The plot of the fractional saturation Y versus substrate concentration S is a sigmoid curve with the inflection point at 1/KB. The quantity n (often “h” is used instead) is termed the Hill coefficient.
The derivation of this expression was based on experimental findings concerning the binding of oxygen to hemoglobin (Hb) [13,14]. In 1904, Bohr et al. found that the plot of the fractional saturation of Hb with oxygen against the oxygen partial pressure had a sigmoid shape. Hill (1909) explained this with interactions between the binding sites located at the hem subunits. At this time, it was already known that every subunit hem binds one molecule of oxygen. Hill assumed complete cooperativity and predicted an experimental Hill coefficient of 2.8. Today it is known that hemoglobin has four binding sites, but that the cooperativity is not complete. The sigmoid binding characteristic has the advantage that Hb binds strongly to oxygen in the lung with a high oxygen partial pressure while it can release O2 easily in the body with low oxygen partial pressure.
4.1.5.4 The Monod–Wyman–Changeux Model for Sigmoid Kinetics
The Monod model [15] explains sigmoid enzyme kinetics by taking into account the interaction of subunits of an enzyme. We will show here the main characteristics and assumptions of this kinetics. The full derivation is given in the web material. It uses the following assumptions: (i) the enzyme consists of n identical subunits, (ii) each subunit can assume an active (R) or an inactive (T) conformation, (iii) all subunits change their conformations at the same time (concerted change), and (iv) the equilibrium between the R and the T conformation is given by an allosteric constant

The binding constants for the active and inactive conformations are given by  and
and  , respectively. If substrate molecules can only bind to the active form, that is, if
  , the rate can be expressed as
where the first factor  corresponds to the Michaelis–Menten rate expression, while the second factor
  is a regulatory factor.
For  , the plot v versus S is hyperbola as in Michaelis–Menten kinetics. For
  , we obtain a sigmoid curve shifted to the right. A typical value for the allosteric constant is
  (Figure 4.7).

Figure 4.7 Model of Monod, Wyman, and Changeux: Dependence of the reaction rate on substrate concentration for different values of the allosteric constant L, according to Eq. (4.46). Parameters:  ,
,  ,
,  . The value of L is indicated at the curves. Obviously, increasing value of L causes stronger sigmoidity. The influence of activators or inhibitors (compare (Eq. (4.47)) is illustrated with the dotted line for
  and with the dashed line for
  (
( in both cases).
Up to now we considered in the model of Monod, Wyman, and Changeux only homotropic and positive effects. But this model is also well suited to explain the dependence of the reaction rate on activators and inhibitors. Activators A bind only to the active conformation and inhibitors I bind only to the inactive conformation. This shifts the equilibrium to the respective conformation. Effectively, the binding to effectors changes L:
where  and
and  denote binding constants. The interaction with effectors is a heterotropic effect. An activator weakens the sigmoidity, while an inhibitor strengthens it.
A typical example for an enzyme with sigmoid kinetics that can be described with the Monod model is the enzyme phosphofructokinase, which catalyzes the transformation of fructose-6-phosphate and ATP to fructose-1,6-bisphosphate. AMP, NH4, and K+ are activators, ATP is an inhibitor.
4.1.6 Generalized Mass Action Kinetics
Mass action kinetics (see Section 4.1.1) has experienced refinements in different ways. The fact that experimental results frequently do not show the linear dependence of rate on concentrations as assumed in mass action laws is acknowledged in power law kinetics used in the S-systems approach. Here, the rate reads
where the concentrations Si and rates vj are normalized to some standard value denoted by superscript 0, and gi,j is a real number instead of an integer as in Eq. (4.4). The normalization yields dimensionless quantities. The power law kinetics can be considered as a generalization of the mass action rate law. The exponent gi,j is equal to the concentration elasticities, that is, the scaled derivatives of rates with respect to substrate concentrations (see Section 4.3, (Eq. (4.107)). Substrates and effectors (their concentrations both denoted by Si) enter expression (4.48) in the same formal way, but the respective exponents gi,j will be different. The exponents gi,j will be positive for substrates and activators, but should assume a negative value for inhibitors.
4.1.7 Approximate Kinetic Formats
In metabolic modeling studies, approximate kinetic formats are used (for a recent review see Ref. [16]). They preassume that each reaction rate vj is proportional to the enzyme concentration Ej. The rates, enzyme concentrations, and substrate concentrations are normalized with respect to a references state, which is usually a steady state. This leads to the general expression

where ɛc is the matrix of concentration elasticities as explained in Section 4.3. One example is the so-called lin-log kinetics

where I is the  identity matrix. Another example is an approximation of the power-law kinetics
Approximative kinetics simplify the determination of model parameters and, especially, of concentration elasticities, since Eq. (4.51) as set of linear equations in the elasticity coefficients.
4.1.8 Convenience Kinetics and Modular Rate Laws
The convenience kinetics [17] has been introduced to ease parameter estimation and to have a kinetic mechanism, where all parameters are independent on each other and not related via the Haldane relation (Eq. (4.28)). It is a generalized form of Michaelis–Menten kinetics that covers all possible stoichiometries, and describes enzyme regulation by activators and inhibitors. For a reaction with stoichiometry

it reads
with enzyme concentration  and turnover rates
  and
and  . The regulatory prefactor
  is either 1 (in case of no regulation) or a product of terms
  or
or  for activators and
  for inhibitors. Activation constants KA and inhibition constants KI are measured in concentration units. M is the concentration of the modifier.
In analogy to Michaelis–Menten kinetics, Km values denote substrate concentrations, at which the reaction rate is half-maximal if the reaction products are absent; KI and KA values denote concentrations, at which the inhibitor or activator has its half-maximal effect. In this respect, many parameters in convenience kinetics are comparable to the kinetic constants measured in enzyme assays. This is important for parameter estimation (see Section 4.2).
To facilitate thermodynamic independence of the parameters, we introduce new system parameters that can be varied independently, without violating any thermodynamic constraints (see Section 4.1.1). For each reaction, we define the velocity constant  (geometric mean of the turnover rates in both directions). Given the equilibrium and velocity constants, the turnover rates can be written as
  . The equilibrium constants
  can be expressed by independent parameters such as the Gibbs free energies of formation: for each substance i, we define the dimensionless energy constant
  with Boltzmann's gas constant R = 8.314 J mol−1 K−1 and absolute temperature T. The equilibrium constants then satisfy
  .
.
In more general terms, modular rate laws are a family of reversible rate laws for reactions with arbitrary stoichiometries and various types of regulation, including mass-action, Michaelis–Menten, and uni–uni reversible Hill kinetics as special cases 20 385 728. There general form reads
where freg describes complete or partial regulation (e.g., by an inhibitor), T is the numerator (equivalently to the one as used in equation (4.53)), while the components of the denominator, D and Dreg, depend on reaction stoichiometry, selected rate law, allosteric regulation, and on the preferred model parameterization. Five versions of denominator have been introduced:
- Power-law modular rate law: D = 1 (such as mass action kinetics)
- Common modular rate law: as in Eq. (4.53)
- Simultaneous binding modular rate law:

- Direct binding modular rate law:

- Force-dependent modular rate law:

With a thermodynamically safe parameterization of these rate laws, parameter sets obtained by model fitting, sampling, or optimization are guaranteed to lead to consistent chemical equilibrium states, as demonstrated above for convenience kinetics.
4.2 Metabolic Control Analysis
In metabolic networks, the steady-state variables, that is, the fluxes and the metabolite concentrations, depend on the value of parameters such as enzyme concentrations, kinetic constants (like Michaelis constants and maximal activities), and other model specific parameters. The effect of perturbations, moreover, depends on the place of the perturbation. As an illustration, in Example 4.2, we discuss a linear metabolic pathway whose enzymes are successively inhibited. We see in Figure 4.8 that an inhibition of the first enzyme has a different temporal effect than inhibition of the later enzymes. Also the steady states (here the values reached at time point 15) are different if different enzymes are hit.
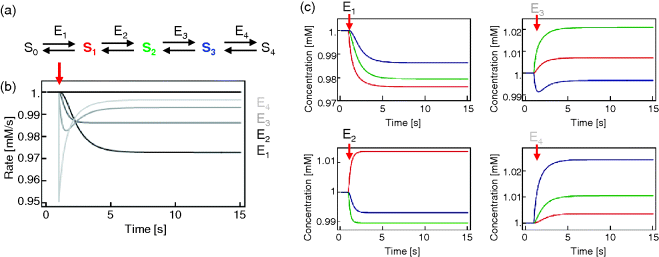
Figure 4.8 The effect of inhibiting an enzyme in an unbranched metabolic pathway depends on the position of that enzyme in the pathway. (a) Scheme of a linear metabolic pathway. Parameter values: see text. (b) Before perturbation, the system is at steady state. At time  , one of the enzymes as indicated by gray scale is mildly inhibited by reducing its value by 5% (from 1 to 0.95). The rate of reaction 4 is presented. (c) Dynamics of metabolite concentrations upon different perturbations. Colors of time courses correspond to the colors of metabolites in (a).
The relations between steady-state variables and kinetic parameters are usually nonlinear. Up to now, there is no general theory that predicts the effect of large parameter changes in a network. The approach presented in the following is, basically, restricted to small parameter changes. Mathematically, the system is linearized at steady state, which yields exact results, if the parameter changes are infinitesimally small.
In this section, we will first define a set of mathematical expressions that are useful to quantify control in biochemical reaction networks. Later we will show the relations between these functions and their application for prediction of reaction network behavior.
4.2.1 The Coefficients of Control Analysis
Biochemical reaction systems are networks of metabolites connected by chemical reactions. Their behavior is determined by the properties of their components – the individual reactions and their kinetics – as well as by the network structure – the involvement of compounds in different reaction or in brief: the stoichiometry. Hence, the effect of a perturbation exerted on a reaction in this network will depend on both – the local properties of this reaction and the embedding of this reaction in the global network.
Let y(x) denote a quantity that depends on another quantity x. The effect of the change  on y is expressed in terms of sensitivity coefficients:

In practical applications,  might be, for example, identified with 1% change of x and
  with the percentage change of y. The factor
  is a normalization factor that makes the coefficient independent of units and of the magnitude of x and y. In the limiting case
  , the sensitivity coefficients can be written as
Both right-hand expressions are mathematically equivalent.
Two distinct types of coefficients, local and global coefficients, reflect the relations among local and global effects of changes. Elasticity coefficients are local coefficients pertaining to individual reactions. They can be calculated in any given state. Control coefficients and response coefficients are global quantities. They refer to a given steady state of the entire system. After a perturbation of x, the relaxation of y to new steady state is considered.
The general form of the coefficients in control analysis as defined in Eq. (4.55) contains the normalization  . The normalization has the advantage that we get rid of units and can compare, for example, fluxes belonging to different branches of a network. The drawback of the normalization is that
  is not defined as soon as
  , which may happen for certain parameter combinations. In those cases, it is favorable to work with nonnormalized coefficients. Throughout this chapter, we will consider usually normalized quantities. If we use nonnormalized coefficients, they are flagged as
  with
with  . In general, the use of one or the other type of coefficient is also a matter of personal choice of the modeler.
Changes reflected by the different coefficients are illustrated in Figure 4.9.

Figure 4.9 Schematic representation of perturbation and effects quantified by different coefficients of metabolic control analysis.
4.2.1.1 The Elasticity Coefficients
An elasticity coefficient quantifies the sensitivity of a reaction rate to the change of a concentration or a parameter while all other arguments of the kinetic law are kept fixed. It measures the direct effect on the reaction velocity, while the rest of the network is not taken into consideration. The sensitivity of the rate  of a reaction to the change of the concentration
  of a metabolite is calculated by the ɛ-elasticity:

The nonnormalized elasticity is  . The π-elasticity is defined with respect to parameters
  like kinetic constants, concentrations of enzymes, or concentrations of external metabolites as follows:

4.2.1.2 Control Coefficients
When defining control coefficients, we refer to a stable steady state of the metabolic system characterized by steady-state concentrations  and steady-state fluxes
  . Any sufficiently small perturbation of an individual reaction rate,
  , by a parameter change
  drives the system to a new steady state in close proximity with
  and
and  . A measure for the change of fluxes and concentrations are the control coefficients.
The flux control coefficient for the control of rate  over flux
  is defined as

The control coefficients quantify the control that a certain reaction  exerts on the steady-state flux J. It should be noted that the rate change,
  , is caused by the change of a parameter
  that has a direct effect solely on
  . Thus, it holds
Such a parameter might be the enzyme concentration, a kinetic constant, or the concentration of a specific inhibitor or effector.
In a more compact form the flux control coefficient reads
The respective nonnormalized flux control coefficient is  . Equivalently, the concentration control coefficient of concentrations
  with respect to
  reads
reads

4.2.1.3 Response Coefficients
The steady state is determined by the values of the parameters. A third type of coefficients expresses the direct dependence of steady-state variables on parameters. The response coefficients are defined as

where the first coefficient expresses the response of the flux to a parameter perturbation, while the latter describes the response of a steady-state concentration.
4.2.1.4 Matrix Representation of the Coefficients
Control, response, and elasticity coefficients are defined with respect to all rates, steady-state concentrations, fluxes, or parameters in the metabolic system and in the respective model. They can be arranged in matrices:

Matrix representation can also be chosen for all types of nonnormalized coefficients. The arrangement in matrices allows to applying matrix algebra in control analysis. In particular, the matrices of normalized control coefficients can be calculated from the matrices of nonnormalized control coefficient as follows:
The symbol “dg” stands for the diagonal matrix, that is, for a system with three reactions it holds  .
.
4.2.2 The Theorems of Metabolic Control Theory
Let us assume that we are interested in calculating the control coefficients for a system under investigation. Usually, the steady-state fluxes or concentrations cannot be expressed explicitly as function of the reaction rates. Therefore, flux and concentration control coefficients cannot simply be determined by taking the respective derivatives, as we did for the elasticity coefficients in Example 4.3.
Fortunately, the work with control coefficients is eased by of a set of theorems. The first type of theorems, the summation theorems, makes a statement about the total control over a flux or a steady-state concentration. The second type of theorems, the connectivity theorems, relates the control coefficients to the elasticity coefficients. Both types of theorems together with network information encoded in the stoichiometric matrix contain enough information to calculate all control coefficients.
Here, we will first introduce the theorems. Then, we will present a hypothetical perturbation experiment (as introduced by Kacser & Burns) to illustrate the summation theorem. Finally, the theorems will be derived mathematically.
4.2.2.1 The Summation Theorems
The summation theorems make a statement about the total control over a certain steady-state flux or concentration. The flux control coefficients and concentration control coefficients fulfill, respectively,
for any flux  and any steady-state concentration
  . The quantity r is the number of reactions. The flux control coefficients of a metabolic network for one steady-state flux sum up to one. This means that all enzymatic reactions can share the control over this flux. The control coefficients of a metabolic network for one steady-state concentration are balanced. This means again that the enzymatic reactions can share the control over this concentration, but some of them exert a negative control while others exert a positive control. Both relations can also be expressed in matrix formulation. We get

The symbols 1 and 0 denote column vectors with r rows containing as entries only ones or zeros, respectively. The summation theorems for the nonnormalized control coefficients read

where K is the matrix satisfying  (see Section 4.2). A more intuitive derivation of the summation theorems is given in the following example according to Kacser and Burns [18].
4.2.2.2 The Connectivity Theorems
Flux control coefficients and elasticity coefficients are related by the expression

Note that the sum runs over all rates  for any flux
  . Considering the concentration
  of a specific metabolite and a certain flux
  , each term contains the elasticity
  describing the direct influence of a change of
  on the rates
  and the control coefficient expressing the control of
  over
over  .
.
The connectivity theorem between concentration control coefficients and elasticity coefficients reads

Again, the sum runs over all rates  , while
  and
and  are the concentrations of two fixed metabolites. The symbol
  is the so-called Kronecker symbol.
In matrix formulation, the connectivity theorems read

where I denotes the identity matrix of size  . For nonnormalized coefficients, it holds

where L is the link matrix that expresses the relation between independent and dependent rows in the stoichiometric matrix (Section 3.15, Eq. (3.22)). A comprehensive representation of both summation and connectivity theorems for nonnormalized coefficients is given by the following equation:

The summation and connectivity theorem together with the structural information of the stoichiometric matrix are sufficient to calculate the control coefficients for a metabolic network. This shall be illustrated for a small network in the next example.
4.2.3 Matrix Expressions for Control Coefficients
After having introduced the theorems of MCA, we will derive expressions for the control coefficients in matrix form. These expressions are suited for calculating the coefficients even for large-scale models. We start from the steady-state condition

Implicit differentiation with respect to the parameter vector p yields
If we chose reaction specific parameters for perturbation, the matrix of nonnormalized parameter elasticities contains nonzero entries in the main diagonal and zeros elsewhere (compare (Eq. (4.64)).
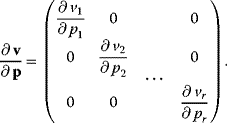
Therefore, this matrix is regular and has an inverse. Furthermore, we consider the Jacobian matrix

The Jacobian M is a regular matrix if the system is asymptotically stable and contains no conservation relations. The case with conservation relations is considered below. Here, we may premultiply Eq. (4.90) by the inverse of M and rearrange to get

As indicated,  is the matrix of nonnormalized response coefficients for concentrations. Postmultiplication by the inverse of the nonnormalized parameter elasticity matrix gives

This is the matrix of nonnormalized concentration control coefficients. The right (middle) site contains no parameters. This means, that the control coefficients do not depend on the particular choice of parameters to exert the perturbation as long as Eq. (4.64) is fulfilled. The control coefficients are only dependent on the structure of the network represented by the stoichiometric matrix N, and on the kinetics of the individual reactions, represented by the nonnormalized elasticity matrix  .
.
The implicit differentiation of

with respect to the parameter vector p leads to

This yields, after some rearrangement, an expression for the nonnormalized flux control coefficients:

The normalized control coefficients are (by use of (Eq. (4.69))
These equations can easily be implemented for numerical calculation of control coefficients or used for analytical computation.
They are also suited for derivation of the theorems of MCA. The summation theorems for the control coefficients follow from Eq. (4.98) by postmultiplication with the vector 1 (the row vector containing only 1 s), and consideration of the relations  and
and  , as shown below:
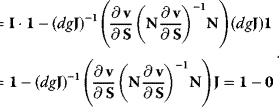
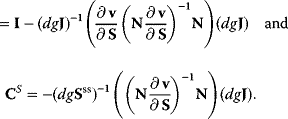
The connectivity theorems result from postmultiplication of Eq. (4.98) with the elasticity matrix  , and using that multiplication of a matrix with its inverse yields the identity matrix I of respective type.
If the reaction system involves conservation relations, we eliminate dependent variables as explained in Section 1.2.4. In this case, the nonnormalized coefficients read
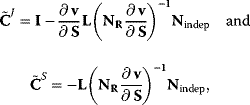
and the normalized control coefficients are obtained by applying Eq. (4.69).
An example for calculation of flux control coefficients can be found in the web material.
To investigate to implications of control distribution, we will now analyze the control pattern in an unbranched pathway:
with linear kinetics  , the equilibrium constants
  , and fixed concentrations of the external metabolites,
  and
and  . In this case, one can calculate an analytical expression for the steady-state flux,
as well as an analytical expression for the flux control coefficients
Let us consider two very general cases. First assume that all reactions have the same individual kinetics,  for
for  and that the equilibrium constants, which are also equal, satisfy
  . In this case, the ratio of two subsequent flux control coefficients is

Hence, the control coefficients of the preceding reactions are larger than the control coefficients of the succeeding reactions and flux control coefficients are higher in the beginning of a chain than in the end. This is in agreement with the frequent observation that flux control is strongest in the upper part of an unbranched reaction pathway.
Now assume that the individual rate constants might be different, but that all equilibrium constants are equal to one,  for
for  . This implies
  . (Equation 4.102) simplifies to

Consider now the relaxation time  (see Section 4.3) as a measure for the rate of an enzyme. The flux control coefficient reads

This expression helps to elucidate two aspects of metabolic control. First, all enzymes participate in the control since all enzymes have a positive relaxation time. There is no enzyme that has all control; that is, determines the flux through the pathway alone. Second, slow enzymes with a higher relaxation time exert in general more control than fast enzymes with a short relaxation time.
The predictive power of flux control coefficients for directed changes of flux is illustrated in the following example.
4.2.4 Upper Glycolysis as Realistic Model Example
Metabolic control analysis can also be easily applied to branched networks with conservation relations. Here, the matrix formulation is especially helpful. Consider the following model describing the dynamics of upper glycolysis, an essential pathway in the central carbon metabolism.
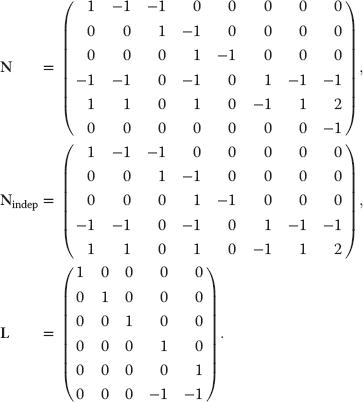
Reaction 1 denotes hexokinase, reaction 2 summarizes synthesis reactions branching off from glucose-6-phosphate. Reaction 3 is the phosphoglucoisomerase, reaction 4 the phosphofructokinase, and reaction 5 the aldolase. Reactions 6 and 7 denote other ATP consuming or producing reactions in metabolism, and reaction 8 is the adenylate kinase converting AMP and ATP into 2 ADP. The stoichiometric matrix, reduced stoichiometric matrix, and link matrix (compare Section 3.1.5) of this model read:
Using the following kinetic expressions and kinetic parameters, we can calculate flux and concentration control coefficients:


The resulting values for the control coefficients are represented in gray scale in Figure 4.11. We see that the rates have very different control on the steady-state fluxes and steady-state concentrations. Most interesting are reaction 1 exerting positive control (due to glucose uptake) over all reactions except of the synthesis reaction (2) and the general ATP consumption (7). This is due to the fact that in this model ATP is mainly consumed for phosphorylation of glucose; ATP producing steps of lower glycolysis are only represented by reaction 6, which has therefore positive control over synthesis (2).
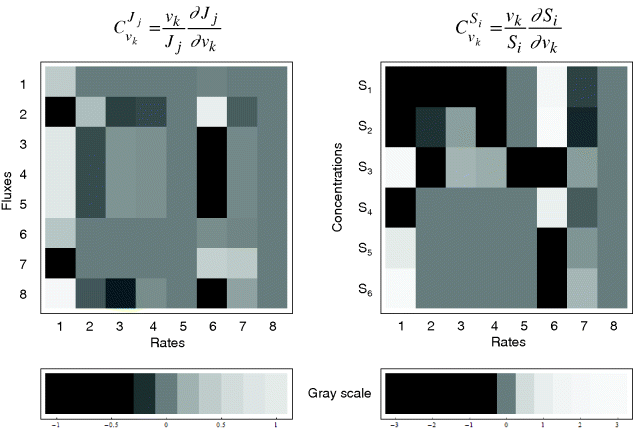
Figure 4.11 Flux and concentration control coefficients for a model of the upper glycolysis (Eqs. 4.106) and (4.107)). Gray scales express the values of the coefficients (dark gray to black – negative, light gray to white – positive).
Reaction 6 also has positive control over S1, S2, and S4 (due to providing ATP) and negative control over S3, S5, and S6.
4.2.5 Time-Dependent Response Coefficients
Metabolic control and response analysis has experienced a number of upgrades and extensions. We found that time-dependent response coefficients are especially helpful for systematic detection of the effect of a parameter change on time courses of the biochemical network, especially during parameter estimation. Time-dependent response coefficients quantify the effect of a parameter change on the dynamic concentration of a compound S, as given by

[26]. Again, we assume that concentration changes over time are given by the balance Eq. (3.5), that is,
To account not only for kinetic parameters, but also for initial conditions, a new vector q is introduced comprising both types of quantities

The temporal change of response coefficients (in a system without conservation relations) then reads

As before (Eq. (4.69)), the response coefficients can be normalized when conservation relations have to be respected, the expression to calculate the time-dependent response coefficients also contains the link matrix L (Section 3.1.5)

where  (see also Eq. (3.25)). An illustration of the behavior of time-dependent response coefficients is given in the following example:
Exercises
- Compare the shapes of different kinetic laws.
- Create a plot of rate v versus concentration S for a reaction with mass action kinetics with
 , a reaction with Michaelis–Menten kinetics with
  ,
,  and a reaction with Hill kinetics with
  ,
,  , and
, and 
- Create a plot v against S for a reaction with Michaelis–Menten kinetics. Vary
 and
and  .
. - Create a plot v against S for a reaction with Hill kinetics. Vary either
 or n.
or n. - Create a plot v against S for a reaction with Monod–Wyman–Changeux kinetics (Eq. (4.46)). Vary
 , n, or L. Compare to the results for Hill kinetics.
 - Plot reaction rates against substrate concentrations for the different types of inhibition presented in Table 4.3.
- Create a plot of rate v versus concentration S for a reaction with mass action kinetics with
- Assign the following kinetics to network N3 in Chapter 3:
 ,
,  ,
,  with
with  ,
,  ,
,  ,
,  ,
,  . Compute the steady-state concentration of S1 and calculate the flux control coefficients.
 - For the reaction system
 with
with  ,
,  ,
,  , and
, and  , write down the set of systems equations.
- Compute the Jacobian J!
- Determine the eigenvalues and eigenvectors of the Jacobian J!
- What is the general solution of the ordinary differential equation system?
- Compute the solution with the initial condition
 !
!
- Assign following kinetics to the network given below:


- Calculate the concentration of S1 in steady state!
- Calculate the elasticity coefficients of v1 and v2 with respect to substrate S1!
- Calculate the flux control coefficients!
- Could this system attain a steady state if
 ?
?
- If the rate
 is given as Hill kinetics. What is the corresponding elasticity coefficient
  ?
? - Load a biochemical network from a suitable database (Biomodels.org or JWSonline at jjj.biochem.sun.ac.za/). Calculate steady-state concentrations and control coefficients.
- What is the difference of flux control coefficients in a linear unbranched reaction pathway, if we describe all reactions either with reversible or irreversible rate laws?
References
- 1. Waage, P. and Guldberg, C.M. (1864) Studies concerning affinity, Forhandlinger, Videnskabs-Selskabet, Christiania, pp 35.
- 2. Guldberg, C.M. and Waage, P. (1867) Études sur les affinités chimiquies, Christiania.
- 3. Guldberg, C.M. and Waage, P. (1879) Über die chemische Affinität. J. Prakt. Chem., 19, 69.
- 4. Brown., A.J. (1902) Enzyme action. J. Chem. Soc., 81, 373–386.
- 5. Michaelis, L. and Menten, M.L. (1913) Kinetik der Invertinwirkung. Biochem. Z, 49, 333–369.
- 6. Briggs, G.E. and Haldane, J.B.S. (1925) A note on the kinetics of enzyme action. Biochem. J., 19, 338–339.
- 7. Lineweaver, H. and Burk, D. (1934) The determination of enzyme dissocation constants. J. Am. Chem. Soc., 56, 658–660.
- 8. Eadie, G.S. (1942) The inhibition of cholinesterase by physostigmine and prostigmine. J. Biol. Chem., 146, 85–93.
- 9. Hanes, C.S. (1932) Studies on plant amylases. I. The effect of starch concentratio upon the velocity of hydrolysis by the amylase of germinated barley. Biochem. J., 26, 1406–1421.
- 10. Haldane, J.B.S. (1930) Enzymes, Longmans, Green and Co., London.
- 11. Schellenberger, A. (ed.) (1989) Enzymkatalyse, VEB Gustav Fischer Verlag, Jena.
- 12. Wegscheider, R. (1902) Über simultane gleichgewichte und die beziehungen zwischen thermodynamik und reaktionskinetik homogener systeme. Z. Phys. Chem., 39, 257–303.
- 13. Hill, A.V. (1910) The possible effects of the aggregation of the molecules of hemoglobin on its dissociation curves. J. Physiol., 40, iv–vii.
- 14. Hill, A.V. (1913) The combinations of hemoglobin with oxygen and with carbonmonoxide. Biochem. J., 7, 471–480.
- 15. Monod, J., Wyman, J., and Changeux, J.P. (1965) On the nature of allosteric transitions: a plausible model. J. Mol. Biol., 12, 88–118.
- 16. Heijnen, J.J. (2005) Approximative kinetic formats used in metabolic network modeling. Biotechnol. Bioeng., 91, 534–545.
- 17. Liebermeister, W. and Klipp, E. (2006) Bringing metabolic networks to life: convenience rate law and thermodynamic constraints. Theor. Biol. Med. Model., 3, 42.
- 18. Kacser, H. and Burns, J.A. (1973) The control of flux. Symp. Soc. Exp. Biol., 27, 65–104.
- 19. Heinrich, R. and Rapoport, T.A. (1974) A linear steady-state treatment of enzymatic chains. General properties, control and effector strength. Eur. J. Biochem., 42, 89–95.
- 20. Reder, C. (1988) Metabolic control theory: a structural approach. J. Theor. Biol., 135, 175–201.
- 21. Bruggeman, F.J., Westerhoff, H.V., Hoek, J.B., and Kholodenko, B.N. (2002) Modular response analysis of cellular regulatory networks. J. Theor. Biol., 218, 507–520.
- 22. Liebermeister, W., Klipp, E., Schuster, S., and Heinrich, R. (2004) A theory of optimal differential gene expression. Biosystems, 76, 261–278.
- 23. Westerhoff, H.V., Getz, W.M., Bruggeman, F., Hofmeyr, J.H., Rohwer, J.M. et al. (2002) ECA: control in ecosystems. Mol. Biol. Rep., 29, 113–117.
- 24. Hofmeyr, J.H. and Westerhoff, H.V. (2001) Building the cellular puzzle: control in multi-level reaction networks. J. Theor. Biol., 208, 261–285.
- 25. Kholodenko, B.N., Brown, G.C., and Hoek, J.B. (2000) Diffusion control of protein phosphorylation in signal transduction pathways. Biochem. J., (350 Pt 3), 901–907.
- 26. Ingalls, B.P. and Sauro, H.M. (2003) Sensitivity analysis of stoichiometric networks: an extension of metabolic control analysis to non-steady state trajectories. J. Theor. Biol., 222, 23–36.
Further Reading
- Enzyme kinetics: Cornish-Bowden, A. (2012) Fundamentals of Enzyme Kinetics, 4th edn, Wiley-Blackwell, Weinheim.
- Enzyme kinetics: Cornish-Bowden, A. (2013) The origins of enzyme kinetics. FEBS Lett., 587 (17), 2725–2730.
- Enzyme kinetics: Liebermeister, W. and Klipp, E. (2006) Bringing metabolic networks to life: convenience rate law and thermodynamic constraints. Theor. Biol. Med. Model., 3, 41.
- Foundations of metabolic control theory, I: Kacser, H. and Burns, J.A. (1973) The control of flux. Symp. Soc. Exp. Biol., 27, 65–104.
- Foundations of metabolic control theory, II: Heinrich, R. and Rapoport, T.A. (1974) A linear steady-state treatment of enzymatic chains. General properties, control and effector strength. Eur. J. Biochem., 42 (1), 89–95.
- Mathematical formalization of metabolic control theory: Reder, C. (1988) Metabolic control theory: a structural approach. J. Theor. Biol., 135 (2), 175–201.
- Mathematical formalization of metabolic control theory: Fell, D. (1997) Understanding the Control of Metabolism, Portland, London.
- Extension to non-steady states: Ingalls, B.P. and Sauro, H.M. (2003) Sensitivity analysis of stoichiometric networks: an extension of metabolic control analysis to non-steady state trajectories. J. Theor. Biol., 222 (1), 23–36.


 and
and  for some important reactions


