12
Models of Biochemical Systems
- 12.1 Metabolic Systems
- 12.2 Signaling Pathways
- 12.3 The Cell Cycle
- 12.4 The Aging Process
- Exercises
- References
Systems biology attempts to understand structure, function, regulation, or development of biological systems by combining experimental and computational approaches. We must acknowledge that different parts of cellular organization are studied and understood in different ways and to different extent. This is related to diverse experimental techniques that can be used to measure the abundance of metabolites, proteins, mRNA, or other types of compounds. For example, enzyme kinetic measurements are performed for more than a century, while mRNA measurements (e.g., RNAseq or microarray data) or protein measurements (e.g., as mass spectrometry analysis) have been developed more recently. Not all data can be provided with the same accuracy and reproducibility. These and other complications in studying life caused a nonuniform progress in modeling different parts of cellular life. Moreover, the diversity of scientific questions and the availability of computational tools to tackle them provoked the development of very different types of models for different biological processes. Stimulating or modeling of biochemical networks is the recent development to assemble parts lists for various networks, such as genome-scale metabolic reconstructions, compilations of all compounds in signaling networks, lists of all transcription factors, and many more. These can often be found in specialized databases such as Reactome, KEGG, and BioModels (see Chapter 16). In this chapter, we will introduce a number of classical and more recent areas of systems biological research. Specifically, we discuss modeling of metabolic systems, signaling pathways, cell-cycle regulation, and development and differentiation, primarily with ODE systems.
12.1 Metabolic Systems
12.1.1 Basic Elements of Metabolic Modeling
Metabolic networks are on the one side defined by the enzymes converting substrates into products in a reversible or irreversible manner. Without enzymes, those reactions are essentially impossible or too slow. On the other side, the networks are characterized by the metabolites that are converted by the various enzymes. Biochemical studies have revealed a number of important pathways including catabolic pathways and pathways of the energy metabolism, such as glycolysis, the pentose-phosphate pathway, the tricarboxylic acid (TCA) cycle, and oxidative phosphorylation, and anabolic pathways including gluconeogenesis, amino acid synthesis pathways, synthesis of fatty acids, synthesis of nucleic acids, and synthesis and degradation of more complex molecules. Databases such as the Kyoto Encyclopedia of Genes and Genomes Pathway (KEGG, http://http://www.genome.jp/kegg/pathway.html) provide a comprehensive overview of the composition of pathways in various organisms [3].
Here, we will focus on their characteristics that are essential for modeling. Chapter 2 provides a summary of the first steps to build a model. First, we sketch the metabolites and the converting reactions in a cartoon to get an overview and an intuitive understanding (Figure 12.1). Based on that cartoon and on further information, we set the limits of our model. To this end, we consider what kind of question we want to answer with our model, what information in terms of qualitative and quantitative data is available, and how can we make the model as simple as possible but as comprehensive as necessary. Then, for every compound, which is part of the system, we formulate the balance equations (see also Section 3.1) summing up all reactions that produce the compound (with a positive sign) and all reactions that degrade the compound (with a negative sign). At this stage, the model is suited for a network analysis, such as the stoichiometric analysis (Section 3.1) or, with some additional information, flux balance analysis (Section 3.2). In order to study the dynamics of the system, we must add kinetic descriptions to the individual reactions (Chapter 4). Keep in mind that the reaction kinetics may depend on
- the concentrations of substrates and products (in Figure 12.1: G1P and G6P),
- specific parameters such as KM-values,
- the amount and activity of the catalyzing enzyme (here hidden in the Vmax values, see Chapter 4), and
- the activity of modifiers, which are not shown in the example in Figure 12.1.
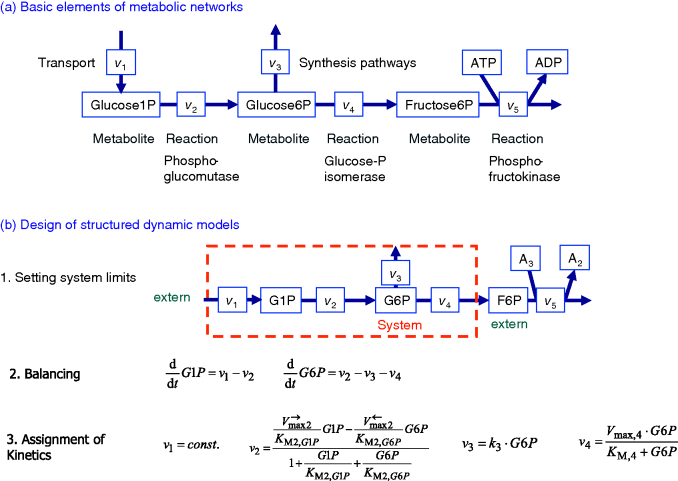
Figure 12.1 Designing metabolic models. (a) Basic elements of metabolic networks comprise metabolites and the connecting reactions. The reactions can be specific for one enzyme (e.g., the phosphoglucomutase) or they can lump several processes such as transport or branch to synthesis. (b) Basic steps for designing structured dynamic models: first, one has to choose the system of interest and its limits. Second, all metabolite changes have to be balanced according to the contribution reactions (Chapter 3). Next, all reactions are described with kinetic expressions. Note that the shown expressions are a reasonable choice; other expressions can be appropriate depending on the available knowledge and the purpose of the model.
In the following, we will discuss in more detail models for three example pathways: the upper glycolysis, the full glycolysis, and the threonine synthesis.
12.1.2 Toy Model of Upper Glycolysis
A first model of the upper part of glycolysis is depicted in Figure 12.2. It comprises six reactions and six metabolites. Note that we neglect the formation of phosphate Pi here.

Figure 12.2 Toy model of the upper glycolysis. The model involves the reactions glucose uptake (v1), the phosphorylation of glucose under conversion of ATP to ADP by the enzyme hexokinase (v2), intramolecular rearrangments by the enzyme phosphoglucoisomerase (v3), a second phosphorylation (and ATP/ADP conversion) by phosphofructokinase (v4), dephosphorylation without involvement of ATP/ADP by fructose-bisphosphatase (v5), and splitting of the hexose (6-C-sugar) into two trioses (3-C-sugars) by aldolase (v6). Abbreviations: Gluc-6P – glucose-6-phosphate, Fruc-6P – fructose-6-phosphate, Fruc-1,6P2 – fructose-1,6-bisphosphate.
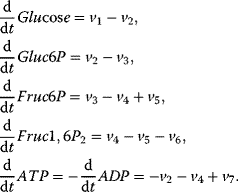
The corresponding ODE system reads
With mass action kinetics, the rate equations read  ,
,  ,
,  ,
,  ,
,  ,
,  , and
, and  . Given the values of the parameters
  and the initial concentrations, one may simulate the time behavior of the network as depicted in Figure 12.3.

Figure 12.3 Dynamic behavior of the upper glycolysis model (Figure 12.2 and Eq. (12.1)). Initial conditions at t = 0 Glucose(0) = Gluc-6P(0) = Fruc-6P(0) = Fruc-1,6P2(0) = 0 and ATP(0) = ADP(0) =0.5 (arbitrary units). Parameters: k1 = 0.25, k2 = 1, k3 = 1, k-3 = 1, k4 = 1, k5 = 1, k6 = 1, and k7 = 2.5. The steady-state concentrations are Glucosess = 0.357, Gluc-6Pss = 0.964, Fruc-6Pss = 0.714, Fruc-1,6P2ss = 0.25, and ATPss = 0.7, and ADPss = 0.2. The steady-state fluxes are  ,
,  , and
, and  . (a) Time course plots (concentration versus time), (b) phase plane plot (concentrations versus concentration of ATP with varying time); all curves start at ATP = 0.5 for t = 0.
We see starting with zero concentrations of all hexoses (here, glucose, fructose, and their phosphates), that they accumulate until production and degradation are balanced. They approach a steady state. ATP rises and decreases to the same extent as ADP decreases and rises, and their total remains constant. This is due to the conservation of adenine nucleotides, which could be revealed by stoichiometric analysis (Section 3.1).
For this upper glycolysis model, the concentration vector is S = (Glucose, Gluc6P, Fruc6P, Fruc1,6P2, ATP, ADP)T, the vector of reaction rates is  , and the stoichiometric matrix reads
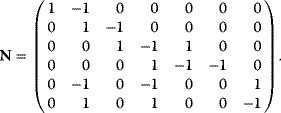
It comprises  reactions and has
  . Thus, the kernel matrix (see Chapter 3) has two linear independent columns. A possible representation is
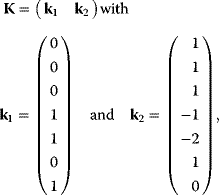
Figure 12.4 shows the flux and concentration control coefficients (see Section 4.2) for the model of upper glycolysis in gray scale (see scaling bar). Reaction v1 has a flux control of 1 over all steady-state fluxes, reactions v2, v3, v4, and v7 have no control over fluxes; they are determined by v1. Reactions v5 and v6 have positive or negative control over J4, J5, and J7, respectively, since they control the turnover of fructose phosphates.
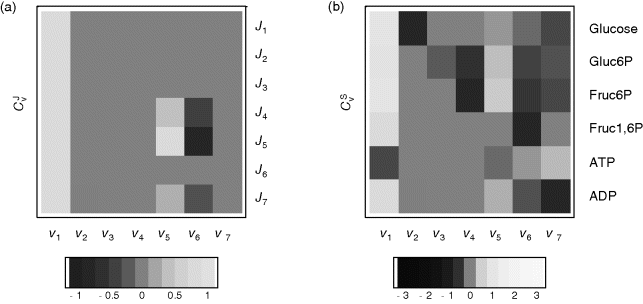
Figure 12.4 Flux and concentration control coefficients for the glycolysis model given by the equation system (12.1) with the parameters given in the legend to Figure 12.3. Values of the coefficients are indicated in gray scale: gray means zero control, white or light gray indicates positive control, and dark gray or black negative control, respectively.
The concentration control shows a more interesting pattern. As a rule of thumb, it holds that producing reactions have a positive control and degrading reactions have a negative control, such as v1 and v2 for glucose. But also distant reactions can exert concentration control, such as v4 to v6 over Gluc6P.
More comprehensive models of glycolysis can be used to study details of the dynamics, such as the occurrence of oscillations or the effect of perturbations. Examples are the models of Hynne et al. [4] or the Reuss group [5,6] or a model based on genome-scale reconstructions [3]. An overview of the most important reactions in glycolysis is given in Figure 12.5.
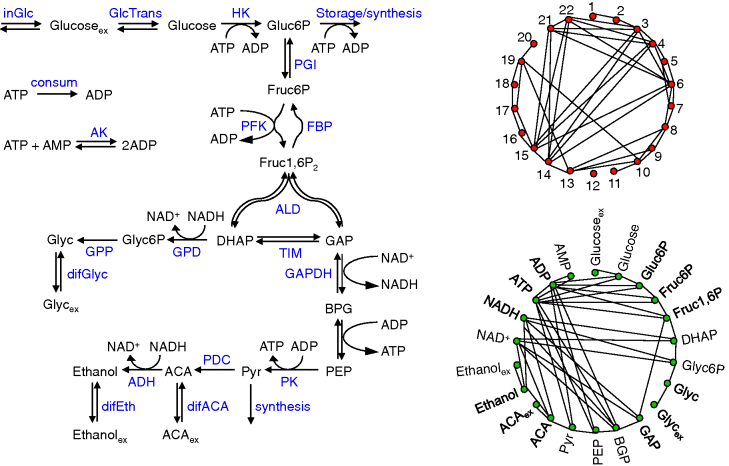
Figure 12.5 Full glycolysis models. (a) Main reactions and metabolites. 1-inGlc – influx of glucose, 2-GlcTrans – transport of glucose, 3-HK – hexokinase, 4-storage/synthesis, 5-PGI – phosphoglucoisomerase, 6-PFK – phosphofructokinase, 7-FBP – fructosbisphosphatase, 8-ALD – aldolase, 9-TIM – triosephosphate isomerase, 10-GPD – NAD-dependent glycerol-3-phosphate dehydrogenase, 11-GPP – glycerol-3-phosphate phosphatase, 12-difGlyc – (facilitated) diffusion of glycerol over membrane, 13-GAPDH – glyceraldehyde phosphate dehydrogenase, 14-phosphoglycerate kinase + phosphoglycerate mutase + enolase, 15-PK pyruvate kinase, 16-synthesis, 17-PDC – pyruvate decarboxylase, 18-diffusion of acetate, 19-ADH – alcohol dehydrogenase, 20-difEth – ethanol diffusion, 21-ATP consumption, 22-AK – adenylate kinase. (b) Network of reactions connected by common metabolites, (c) network of metabolites connected by common reactions.
12.1.3 Threonine Synthesis Pathway Model
Threonine is an amino acid and it is essential for birds and mammals. The synthesis pathway from aspartate involves five steps. It is known for a long time and has attracted some interest with respect to its economic industrial production for a variety of uses. The kinetics of all the five enzymes from E. coli have been studied extensively, the complete genome sequence of this organism is now known and there is an extensive range of genetic tools available. The intensive study and the availability of kinetic information make it a good example for metabolic modeling of the pathway (Figure 12.6).

Figure 12.6 Model of the threonine pathway. Aspartate is converted into threonine in five steps. Threonine exerts negative feedback on its producing reactions. The pathway consumes ATP and NADPH.
The reaction system can be described with the following set of differential equations:
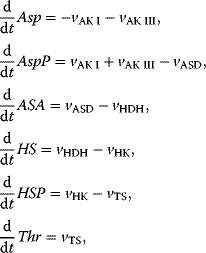
with


This system has no nontrivial steady state, that is, no steady state with nonzero flux, since aspartate is always degraded, while threonine is only produced. The same imbalance holds for the couples ATP/ADP and NADPH+H+/NADP+. The dynamics is shown in Figure 12.7.
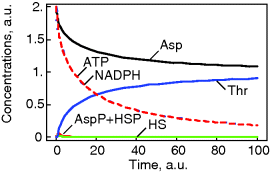
Figure 12.7 Dynamics of the threonine pathway model. The parameters are given in the text.
Threonine exerts feedback inhibition on the pathway producing it. This is illustrated in Figure 12.8. The higher the threonine concentration, the lower the rates of the inhibited reactions. The effect is that production of threonine is downregulated as long as its level is sufficient, thereby saving aspartate and energy.

Figure 12.8 Effect of feedback inhibition in the model depicted in Figure 12.6. Threonine is a product of the pathway but exhibits negative feedback on its producing reactions. Consequently, their rates decrease with increasing threonine concentration leading to a homeostasis.
12.2 Signaling Pathways
12.2.1 Function and Structure of Intra- and Intercellular Communication
On the molecular level, signaling involves the same type of processes as metabolism: production or degradation of substances, molecular modifications (mainly phosphorylation, also methylation, acetylation), localization of compounds to specific cell compartments, and activation or inhibition of reactions. From a modeling point of view, there are some important differences between signaling and metabolism. (i) Signaling pathways serve for information processing and transfer of information, while metabolism provides mainly mass transfer. (ii) The metabolic network is determined by the present set of enzymes catalyzing the reactions. Signaling pathways involve compounds of different type; they may form highly organized complexes, and may dynamically assemble upon occurrence of the signal. (iii) The quantity of converted material is high in metabolism (amounts are usually given in concentrations in the order of µM or mM) compared to the number of molecules involved in signaling processes (in yeast or E. coli cells, typical abundance of proteins in signal cascades is in the order of 10–104 molecules per cell). (iv) The different amounts of components have an effect on the concentration ratio of catalysts and substrates. In metabolism, this ratio is usually low, that is, the enzyme concentration is much lower than the substrate concentration, which gives rise to the quasi-steady state assumption used in Michaelis–Menten kinetics (Section 4.1). In signaling processes, amounts of catalysts and their substrates are frequently in the same order of magnitude.
Cells have a broad spectrum of receiving and processing signals; not all of them can be considered here. A typical sequence of events in signaling pathways is shown in Figure 12.9 and proceeds as follows.
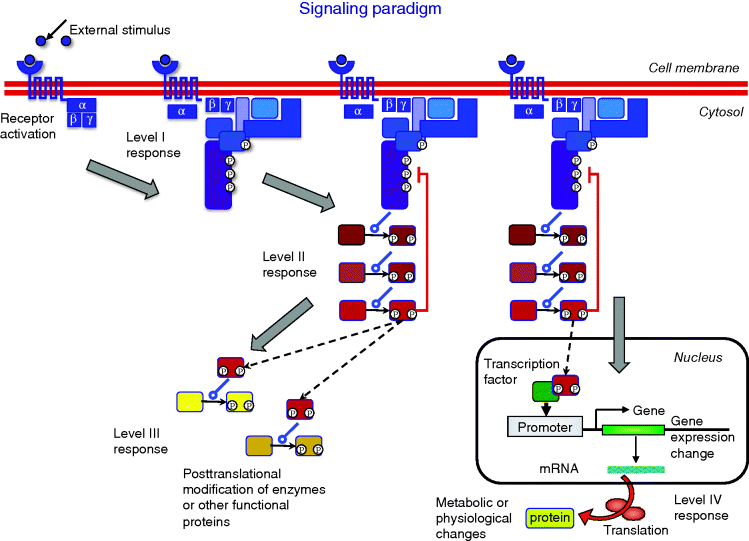
Figure 12.9 Visualization of the signaling paradigm. The receptor is stimulated by a ligand or another kind of signal and becomes active. The active receptor initiates the internal signaling cascade: Level I response comprises processes at the cellular membrane such as receptor phosphorylation, G protein cycle, recruitment of specific proteins, establishment of transient interactions, and modifications. Level II response includes all interactions and mutual modifications of signaling proteins in the cytosol. They lead primarily to the activation of downstream components, but can also exert positive or negative feedback within the current signaling cascade or crosstalk to other areas of the signaling network. Level III response denotes immediate actions of signaling molecules on functional proteins such as metabolic enzymes or cell-cycle proteins leading to immediate regulatory effects. These interactions can be fast, i.e. within a few minutes in yeast. For level IV response, an activated protein enters the nucleus, transcription factors are activated or deactivated. The transcription factors regulate the transcription rate of a set of genes. The absolute amount or the relative changes in protein concentrations alter the state of the cell and trigger the long-term response to the signal.
The signal – a substance acting as ligand, hormones, growth factors or a physical stimulus, oxidative stress, and osmotic stress – approaches the cell surface and is perceived by a transmembrane receptor. The receptor changes its state from susceptible to active and triggers subsequent processes within the cell. The active receptor stimulates an internal signaling cascade.
In order to distinguish between fast and slow processes and to characterize the main location of events, we discriminate between responses on levels I–IV. Level I response comprises all processes that take place at the membrane due to receptor activation. These processes may include the recruitment of a number of proteins to the vicinity of the receptor that were previously located either at the membrane or in the cytosol. These proteins may form large heteromeric complexes and modify each other and the receptor and they form a local environment of information transmission. They may also serve as anchor for cell structures such as actin cables.
Level II response includes all downstream interaction of signaling molecules in the cytoplasm. There occur different types of protein–protein interactions such as complex formation, phosphorylation and dephosphorylation, or phosphotransfer, as well as targeting for degradation. The effects include both forward signaling as well as positive and negative feedback. Also crosstalk between signaling pathways that are primarily considered responsible for transmission of specific signals is observed. Note that the concept of crosstalk is strongly related to the perception of signaling by the investigator. If we consider separate signaling pathways that transmit the information about a specific cue, we can also consider their crosstalk, that is, interactions between components of diverse signaling pathways that lead to a divergence of the information to other targets than those of the specific pathway (measures for crosstalk are discussed below). If we consider all signaling processes as one large signaling network, then we simply observe various interactions in this network.
Level III response comprises all direct effects of active signaling molecules on other cellular networks such as phosphorylation of cell-cycle components or metabolic enzymes. These effects proceed on fast time scales and may lead to immediate cellular responses.
Level IV response is comparatively slow. The sequence of state changes within the signaling pathway crosses the nuclear membrane. Eventually, transcription factors are activated or deactivated. Such a transcription factor changes its binding properties to regulatory regions on the DNA upstream of a set of genes; the transcription rate of these genes is altered (typically increased). The either newly produced proteins or the changes in protein concentration cause an adaptation response of the cell to the signal. Also on level IV, signaling pathways are regulated by a number of control mechanisms including feedback and feed-forward modulation.
This is somehow the typical picture; many pathways may work in completely different manner. As example, an overview on signaling pathways that are stimulated in yeast stress response is given in Figure 12.10. More extended versions of the yeast signaling network with focus on the precise types of interactions can be found in Ref. [7].
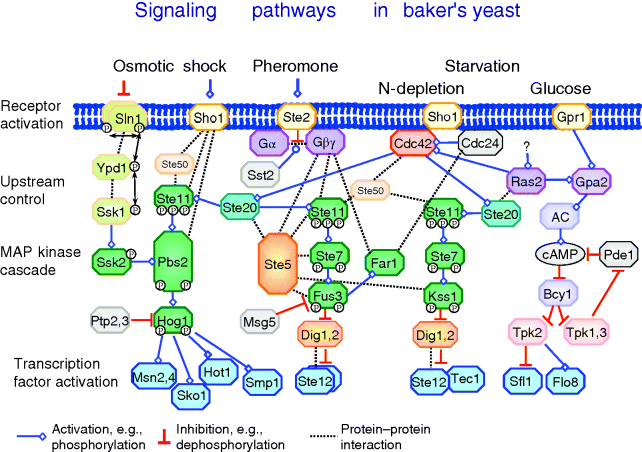
Figure 12.10 Overview of signaling pathways in yeast: the HOG pathway is activated by osmotic shock, the pheromone pathway is activated by a pheromone from cells of opposite mating type, and the filamentous growth pathway is stimulated by starvation conditions. In each case, the signal interacts with the receptor. The receptor activates a cascade of intracellular processes including complex formations, phosphorylations, and transport steps. A MAP kinase cascade is a particular part of many signaling pathways. Eventually, transcription factors are activated that regulate the expression of a set of genes. Beside the indicated connections further interactions of components are possible. For example, crosstalk may occur, that is, the activation of the downstream part of one pathway by a component of another pathway. This is supported by the frequent incidence of some proteins like Ste11 in the scheme.
With respect to the activating or inhibiting effect of an external cue on cellular response features, signaling pathways may exhibit different types of logical behavior. Positive and negative logic of signaling systems can be found:
- Before activation, the signaling pathway is OFF (or the activity of all components is on a basic level). Ligand binding or physical cue leads to activation or switch-on of the pathway's components. Examples: MAPK pathway, G proteins.
- Before activation, some components of the signaling pathway are ON or have high activity or are produced and degraded with high rates. Ligand binding or a physical cue reduces the activity or interrupts the production process. Examples: Phosphorelay system (constant consumption and relay of ATP-derived phosphate group is interrupted by osmotic stress), Wnt signaling pathway (constant production and destruction of β-catenin is modified as a consequence of Wnt binding through interruption of destruction and, hence, accumulation of β-catenin).
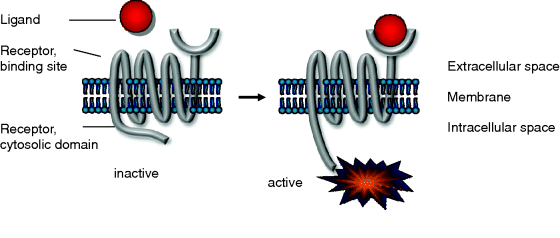
Figure 12.11 Schematic representation of receptor activation: the binding of the ligand at the external side leads to conformational changes at the internal side allow for new interactions or further modifications.
These examples are explained below in more detail along with the general structure of signal pathway building blocks (Section 12.2.3).
12.2.2 Receptor–Ligand Interactions
Many receptors are transmembrane proteins. They receive the signal and transmit it. Upon signal sensing they change their conformation. In the active form, they are able to initiate a downstream process within the cell (Figure 12.11).
The simplest concept of the interaction between receptor R and ligand L is reversible binding to form the active complex LR:

The dissociation constant is calculated as

Typical values for  are
are 
Cells have the ability to regulate the number and the activity of specific receptors, for example in order to weaken the signal transmission during long-term stimulation. Balancing production and degradation regulates the number of receptors. Phosphorylation of serine, threonine or tyrosine residues of the cytosolic domain by protein kinases mainly regulates the activity.
Hence, a more realistic scenario for ligand–receptor interaction is depicted in Figure 12.12.
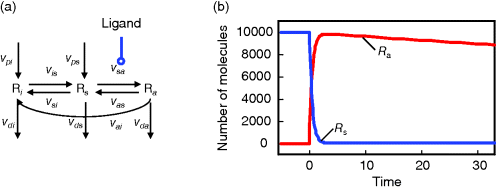
Figure 12.12 Receptor activation by ligand. (a) Schematic representation: L – ligand, Ri – inactive receptor, Rs – susceptible receptor, Ra – active receptor. vp* - production steps, vd* - degradation steps, other steps – transistion between inactive, susceptible, and active state of receptor. (b) Time course of active (red line) and susceptible (blue line) receptor after stimulation with  α-factor at
  . The total number of receptors is 10.000. The concentration of the active receptor increases immediately and then declines slowly, while the susceptible receptor is effectively reduced to zero.
We assume that the receptor may be present in an inactive state Ri or in a susceptible state Rs. The susceptible form can interact with the ligand to form the active state Ra. The inactive or the susceptible forms are produced from precursors ( ), all three forms may be degraded (
 ). The rates of production and degradation processes as well as the equilibria between the different states are influenced by the cell state, for example, by the cell-cycle stage. In general, the dynamics of this scenario can be described by the following set of differential equations:
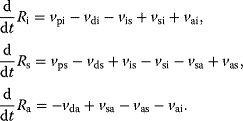
For the production terms, we may either assume constant values or (as mentioned above) rates that depend on the actual cell state. The degradation terms might be assumed to be linearly dependent on the concentration of their substrates ( ). This may also be a first guess for the state changes of the receptor (e.g.,
  ). The receptor activation is dependent on the ligand concentration (or any other value related to the signal). A linear approximation of the respective rate is
  . If the receptor is a dimer or oligomer, it might be sensible to include this information into the rate expression as
  , where
  denotes the binding constant to the monomer and n denotes the Hill coefficient (Eq. (4.44)).
12.2.3 Structural Components of Signaling Pathways
Signaling pathways constitute often highly complex networks, but it has been observed that they are frequently composed of typical building blocks. These components include Ras proteins, G protein cycles, phosphorelay systems, and MAP kinase cascades. In this chapter, we will discuss their general composition and function as well as modeling approaches.
12.2.3.1 G Proteins
G proteins are essential parts of many signaling pathways. The reason for their name is that they bind the guanine nucleotides GDP and GTP. They are heterotrimers, that is, consist of three different subunits. G proteins are associated to cell surface receptors with a heptahelical transmembrane structure, the G protein-coupled receptors (GPCR). Signal transduction cascades involving (i) such a transmembrane surface receptor, (ii) an associated G protein, and (iii) an intracellular effector that produces a second messenger play an important role in cellular communication and are well studied [9,10]. In humans, G protein-coupled receptors mediate responses to light, flavors, odors, numerous hormones, neurotransmitters, and other signals [11–13]. In unicellular eukaryotes, receptors of this type mediate signals that affect such basic processes as cell division, cell–cell fusion (mating), morphogenesis, and chemotaxis [11,14–16].
The cycle of G protein activation and inactivation is shown in Figure 12.13. When GDP is bound, the G protein α subunit (Gα) is associated with the G protein βγ heterodimer (Gβγ) and is inactive. Agonist binding to a receptor promotes guanine nucleotide exchange; Gα releases GDP, binds GTP, and dissociates from Gβγ. The dissociated subunits Gα or Gβγ, or both, are then free to activate target proteins (downstream effectors), which initiates signaling. When GTP is hydrolyzed, the subunits are able to reassociate. Gβγ antagonizes receptor action by inhibiting guanine nucleotide exchange. RGS (regulator of G protein signaling) proteins bind to Gα, stimulate GTP hydrolysis, and thereby reverse G protein activation. This general scheme can also be applied to the regulation of small monomeric Ras-like GTPases, such as Rho. In this case, the receptor, Gβγ, and RGS are replaced by GEF and GAP (see below).
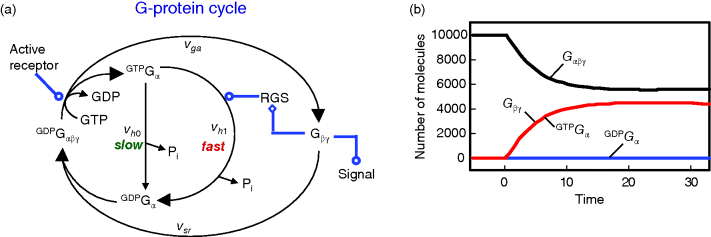
Figure 12.13 Activation cycle of G protein. (a) Without activation, the heterotrimeric G protein is bound to GDP. Upon activation by the activated receptor, an exchange of GDP with GTP occurs and the G protein is divided into GTP-bound Gα and the heterodimer Gβγ. Gα-bound GTP is hydrolyzed, either slowly in reaction vh0 or fast in reaction vh1 supported by the RGS protein. GDP-bound Gα can reassociate with Gβγ (reaction vsr). (b) Time course of G protein activation. The total number of molecules is 10.000. The concentration of GDP-bound Gα is low for the whole period due to fast complex formation with the heterodimer Gβγ.
Direct targets include different types of effectors, such as adenylyl cyclase, phospholipase C, exchange factors for small GTPases, some calcium and potassium channels, plasma membrane Na+/H+ exchangers, and certain protein kinases [10,17–19]. Typically, these effectors produce second messengers or other biochemical changes that lead to stimulation of a protein kinase or a protein kinase cascade (or, as mentioned, are themselves a protein kinase). Signaling persists until GTP is hydrolyzed to GDP and the Gα and Gβγ subunits reassociate, completing the cycle of activation. The strength of the G protein-initiated signal depends on (i) the rate of nucleotide exchange, (ii) the rate of spontaneous GTP hydrolysis, (iii) the rate of RGS-supported GTP hydrolysis, and (iv) the rate of subunit reassociation. RGS proteins act as GTPase-activating proteins (GAPs) for a variety of different Gα classes. Thereby, they shorten the lifetime of the activated state of a G protein, and contribute to signal cessation. Furthermore, they may contain additional modular domains with signaling functions and contribute to diversity and complexity of the cellular signaling networks [20–23].
12.2.3.2 Small G Proteins
Small G proteins are monomeric G proteins with molecular weight of 20–40 kDa. Like heterotrimeric G proteins, their activity depends on the binding of GTP. More than 100 small G proteins have been identified. They belong to five families: Ras, Rho, Rab, Ran, and Arf. They regulate a wide variety of cell functions as biological timers that initiate and terminate specific cell functions and determine the periods of time [24].
The transition from GDP-bound to GTP-bound states is catalyzed by a guanine nucleotide exchange factor (GEF), which induces exchange between the bound GDP and the cellular GTP. The reverse process is facilitated by a GTPase-activating protein (GAP), which induces hydrolysis of the bound GTP. Its dynamics can be described with the following equation with appropriate choice of the rates vGEF and vGAP:

Figure 12.14 illustrates the wiring of a Ras protein and the dependence of its activity on concentration ratio of the activating GEF and the deactivating GAP.
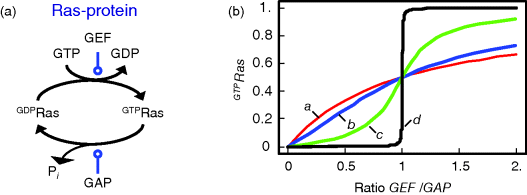
Figure 12.14 The Ras activation cycle. (a) Wiring diagram: GEF supports the transition form GDP-bound to GTP-bound states to activate Ras, while GAP induces hydrolysis of the bound GTP resulting in Ras deactivation. (b) Steady states of active Ras depending on the concentration ratio of its activator GEF and the inhibitior GAP. We compare the behavior for a model with mass action kinetics (curve a) with the behavior obtained with Michaelis–Menten kinetics for decreasing values of the KM-value (curves b–d). The smaller the KM-value, the more sigmoidal the response curve leading to an almost step-like shape in case of very low KM-values. Parameters:  ,
,  (all panels), (b)
  , (c)
, (c)  , (d)
, (d)  .
.
Mutations of the Ras protooncogenes (H-Ras, N-Ras, and K-Ras) are found in many human tumors. Most of these mutations result in the abolishment of normal GTPase activity of Ras. The Ras mutants can still bind to GAP, but cannot catalyze GTP hydrolysis. Therefore, they stay active for a long time.
12.2.3.3 Phosphorelay Systems
Most phosphorylation events in signaling pathways take place under consumption of ATP. Phosphorelay (or phosphotransfer) systems employ another mechanism: after an initial phosphorylation using ATP (or another phosphate donor), the phosphate group is transferred directly from one protein to the next without further consumption of ATP (or external donation of phosphate). Examples are the bacterial phosphoenolpyruvate:carbohydrate phosphotransferase [25–28], the two-component system of E. coli, or the Sln1 pathway involved in osmoresponse of yeast [29].
Figure 12.15 shows a scheme of a phosphorelay system from the high osmolarity glycerol (HOG) signaling pathway in yeast as well as a schematic representation of a phosphorelay system.
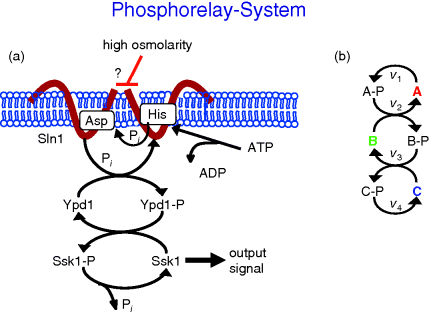
Figure 12.15 Schematic representation of a phosphorelay system. (a) Phosphorelay system belonging to the Sln1-branch of the HOG pathway in yeast. (b) General scheme of phosphorylation and dephosphorylation in a phosphorelay.
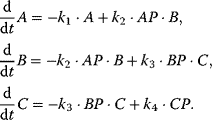
This pathway is organized as follows [30]. It involves the transmembrane protein Sln1, which is present as a dimer. Under normal conditions, the pathway is active, since Sln1 continuously autophosphorylates at a histidine residue, Sln1H-P, under consumption of ATP. Subsequently, this phosphate group is transferred to an aspartate group of Sln1 (resulting in Sln1A-P), then to a histidine residue of Ypd1 and finally to an aspartate residue of Ssk1. Ssk1 is continuously dephosphorylated by a phosphatase. Without stress, the proteins are mainly present in their phosphorylated form. The pathway is blocked by an increase in the external osmolarity and a concomitant loss of turgor pressure in the cell. The phosphorylation of Sln1 stops, the pathway runs out of transferable phosphate groups, and the concentration of Ssk1 rises. This constitutes the downstream signal. The temporal behavior of a generalized phosphorelay system (Figure 12.15) can be described with the following set of ODEs:
For the ODE system in Eq. (12.12), the following conservation relations hold

The existence of conservation relations is in agreement with the assumption that production and degradation of the proteins occurs on a larger time scale as the phosphorylation events.
The temporal behavior of a phosphorelay system upon external stimulation is shown in Figure 12.16. Before the stimulus, the concentrations of A, B, and C assume low, but nonzero, levels due to continuous flow of phosphate groups through the network. During stimulation, they increase one after the other up to a maximal level that is determined by the total concentration of each protein. After removal of stimulus, all three concentrations return quickly to their initial values.

Figure 12.16 Dynamics of the phosphorelay system. (a) Time courses after stimulation from time 100 to time 500 (a.u.) by decreasing  to zero. (b) Dependence of steady-state level of the phosphorelay output, C, on the cascade activation strength,
  , and the terminal dephosphorylation,
  . Parameter values:
  ,
,  ,
,  .
.
Figure 12.16b illustrates the dependence of the sensitivity of the phosphorelay system on the value of the terminal dephosphorylation. For a low rate constant  , for example,
  , the concentration C is low (almost) independent of the value of
  , while for high
  , for example,
  , the concentration C is (almost always) maximal. Changing of
  leads to a change of C-levels only in the range
  .
.
This system is an example for a case where we can draw initial conclusions about feasible parameter values just from the network structure and the task of the module.
12.2.3.4 MAP Kinase Cascades
Mitogen-activated protein kinases (MAPKs) are a family of serine/threonine kinases that transduce signals from the cell membrane to the nucleus in response to a wide range of stimuli. Independent or coupled kinase cascades participate in many different intracellular signaling pathways that control a spectrum of cellular processes, including cell growth, differentiation, transformation, and apoptosis. MAPK cascades are widely involved in eukaryotic signal transduction, and these pathways are conserved from yeast to mammals.
A general scheme of a MAPK cascade is depicted in Figure 12.17. This pathway consists of several levels (usually three to four), where the activated kinase at each level phosphorylates the kinase at the next level down the cascade. The MAP kinase (MAPK) is at the terminal level of the cascade. It is activated by the MAPK kinase (MAPKK) by phosphorylation of two sites, conserved threonine and tyrosine residues. The MAPKK is itself phosphorylated at serine and threonine residues by the MAPKK kinase (MAPKKK). Several mechanisms are known to activate MAPKKKs by phosphorylation of a tyrosine residue. In some cases, the upstream kinase may be considered as a MAPKKK kinase (MAPKKKK). Dephosphorylation of either residue is thought to inactivate the kinases, and mutants lacking either residue are almost inactive. At each cascade level, protein phosphatases can inactivate the corresponding kinase, although it is in some cases a matter of debate whether this reaction is performed by an independent protein or by the kinase itself as autodephosphorylation. Also ubiquitin-dependent degradation of phosphorylated proteins is reported.
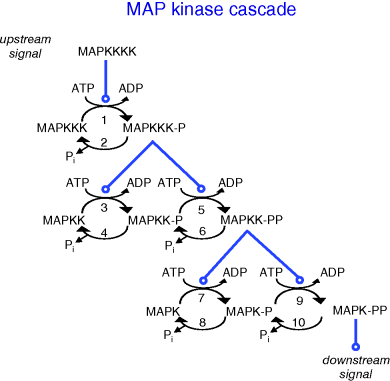
Figure 12.17 Schematic representation of the MAP kinase cascade. An upstream signal (often by a further kinase called MAP kinase kinase kinase kinase) causes phosphorylation of the MAPKKK. The phosphorylated MAPKKK in turn phosphorylates the protein at the next level. Dephosphorylation is assumed to occur continuously by phosphatases or autodephosphorylation.
Although they are conserved through species, elements of the MAPK cascade got different names in various studied systems. Some examples are listed in Table 12.1 (see also [31]).
Table 12.1 Names of the components of MAP kinase pathways in different organisms and different pathways.
| Organism | Budding yeast | Xensopus oocytes | Human, cell-cycle regulation | |||
| HOG pathway | Pheromone pathway | p38 pathway | JNK pathway | |||
| MAPKKK | Ssk2/Ssk22 | Ste11 | Mos | Rafs (c-, A-, and B-) | Tak1 | MEKKs |
| MAPKK | Pbs2 | Ste7 | MEK1 | MEK1/2 | MKK3/6 | MKK4/7 |
| MAPK | Hog1 | Fus3 | p42 MAPK | ERK1/2 | p38 | JNK1/2 |
In the following, we will present typical modeling approaches and then discuss functional properties of signaling cascades. The dynamics of a MAPK cascade may be represented by the following ODE system:

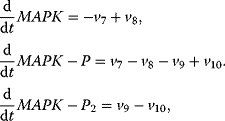
The variables in the ODE system fulfill a set of moiety conservation relations, irrespective of the concrete choice of expression for the rates  . It holds

The conservation relations reflect that we do not consider production or degradation of the involved proteins in this model. This is justified by the supposition that protein production and degradation take place on a different time scale as signal transduction.
The choice of the expressions for the rates is a matter of elaborateness of experimental knowledge and of modeling taste. We will discuss here different possibilities. Assuming only mass action results in linear and bilinear expressions such as

The kinetic constants  are first- (i even) and second-order (i odd) rate constants. In these expressions, the concentrations of the donor and acceptor of the transferred phosphate group, ATP and ADP, are not explicitly considered but included in the rate constants
  and
and  . Considering ATP and ADP explicitly results in
In addition, we have to care about the ATP–ADP balance and add three more differential equations

Here, we find two more conservation relations, the conservation of adenine nucleotides,  and the conservation of phosphate groups

One may take into account that enzymes catalyze all steps [32] and therefore consider Michaelis–Menten kinetics for the individual steps [33]. Taking again the first and second reactions as examples for kinase and phosphatase steps, we get
where  is a first-order rate constant,
  and
and  are Michaelis constants, and
  denotes a maximal enzyme rate. Reported values for Michaelis constants are 15 nM [33], 46 nM and 159 nM [34], and 300 nM [32]. For maximal rates, values of about
  [33] are used in models.
The performance of MAPK cascades, that is, their ability to amplify the signal, to enhance the concentration of the double phosphorylated MAPK notably, and the speed of activation, depends crucially on the kinetic constants of the kinases,  , and phosphatases,
  (Eq. (12.19)), and, moreover, on their ratio (see Figure 12.18). If the ratio
  is low (phosphatases stronger than kinases), then the amplification is high, but at very low absolute concentrations of phosphorylated MAPK. High values of
  ensure high absolute concentrations of MAPK-P2, but with negligible amplification. High values of both
  and
and  ensure fast activation of downstream targets.

Figure 12.18 Parameter dependence of MAPK cascade performance. Shown are steady-state simulations for changing values of rate constants for kinases, k+, and phosphatases, k− (in arbitrary units). Upper row: Absolute values of the output signal MAPK-PP depending on the input signal (high: MAPKKKK = 0.1 or low: MAPKKKK = 0.01) for varying ratio of k+/k−. Second row: ratio of the output signal for high versus low input signal (MAPKKKK = 0.1 or MAPKKKK = 0.01) for varying ratio of k+/k− right panel: time course of MAPK activation for different values of k+ and a ratio k+/k− = 20.
Frequently, the proteins of MAPK cascades interact with scaffold proteins. In this case, a reversible assembly of oligomeric protein complexes that includes both enzymatic proteins and proteins without known enzymatic activity precedes the signal transduction. These nonenzymatic components can serve as scaffolds or anchors to the plasma membrane and regulate the efficiency, specificity, and localization of the signaling pathway.
12.2.3.5 The Wnt/β-Catenin Signaling Pathway
The Wnt/β-catenin signaling pathway is an important regulatory pathway for a multitude of processes in higher eukaryotic systems. It has been found due to its role in tumor growth, especially through the use of mouse models of cancer and oncogenic retroviruses. However, it is also important in normal embryonic development. It is relevant for cell fate specification, cell proliferation, and cell migration or formation of body axis. Recently, its role in stem cell differentiation and reprogramming has been discussed.
In fact, the Wnt signaling comprises not just one pathway, but at least three pathways, that is, the canonical Wnt pathway, the noncanonical planar cell polarity pathway, and the noncanonical Wnt/calcium pathway. All three pathways employ binding of the Wnt ligand to the Frizzled receptors, but have different downstream architecture and effects (Figure 12.19). Wnt denotes a family of 19 genes (in vertebrates, other figures hold for other branches of the animal kingdom).
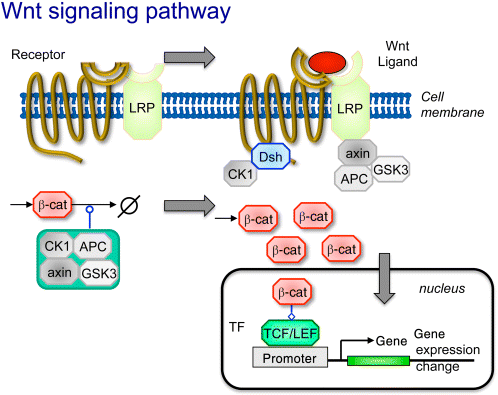
Figure 12.19 The Wnt signaling pathway. The receptor Frizzled is a G-protein-coupled receptor and frequently occurs together with a coreceptor such as LRP. Without Wnt signaling, β-catenin is continuously produced and degraded by the destruction complex comprising APC, axin, GSK3, and CK1, resulting in low β-catenin concentrations. Upon binding of the Wnt ligand, the phosphoprotein Dsh is recruited to the receptor. The destruction complex is reorganized, partially binding to the membrane proteins. β-catenin can accumulate, enter the nucleus and activate transcription factors leading to gene expression changes.
The major function of the canonical pathway is to stimulate the accumulation of β-catenin, which is normally kept at a low concentration through balanced continuous production and degradation by the destruction complex comprising adenomatous polyposis coli (APC), axin (axin1 or axin2), glycogen synthase kinase 3 (GSK3), and casein kinase 1a (CK1). This complex targets β-catenin for ubiquitination and proteasomal digestions. The G-protein-coupled receptor Frizzled often functions together with coreceptors, such as the lipoprotein receptor-related protein LRP or receptor tyrosine kinases. When the ligand Wnt binds to the receptor and its coreceptors, they recruit cytoplasmic proteins to the membrane (level 1 response, see Section 12.2.1): the phosphoprotein Dsh is recruited to the receptor, axin binds to LPR. The destruction complex is reorganized and the GSK3 activity is inhibited. β-catenin can accumulate (level 2 response). Among other consequences, it enters the nucleus and activates transcription factors leading to gene expression changes (level 4 response).
An early experiment-based model of the dynamics of the destruction complex and its regulation upon Wnt signaling investigated the quantitative roles of APC and axin (present in low amounts) [35]. They investigated which reaction steps would have high control (see concentration control coefficients introduced in Chapter 4) over the β-catenin concentration and found that strong negative control is exerted by the assembly of the destruction complex and the binding of β-catenin to the destruction complex. Positive control is exerted by reactions leading to the disassembly of the destruction complex, the dissociation of β-catenin from the destruction complex, the axin degradation, and the β-catenin synthesis.
Another model has analyzed the robustness of β-catenin levels in response to Wnt signaling [36]. They found that while the absolute levels of β-catenin are very sensitive to many types of perturbations, the fold changes in response to Wnt are not. Here fold change means the level of β-catenin after Wnt-stimulation divided by the level before Wnt-stimulation. An incoherent feed-forward loop can cause such a behavior [37].
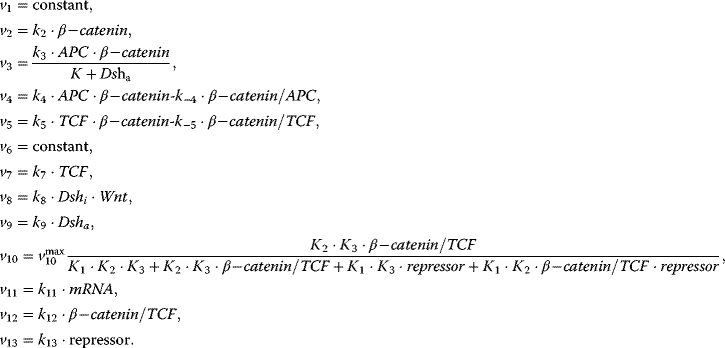
The following minimal model is suited to demonstrate major features of the canonical Wnt signaling pathway in wild-type and some mutant conditions [38]. The wiring of the model is shown in Figure 12.20. The ODE system reads
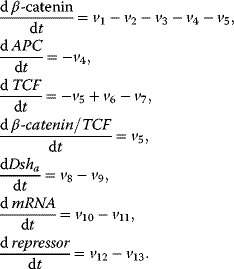
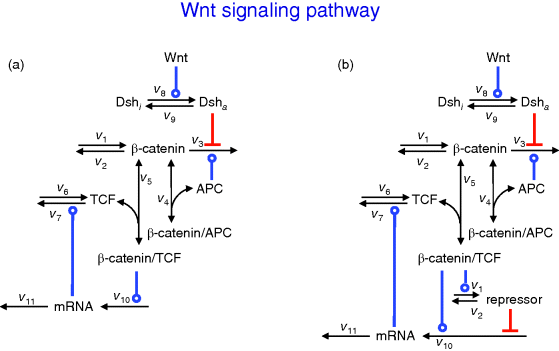
Figure 12.20 Wiring of the minimal model for the Wnt signaling pathway. (a) Basic model, (b) model including the incoherent feedforward loop via consideration of the repressor.
Conservation relations:

Rate equations:
The parameter values are  ,
,  ,
, ,
, ,
,  ,
, ,
,  ,
,  ,
,  ,
, ,
,  ,
,  ,
,  ,
,  ,
,  ,
,  ,
,  ,
,  , and
, and  .
.
The dynamics and steady-state behavior of the model are shown in Figure 12.21.
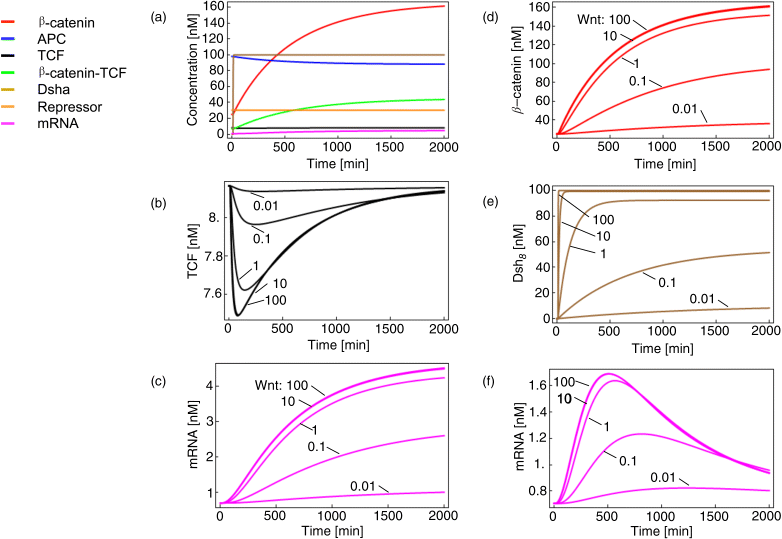
Figure 12.21 Time course simulations for the minimal model of the Wnt pathway as shown in Figure 12.20 and given by set (equation set 12.23). Panel (a) shows the response of all components to a Wnt stimulus of 100 nM at time point 10 min. All other panels: Wnt stimulus varies from 0.01 to 100 nM. We see saturation for Wnt above 10 nM. Panels (a)–(c) show simulations for the case without repressor, while panels (d)–(f) include a repressor. The effect of repressor is most obvious for mRNA dynamics shown in (c) and (f) where the presence of repressor leads to overshoot behavior.
12.2.4 Analysis of Dynamic and Regulatory Features of Signaling Pathways
12.2.4.1 Detecting Feedback Loops in Dynamical Systems
The existence of positive or negative feedback cycles in complex signaling networks that are described with ODE systems can be derived from the analysis of the Jacobian matrix M (see Chapter 4, Chapter 15, Eq. (15.39)) [39,40]. With  (
( ) being differential equations describing the dynamics of component xi and
  being the terms of the Jacobian
  , we can classify single nonzero terms of the Jacobian or sequences thereof as follows:
 for some i denotes direct autocatalysis,
 for some i denotes direct autoinhibition,
 for some i and j denotes a positive feedback including two components. It has been termed symbiosis for both
  or competition for both
  ,
, for some i and j denotes a negative feedback including two components,
 is a positive feedback of length
  , and
, and is a negative feedback of length
  .
.
Obviously, a feedback loop should not contain more than n elements  in a sequence (otherwise, it would be repetitive). Zero elements of the Jacobian in a sequence cut a feedback. An odd number of negative elements causes negative feedback, while a positive (or zero) number of negative terms leads to positive feedback.
Signaling pathways can exhibit interesting dynamic and regulatory features, such as other regulatory pathway. Dynamic motifs are discussed in detail in Section 8.2.
Among the various regulatory features of signaling pathways, negative feedback has attracted outstanding interest. It also plays an important role in metabolic pathways, for example, in amino acid synthesis pathways (Section 12.1.3), where a negative feedback signal from the amino acid at the end to the precursors at the beginning of the pathway prevents an overproduction of this amino acid. The implementation of the feedback and the respective dynamic behavior show a wide variation. Feedback can bring about limit cycle-type oscillations in cell-cycle models. In signaling pathways, negative feedback may cause an adjustment of the response or damped oscillations [41].
12.2.4.2 Quantitative Measures for Properties of Signaling Pathways
The dynamic behavior of signaling pathways can be quantitatively characterized by a number of measures [42]. Let  be the time-dependent concentration of the kinase i (or another interesting compound). The signaling time
  describes the average time to activate the kinase i. The signal duration
  gives the average time during which the kinase i remains activated. The signal amplitude
  is a measure for the average concentration of activated kinase i. The following definitions have been introduced. The quantity
is the total amount of active kinase i generated during the signaling period, that is, the integrated response of  (the area covered by a plot
  versus time). Further measures are


The signaling time can now be defined as
that is, as the average of time, analogous to mean value of a statistical distribution. Note that other definitions for characteristic times have been introduced in Section 6.3. The signal duration
gives a measure of how extended the signaling response is around the mean time (compatible to standard deviation). The signal amplitude is defined as
In a geometric representation, this is the height of a rectangle whose length is  and whose area equals the area under the curve
  . Note that this measure might be different from the maximal value
  that
that  assumes during the time course.
Figure 12.22 shows a signaling pathway with successive activation of compounds and the respective time courses. The characteristic quantities are given in Table 12.2 and for  shown in the figure.
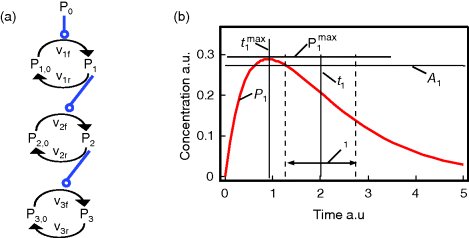
Figure 12.22 Characteristic measures for dynamic variables. (a) Wiring of an example signaling cascade with  ,
,  ,
,  ,
,  , and
, and  for
for  . (b) Time courses of
  . The horizontal lines indicate the concentration measures for
  , that is, the calculated signal amplitude
  and
and  , and vertical lines indicate time measures for
  , that is, the time
  of
of  , the characteristic time
  and the dotted vertical lines cover the signaling time
  .
.
Table 12.2 Dynamic characteristics of the signaling cascade shown in Figure 12.22.
| Compound | Integral, Ii | Maximum,  |
Time  , ,  |
Characteristic time,  |
Signal duration,  |
Signal amplitude, Ai |
| X1 | 0.797 | 0.288 | 0.904 | 2.008 | 1.458 | 0.273 |
| X2 | 0.695 | 0.180 | 1.871 | 3.015 | 1.811 | 0.192 |
| X3 | 0.629 | 0.133 | 2.855 | 4.020 | 2.109 | 0.149 |
12.2.4.3 Crosstalk in Signaling Pathways
Signal transmission in cellular context is often not unique in the sense that an activated protein has a high specificity for another protein. Instead, there might be crosstalk, that is, proteins of one signaling pathway interact with proteins assigned to another pathway. Strictly speaking, the assignment of proteins to one pathway is often arbitrary and may result, for example, from the history of their function discovery. Frequently, protein interactions form a network with various binding, activation, and inhibition events, such as illustrated in Figure 12.10.
In order to arrive at quantitative measures for crosstalk, let us consider the simplified scheme in Figure 12.23: External signal α binds to receptor A, which activates target A via a series of interactions. In the same way, external signal β binds to receptor B, which activates target B. In addition, there are events that mediate an effect of receptor B on target A.
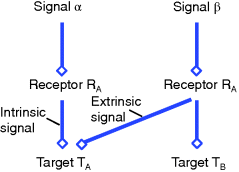
Figure 12.23 Crosstalk of signaling pathways.
Let us concentrate on pathway A and define all measures from its perspective. Signaling from α via RA to TA shall be called intrinsic, while signals from β to TA are extrinsic. Further, in order to quantify crosstalk, we need a quantitative measure for the effect of an external stimulus on the target. If we are interested in the level of activation, such a measure might be the integral over the time course of TA (Eq. (12.27)), its maximal value or its amplitude (Eq. (12.31)). If we are interested in the response timing, we can consider the time of the maximal value or the characteristic time (for an overview on measures see Table 12.2). Whatever measure we chose, shall be denoted by X in the following.
The crosstalk C is the activation of pathway A by the extrinsic stimulus β relative to the intrinsic stimulus α

The fidelity F [43] is viewed as output due to the intrinsic signal divided by the output in response to the extrinsic signal and reads in our notation:

In addition, the intrinsic sensitivity  expresses how an extrinsic signal modifies the intrinsic signal when acting in parallel, while the extrinsic sensitivity
  quantifies the effect of the intrinsic signal on the extrinsic signal, respectively [44]:

Table 12.3 shows how different specificity values can be interpreted.
Table 12.3 Effect of crosstalk on signaling.
| Se > 1 | Se < 1 | |
| Si > 1 | Mutual signal inhibition | Dominance of intrinsic signal |
| Si < 1 | Dominance of extrinsic signal | Mutual signal amplification |
12.3 The Cell Cycle
Growth and reproduction are major characteristics of life. Crucial for these is the cell division by which one cell divides into two and all constituents of the mother cell are distributed between the two daughter cells. This requires that the genome has to be duplicated in advance, which is accomplished by the DNA polymerase, an enzyme that utilizes deoxynucleotide triphosphates (dNTPs) for the synthesis of two identical DNA double strands from one parent double strand. In this case, each single strand acts as template for one of the new double strands. Several types of DNA polymerases have been found in prokaryotic and eukaryotic cells, but all of them synthesize DNA only in 5′ → 3′ direction. In addition to DNA polymerase, several further proteins are involved in DNA replication: proteins responsible for the unwinding and opening of the mother strand (template double strand), proteins that bind the opened single-stranded DNA and prevent it from rewinding during synthesis, an enzyme called primase that is responsible for the synthesis of short RNA primers that are required by the DNA polymerase for the initialization of DNA polymerization, and a DNA ligase that is responsible for linkage of DNA fragments that are synthesized discontinuously on one of the two template strands, because of the limitation to 5′ → 3′ synthesis. Like the DNA, also other cellular organelles have to be doubled, such as the centrosome involved in the organization of the mitotic spindle.
The cell cycle is divided into two major phases: the interphase and the M phase (Figure 12.25). The interphase is often a relatively long period between two subsequent cell divisions. Cell division itself takes place during M-phase and consists of two steps: first, the nuclear division in which the duplicated genome is separated into two parts, and second, the cytoplasmic division or cytokinesis, where the cell divides into two cells. The latter not only allocates the two separated genomes to each of the newly developing cells, but also distributes the cytoplasmic organelles and substances between them. Finally, the centrosome is replicated and divided between both cells as well.
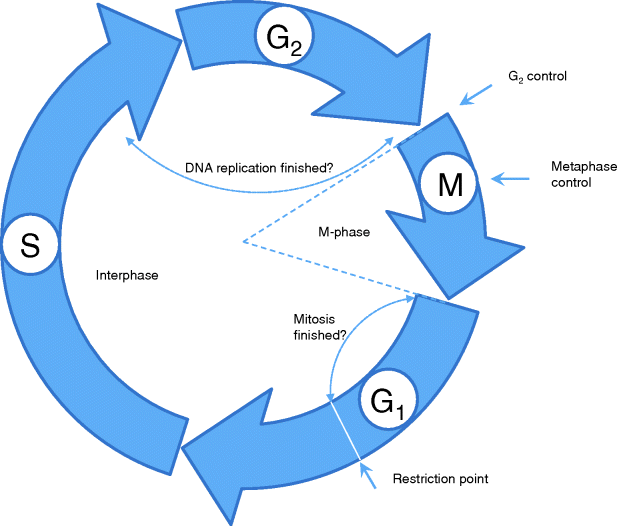
Figure 12.25 The cell cycle is divided into the interphase, which is the period between two subsequent cell divisions, and the M phase, during which one cell separates into two. Major control points of the cell cycle are indicated by arrows. More details are given in the text.
DNA replication takes place during interphase in the so-called S phase (S = synthesis) of the cell cycle (Figure 12.25). This phase is usually preceded by a gap phase, G1, and followed by another gap phase, G2. From G1 phase, cells can also leave the cell cycle and enter a rest phase, G0. The interphase normally represents 90% of the cell cycle length. During interphase, the chromosomes are dispersed as chromatin in the nucleus. Cell division occurs during M phase, which follows the G2 phase, and consists of mitosis and cytokinesis. Mitosis is divided into different stages. During the first stage – the prophase – chromosomes condense into their compact form and the two centrosomes of a cell begin recruiting microtubules for the formation of the mitotic spindle. In later stages of mitosis, this spindle is used for the equal segregation of the chromatids of each chromosome to opposite cellular poles. During the following prometaphase, the nuclear envelope dissolves and the microtubules of the mitotic spindle attach to protein structures, called kinetochores, at the centromeres of each chromosome. In the following metaphase, all chromosomes line up in the middle of the spindle and form the metaphase plate. During anaphase, the proteins holding together both sister chromatids are degraded and each chromatid of a chromosome segregates into opposite directions. Finally, during telophase, new nuclear envelopes are recreated around the separated genetic materials and form two new nuclei. The chromosomes unfold again into chromatin. The mitotic reaction is often followed by a cytokinesis where the cellular membrane pinches off between the two newly separated nuclei and two new cells are formed.
The cell cycle is strictly controlled by specific proteins. When a certain checkpoint, the restriction point, in the G1 phase is passed, this leads to a series of specific steps that end up in cell division. At this point the cell checks, whether it has achieved a sufficient size and whether the external conditions are suitable for reproduction. The control system ensures that a new phase of the cycle is only entered if the preceding phase has been finished successfully. For instance, to enter a new M phase it has to be assured that DNA replication during S phase has been correctly completed.
Passage through the eukaryotic cell cycle is strictly regulated by periodic synthesis and destruction of cyclins that bind and activate cyclin-dependent kinases (CDKs). The term “kinase” expresses that their function is phosphorylation of proteins with controlling properties. A contrary function is carried out by a “phosphatase.” It dephosphorylates a previously phosphorylated protein and thereby toggles its activity. Cyclin-dependent kinase inhibitors (CKI) also play important roles in cell-cycle control by coordinating internal and external signals and impeding proliferation at several key checkpoints.
The general scheme of the cell cycle is conserved from yeast to mammals. The levels of cyclins rise and fall during the stages of the cell cycle. The levels of CDKs appear to remain constant during cell cycle, but the individual molecules are either unbound or bound to cyclins. In budding yeast, one CDK (Cdc28) and nine different cyclins (Cln1–Cln3, Clb1–Clb6) are found that seem to be at least partially redundant. In contrast, mammals employ a variety of different cyclins and CDKs. Cyclins include a G1 cyclin (cyclin D), S phase cyclins (A and E), and mitotic cyclins (A and B). Mammals have nine different CDKs (referred to as CDK1-9) that are important in different phases of the cell cycle. The anaphase-promoting complex (APC) triggers the events leading to destruction of the cohesions, thus allowing the sister chromatids to separate and degrades the mitotic cyclins. A comprehensive map of cell cycle-related protein–protein interactions can be found in large-scale reconstructions, that is, for budding yeast [45].
12.3.1 Steps in the Cycle
Let us take a course through the mammalian cell cycle starting in G1 phase. As the level of G1 cyclins rises, they bind to their CDKs and signal the cell to prepare the chromosomes for replication. When the level of S phase promoting factor (SPF) rises, which includes cyclin A bound to CDK2, it enters the nucleus and prepares the cell to duplicate its DNA (and its centrosomes). As DNA replication continues, cyclin E is destroyed, and the level of mitotic cyclins begins to increase (in G2). The M phase-promoting factor (the complex of mitotic cyclins with the M-phase CDK) initiates (1) assembly of the mitotic spindle, (2) breakdown of the nuclear envelope, and (3) condensation of the chromosomes. These events take the cell to metaphase of mitosis. At this point, the M-phase promoting factor activates the APC, which allows the sister chromatids at the metaphase plate to separate and move to the poles (anaphase), thereby completing mitosis. APC destroys the mitotic cyclins by coupling them to ubiquitin, which targets them for destruction by proteasomes. APC turns on the synthesis of G1 cyclin for the next turn of the cycle and it degrades geminin, a protein that has kept the freshly synthesized DNA in S phase from being rereplicated before mitosis.
A number of checkpoints ensure that all processes connected with cell cycle progression, DNA doubling and separation, and cell division occur correctly. At these checkpoints, the cell cycle can be aborted or arrested. They involve checks on completion of S phase, on DNA damage, and on failure of spindle behavior. If the damage is irreparable, apoptosis is triggered. An important checkpoint in G1 has been identified in both yeast and mammalian cells. Referred to as “Start” in yeast and as “restriction point” in mammalian cells, this is the point at which the cell becomes committed to DNA replication and completing a cell cycle [46–49]. All the checkpoints require the services of complexes of proteins. Mutations in the genes encoding some of these proteins have been associated with cancer. These genes are regarded as oncogenes. Failures in checkpoints permit the cell to continue dividing despite damage to its integrity. Understanding how the proteins interact to regulate the cell cycle has become increasingly important to researchers and clinicians when it was discovered that many of the genes that encode cell cycle regulatory activities are targets for alterations that underlie the development of cancer. Several therapeutic agents, such as DNA-damaging drugs, microtubule inhibitors, antimetabolites, and topoisomerase inhibitors, take advantage of this disruption in normal cell cycle regulation to target checkpoint controls and ultimately induce growth arrest or apoptosis of neoplastic cells.
For the presentation of modeling approaches, we will focus on the yeast cell cycle since intensive experimental and computational studies have been carried out using different types of yeast as model organisms. Mathematical models of the cell cycle can be used to tackle, for example, the following relevant problems:
- The cell seems to monitor the volume ratio of nucleus and cytoplasm and to trigger cell division at a characteristic ratio. During oogenesis, this ratio is abnormally small (the cells accumulate maternal cytoplasm), while after fertilization cells divide without cell growth. How is the dependence on the ratio regulated?
- Cancer cells have a failure in cell-cycle regulation. Which proteins or protein complexes are essential for checkpoint examination?
- What causes the oscillatory behavior of the compounds involved in the cell cycle?
12.3.2 Minimal Cascade Model of a Mitotic Oscillator
One of the first genes to be identified as being an important regulator of the cell cycle in yeast was cdc2/cdc28 [50], where cdc2 refers to fission yeast and cdc28 to budding yeast. Activation of the cdc2/cdc28 kinase requires association with a regulatory subunit referred to as a cyclin.
A minimal model for the mitotic oscillator involving a cyclin and the Cdc2 kinase has been presented by Goldbeter [51]. It covers the cascade of posttranslational modifications that modulate the activity of Cdc2 kinase during cell cycle. In the first cycle of the bicyclic cascade model, the cyclin promotes the activation of the Cdc2 kinase by reversible dephosphorylation. In the second cycle, the Cdc2 kinase activates a cyclin protease by reversible phosphorylation. The model was used to test the hypothesis that cell-cycle oscillations may arise from a negative feedback loop with delay, that is, that cyclin activates the Cdc2 kinase, while the Cdc2 kinase eventually triggers the degradation of the cyclin.
The minimal cascade model is represented in Figure 12.26. It involves only two main actors, cyclin and cyclin-dependent kinase. Cyclin is synthesized at constant rate,  , and triggers the transformation of inactive (M+) into active (M) Cdc2 kinase by enhancing the rate of a phosphatase,
  . A kinase with rate
  reverts this modification. In the lower cycle, the Cdc2 kinase phosphorylates a protease (
 ) shifting it from the inactive (X+) to the active (X) form. The activation of the cyclin protease is reverted by a further phosphatase with rate
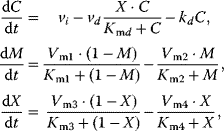
  . The dynamics is governed by the following ODE system:
where C denotes the cyclin concentration; M and X represent the fractional concentrations of active Cdc2 kinase and active cyclin protease, respectively, while  and
and  are the fractions of inactive kinase and phosphatase, respectively.
  values are Michaelis constants (Chapter 4).
  and
and  are effective maximal rates (Chapter 4). Note that the use of Michaelis–Menten kinetics in the differential equations for the changes of M and X leads to the so-called Goldbeter–Koshland switch or ultrasensitivity [52], that is, a sharp switch in the activity of the downstream component when the concentration of the activating component reaches the Km value.
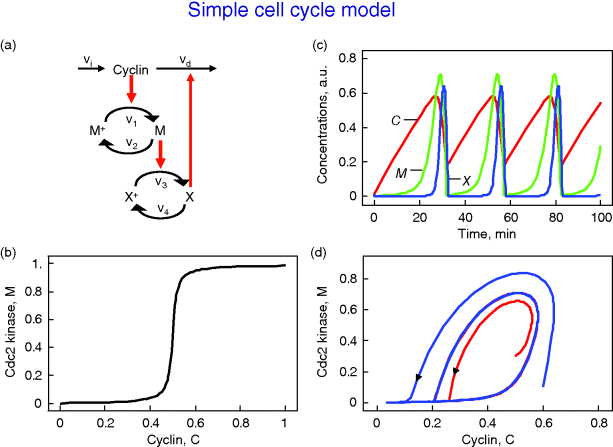
Figure 12.26 Goldbeter's minimal model of the mitotic oscillator. (a) Illustration of the model comprising cyclin production and degradation, phosphorylation and dephosphorylation of Cdk1, and phosphorylation and dephosphorylation of the cyclin protease (see text). (b) Threshold-type dependence of the fractional concentration of active Cdk1 on the cyclin concentration. (c) Time courses of cyclin (C), active Cdk1 (M), and active cyclin protease (X) exhibition oscillations according to Eq. (12.35). (d) Limit cycle behavior, represented for the variables C and M. Parameter values:  , (
, ( ),
),  ,
,  ,
,  ,
,  ,
,  ,
,  , and
, and  . Initial conditions in (b) and (c) are
  . Units: µM and min−1.
This model involves only Michaelis–Menten-type kinetics, but no form of positive cooperativity. It can be used to test whether oscillations can arise solely as a result of the negative feedback provided by the Cdc2-induced cyclin degradation and of the threshold and time delay involved in the cascade. The time delay is implemented by considering posttranslational modifications (phosphorylation/dephosphorylation cycles  and
and  ). For certain parameters, they lead to a threshold in the dependence of steady-state values for M on C and for X on M (Figure 12.26b). Provided that this threshold exists, the evolution of the bicyclic cascade proceeds in a periodic manner (Figure 12.26c). Starting from low initial cyclin concentration, this value accumulates at constant rate, while M and X stay low. As soon as C crosses the activation threshold, M rises. If M crosses the threshold, X starts to increase sharply. X in turn accelerates cyclin degradation and consequently, C, M, and X drop rapidly. The resulting oscillations are of the limit cycle type. The respective limit cycle is shown in phase-plane representation in Figure 12.26d.
12.3.3 Models of Budding Yeast Cell Cycle
Tyson, Novak, Chen and colleagues have developed a series of models describing the cell cycle of budding yeast in great detail [53–56]. These comprehensive models employ a set of assumptions that are summarized in the following.
The cell cycle is an alternating sequence of the transition from G1 phase to S/M phase, called “Start” (in mammalian cells it is called “restriction point”), and the transition from S/M to G1, called “Finish.” An overview is given in Figure 12.27.
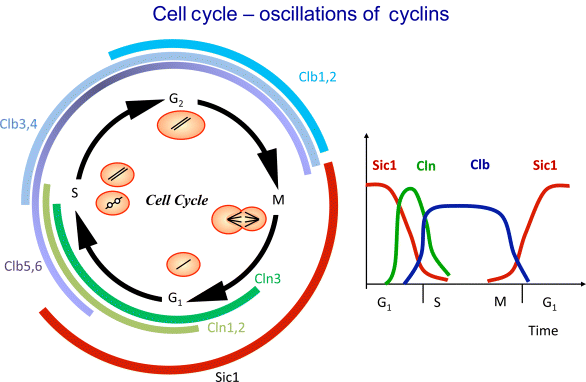
Figure 12.27 Schematic representation of the yeast cell cycle (inspired by Fall et al. [60]). The outer ring represents the cellular events. Beginning with cell division, it follows the G1 phase. The cells possess a single set of chromosomes (shown as one black line). At “Start,” the cell goes into the S phase and replicates the DNA (two black lines). The sister chromatids are initially kept together by proteins. During M phase they are aligned, attached to the spindle body, and segregated to different parts of the cell. The cycle closes with formation of two new daughter cells. The inner part represents main molecular events driving the cell cycle comprising (1) protein production and degradation, (2) phosphorylation and dephosphorylation, and (3) complex formation and disintegration. For sake of clarity, CDK Cdc28 is not shown. The “Start” is initiated by activation of CDK by cyclins Cln2 and Clb5. The CDK activity is responsible for progression through S and M phase. At Finish, the proteolytic activity coordinated by APC destroys the cyclins and renders thereby the CDK inactive.
The CDK (Cdc28) forms complexes with the cyclins Cln1 to Cln3 and Clb1 to Clb6, and these complexes control the major cell-cycle events in budding yeast cells. The complexes Cln1–2/Cdc28 control budding, the complex Cln3/Cdc28 governs the execution of the checkpoint “Start,” Clb5–6/Cdc28 ensures timely DNA replication, Clb3–4/Cdc28 assists DNA replication and spindle formation, and Clb1–2/Cdc28 is necessary for completion of mitosis.
The cyclin–CDK complexes are in turn regulated by synthesis and degradation of cyclins and by the Clb-dependent kinase inhibitor (CKI) Sic1. The expression of the gene for Cln2 is controlled by the transcription factor SBF, the expression of the gene for Clb5 is controlled by the transcription factor MBF. Both transcription factors are regulated by CDKs. All cyclins are degraded by proteasomes following ubiquitination. APC is one of the complexes triggering ubiquitination of cyclins.
For the implementation of these processes in a mathematical model, the following points are important. Activation of cyclins and cyclin-dependent kinases occurs in principle by the negative feedback loop presented in Goldbeter's minimal model (see Section 12.3.2). Furthermore, these models are based on the assumption that the cells exhibit exponential growth, that is, the dynamics of the cell mass M is governed by  . At the instance of cell division, M is replaced by
  . In some cases, uneven division is considered. Cell growth implies adaptation of the negative feedback model to growing cells.
The transitions “Start” and “Finish” characterize the wild-type cell cycle. At “Start,” the transcription factor SBF is turned on and the levels of the cyclins Cln2 and Clb5 increase. They form complexes with Cdc28. The boost in Cln2/Cdc28 has three main consequences: it initiates bud formation, it phosphorylates the CKI Sic1 promoting its disappearance, and it inactivates Hct1, which in conjunction with APC was responsible for Clb2 degradation in G1 phase. Hence, DNA synthesis takes place and the bud emerges. Subsequently, the level of Clb2 increases and the spindle starts to form. Clb2/Cdc28 inactivates SBF and Cln2 decreases. Inactivation of MBF causes Clb5 to decrease. Clb2/Cdc28 induces progression through mitosis. Cdc20 and Hct1, which target proteins to APC for ubiquitination, regulate the metaphase–anaphase transition. Cdc20 has several tasks in the anaphase. It activates Hct1, promoting degradation of Clb2, and it activates the transcription factor of Sic1. Thus, at “Finish,” Clb2 is destroyed and Sic1 reappears.
The dynamics of some key players in cell cycle according to the model given in Chen et al. [54] is shown in Figure 12.28 for two successive cycles. At “Start,” Cln2 and Clb5 levels rise and Sic1 is degraded, while at “Finish,” Clb2 vanishes and Sic1 is newly produced.
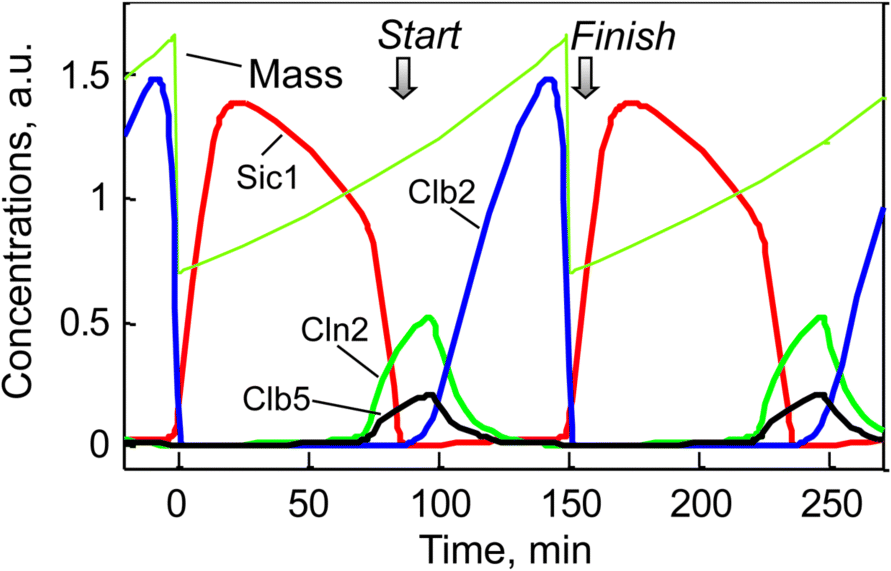
Figure 12.28 Temporal behavior of some key players during two successive rounds of yeast cell cycle. The dotted line indicates the cell mass that halves after every cell division. The levels of Cln2, Clb2total, Clb5total, and Sic1total are simulated according to the model presented by Chen et al. [54].
Recent models consider that cell growth is determined by nutrient uptake, nutrient conversion, and the resulting metabolic capacity to synthesis proteins, and are hence dependent on the cellular surface-to-volume ratio [57]. This results in individual growth dynamics between linear and exponential volume increase over time. Within a population context, this can elucidate why small young daughter cells need longer growth periods before division, while big mother cells divide again quickly, yet the population retains stable average cell sizes. This flexibility in cell-cycle length makes some specific assumptions dispensable about how to accomplish all cell-cycle steps in the given period, allowing to formulate self-oscillating models for the dynamics of the important components without artificial events at the end of one period (see Figure 12.29, [58]).
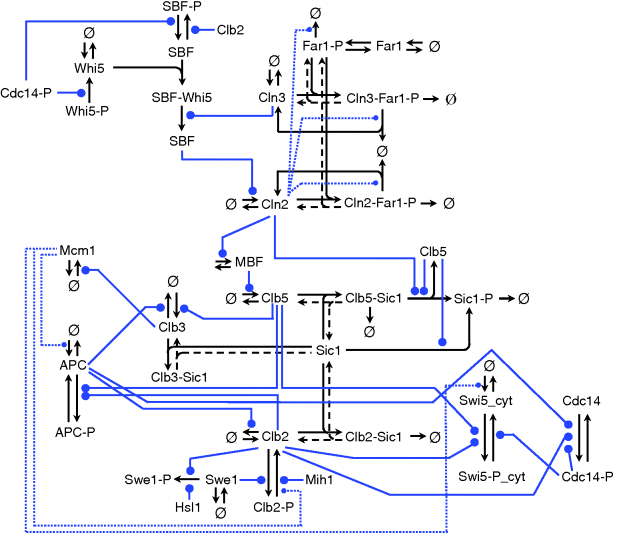
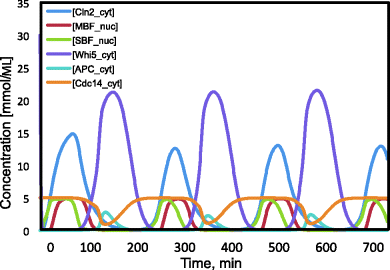
Figure 12.29 Self-oscillating network of yeast cell cycle. (a) The network comprises five cyclins (neglecting the potentially redundant cyclins Cln1, Clb6, Clb4, and Clb1) as well as transcription factors SBF and MBF, the cyclin-dependent kinase inhibitors Far1 and Sic1, and other regulators. (b) Dynamics of selected components over three cell cycle periods.
Cell cycle is strongly regulated by signaling pathways conveying information about external stresses (such as osmotic stress transmitted by the HOG pathway discussed in Section 12.2), about the nutritional status, or about the presence of mating partners (sensed via the pheromone pathway). The osmotic stress leads to pausing of cell cycle, providing time for adaptation such as production of osmotically active compounds, while the pheromone pathway triggers a complete cell cycle stop in early G1 phase allowing the cell to prepare for mating. Detailed models and experimentation helped to clarify the differential roles of transcriptional and posttranslation regulation by Hog1 in cell-cycle regulation upon osmotic stress [59].
12.4 The Aging Process
Aging is a complex biological phenomenon that practically affects all multicellular eukaryotes. It is manifested by an ever-increasing mortality risk, which finally leads to the death of the organism. Modern hygiene and medicine has led to an amazing increase in the average life expectancy over the last 150 years, but the underlying biochemical mechanisms of the aging process are still poorly understood. However, a better comprehension of these mechanisms is increasingly important, since the growing fraction of elderly people in the human population confronts our society with completely new and challenging problems. The aim of this chapter is to provide an overview of the aging process, discuss how it relates to system biological concepts, and to discuss some specific examples that make use of interesting modeling techniques such as delay differential equations and stochastic simulations.
What is Aging?
Looking at the enormous rise of average human life span over the last 150 years, one could get the impression that modern research actually has identified the relevant biochemical pathways involved in aging and has successfully reduced the pace of aging. Oeppen and Vaupel [61] collected data on world-wide life expectancy from studies going back to 1840. Figure 12.30 shows the life expectancy for males (squares) and females (circles) for the country that had the highest life expectancy at a given year. Two points are remarkable. First, there is an amazingly linear trend in life expectancy that corresponds to an increase of 3 months per year (!), and second, this trend is unbroken right to the end of the analyzed data (year 2000).
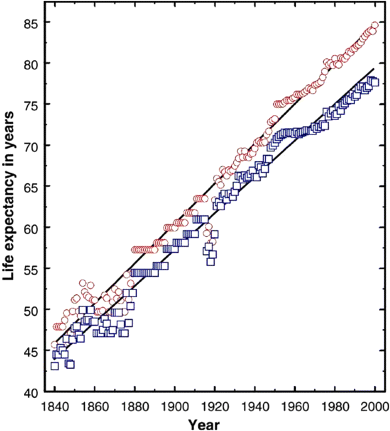
Figure 12.30 Male (blue squares) and female (red circles) life expectancy in the world record holding country between 1840 and 2000 based on the annual data of countries worldwide. (Reproduced with permission from Ref. [61].).
These impressive data strongly suggest that life span will also continue to rise in the next years, but it is not suitable to decide if the actual aging rate has fallen during the last century. Aging can best be described as a gradual functional decline, leading to a continuously rising risk to die within the next time interval (mortality). Already in the nineteenth century, Gompertz and Makeham studied the rise of human mortality with age and found that it can be described extremely well by an exponential function [62,63]. The Gompertz–Makeham equation,  , models the increase of mortality with age depending on three parameters called intrinsic vulnerability (µ0), actuarial aging rate (ß), and environmental risk (γ). From this equation, an expression for the survivorship function can be derived (see Section 12.4.1 and [64]), which shows that the number of remaining survivors depends on all three parameters and consequently a change of the median life expectancy (time until 50% of the population has died) can be caused by a modification of any of those parameters. Analyzing the survivorship data of the last 100 years more closely, it becomes clear that the remarkable increase in life expectancy was achieved exclusively by changes of intrinsic vulnerability and environmental risk. However, the aging rate, ß, remained constant all the time. This is remarkable and important because it is actually ß that most strongly controls life expectancy. Because of the drastic social, economical, and political consequences that are brought about by the demographic changes of the age structure of the population, it is now more important than ever to understand what constitutes the biochemical basis for a nonzero aging rate, ß. Systems biology might help to achieve this goal.
Why is Aging a Prime Candidate for Systems Biology?
Evolutionary theories of the aging process explain why aging has evolved, but unfortunately they do not predict specific mechanisms to be involved in aging. As a consequence, more than 300 mechanistic ideas exist [65], each centered around different biochemical processes. This is partly due to the fact that even the simplest multicellular organisms are such complex systems that many components have the potential to cause deterioration of the whole system in case of a malfunction. Figure 12.31 shows a small collection of the most popular mechanistic theories. The spatial arrangement of the diagram intends to reflect the various connections between the different theories. And it is exactly the large number of interactions that makes it so difficult to investigate aging experimentally and renders it ideal for systems biology. To understand this, we will look at a few examples.
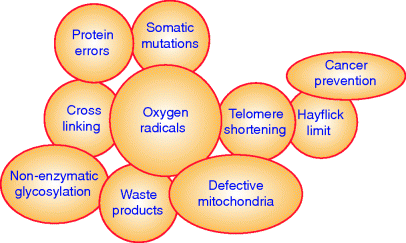
Figure 12.31 Graphical representation of some mechanistic theories of aging. The topology of the diagram reflects logical and mechanistic overlaps and points of interaction between different theories.
The Telomere Shortening Theory is an important idea that has gained considerable support in the last 15–20 years. Telomeres are the physical ends of linear eukaryotic chromosomes and vital for the functioning of the cell [66,67]. It has been recognized for a long time that linear DNA has a replication problem, since DNA polymerases can only replicate in the 5′–3′ direction and cannot start DNA synthesis de novo [68,69]. This inability leads to a gradual loss of DNA, which was confirmed experimentally for human fibroblasts in 1990 and consequently proposed as being responsible for aging [70,71]. Telomere shortening provides the explanation and connection to the Hayflick Limit, the long known phenomenon that most cultured cell types have only a limited division potential [72]. This in turn can be interpreted as evolutionary selected trait that acts as a cancer prevention system by preventing unlimited cell division. While the direct cause of telomere shortening is the lack of the enzyme telomerase, there is an interaction to oxygen radicals that complicates the mechanism. Oxidative stress was shown to increase the rate of telomere shortening and thus modulating the telomere attrition [73]. As the figure indicates, free oxygen radicals are also the central hub to several other prominent phenomena affecting the aging process. They damage all kinds of macromolecules, leading to cross-linking of proteins and the generation of indestructible waste products (i.e., lipofuscin) that accumulate in slowly dividing cells [74]. Degraded mitochondria are supposed to be a major fraction of these waste products and certain oxygen radicals are known to damage the mitochondrial membrane. It seems, however, that radical-induced somatic mutations of the mitochondrial DNA (mtDNA) are the main route to defective mitochondria that produce less energy, but generate more radicals [75–77]. These mutants are capable of taking over the mitochondrial population of the cell, causing a chronic energy deficiency and maybe aging. It is still unclear what the selection pressure and mechanism is that leads to the accumulation of defective mitochondria, but several suggestions have been made [78–80].
Supporting evidence has been found for all the above-mentioned ideas and the many interdependencies make aging a phenomenon that is very difficult to study experimentally. If a single mechanism is studied in isolation, it is hard to interpret the results that were obtained without the contribution of the other mechanisms. And if a complex system is studied with all involved pathways, it is expensive, technically demanding, and the results are difficult to interpret because of the large number of factors that might have influenced the results.
This is exactly the situation where a systems biological approach is useful. Systems biology aims at investigating the components of complex biochemical networks and their interactions, applying experimental high-throughput and whole genome methods, and integrating computational and mathematical methods with experimental efforts. The growing number of high-throughput techniques that have been developed in the last years is a major driving force behind the wish to utilize computational methods to manage and interpret the high data output. Modelers, on the other side, are keen to use the generated data to develop quantitative models of systems with complex interactions. Because of the large number of parameters, such models would not be meaningful without sufficient experimental measurements.
In addition, quantitative modeling of complex systems has several benefits. First of all, it requires that each aspect of a verbal hypothesis is being made specific. Before a computational model can be developed, the researcher has to define each component and how it interacts with all the other components. This is a very useful exercise to identify gaps in current knowledge and in the verbal model. It helps to complete the conceptual model, respectively motivates experiments to collect the missing experimental information. To understand complex systems with components that produce opposing effects, it is essential to have a model with quantitative predictions. Purely qualitative models (such as verbal arguments) are not sufficient to decide how a system develops over time if it contains nonlinear opposing subcomponents. Computational models are also a convenient way to explore easily and cheaply “what if” scenarios that were difficult or impossible to test experimentally. What if a certain reaction would not exist? What if a certain interaction would be ten times stronger? What if we are interested in time spans too short or too long to observe in an experiment? First, we will study a model that deals with the evolution of the aging process (Section 12.4.1) followed by models that make use of stochastic modeling (Section 12.4.2) or use delay differential equations (Section 12.4.3) to understand the accumulation of damaged mitochondria.
12.4.1 Evolution of the Aging Process
It is not obvious why organisms should grow old and die. What is the selective advantage of this trait? And if aging is advantageous, why have different species such widely differing life spans?
The first attempt to explain the evolution of aging was made by Weismann [81]. He proposed that aging is beneficial by removing crippled and worn-out individuals from the population and thus making space and resources available for the next generation. This type of reasoning is very similar to other suggestions like the prevention of overcrowding or the acceleration of evolution by decreasing the generation time.
These ideas suggest that aging itself confers a selective advantage and that the evolution of genes that bring life to an end is an adaptive response to selective forces. All these theories have in common that they rely on group selection, the selection of a trait that is beneficial for the group, but detrimental to the individual. However, group selection only works under very special circumstances like small patch size and low migration rates [82].
The weaknesses of adaptive theories have been recognized for some time and newer theories are no longer based on group selection, but on the declining force of natural selection with time. This important concept refers to the fact that, even in the absence of aging, individuals in a population are always at risk of death due to accidents, predators, and diseases. For a given cohort, this leads to an exponential decline over time in the fraction of individuals that are still alive. Events (e.g., biochemical processes) that occur only in chronologically old individuals will therefore only affect a small proportion of the whole population. The later the onset of the events, the smaller the involved fraction of the population.
Medawar [83] was the first to present a theory for the evolution of the aging process based on this idea. His “Mutation Accumulation” theory states that aging might be caused by an accumulation of deleterious genes that are only expressed late in life. Because of the declining force of natural selection, only a small part of the population would be affected by this type of mutation and the resulting selection pressure to remove them would only be very weak. Mutations with a small selection pressure to be removed can persist in a mutation–selection balance [84] and thus explain the emergence of an aging phenotype.
Another theory of this kind is the “Antagonistic Pleiotropy” theory [85]. Genes that affect two or more traits are called pleiotropic genes, and effects that increase fitness through one trait at the expense of a reduced fitness of another trait are antagonistic. Now, consider a gene that improves the reproductive success of younger organisms at the expense of the survival of older individuals. Because of the declining force of natural selection, such a gene will be favored by selection and aging will occur as a side effect of the antagonistic pleiotropy property of this gene. Possible candidate genes might be found in males and females. Prostate cancer appears frequently in males at advanced ages, but can be prevented by administration of female hormones or castration. It seems to be a consequence of long-term exposure to testosterone, which is necessary for male sexual and thus reproductive success. In older females, osteoporosis is mediated by estrogens that are essential for reproduction in younger women. In both cases, gene effects that are beneficial at younger ages have negative consequences later in life.
Genes that trade long-term survival against short-term benefit are probably the strongest candidates to explain the aging process. A specific version of this hypothesis that connects evolutionary concepts with molecular mechanisms is the “Disposable Soma” theory [86,87]. The theory realizes that organisms have a finite energy budget (food resources) that must be distributed among different tasks like growth, maintenance, and reproduction. Energy spent for one task is not available for another. Organisms have to solve this resource allocation problem such that evolutionary fitness is maximized. On the basis of quite general assumptions, a mathematical model can be constructed that describes the relationship between investment in maintenance and fitness. We are going to have a closer look at this model as an example how to formulate a mathematical description of such a qualitative idea.
To get started, we need a mathematical concept of fitness. A standard measure that is often used in population genetics is the intrinsic rate of natural increase, r, (also called Malthusian parameter) that can be calculated by numerically solving the Euler–Lotka (equation 12.36). To calculate r for a given genotype, the survivorship function, l(t), and the fertility function, m(t), have to be known. l(t) denotes the probability that an individual survives to age t and m(t) is the expected number of offspring produced by an individual of age t.
If the value of r that solves this equation is negative, it implies a shrinking population, if it is positive, the population grows. Thus, the larger r, the higher is the fitness. An exact derivation of the Euler–Lotka equation is outside the scope of this book, but can be found in Maynard Smith [88] or Stearns [89]. Investment in somatic maintenance and repair will affect both, survivorship and fertility, and the question remains whether there is an optimal level of maintenance that maximizes fitness. Unfortunately, the precise physiological trade-offs are unknown, so we have to develop some qualitative relationship. It was already mentioned that in many species mortality increases exponentially according to the Gompertz–Makeham (equation 12.37) [63]. μ0, β, and γ represent basal vulnerability, actuarial aging rate, and age-independent environmental mortality, respectively.
Mortality and survivorship are connected via the relation  . By solving this equation, we obtain an expression for l(t) that depends on two parameters that are influenced by the level of maintenance, μ0 and β (12.38). We now define the variable ρ to be the fraction of resources that are allocated for maintenance and repair, ρ = 0 corresponding to zero repair and ρ = 1 corresponding to the maximum that is physiologically possible. We also make the assumption that above a critical level of repair, ρ*, damage does not accumulate and the organism has reached a nonaging state. The rational for this postulation is the idea that aging is caused by the accumulation of some kind of damage and by investing more in repair the accumulation rate is slowed down until finally the incidence rate is equal to the removal rate, in which case the physiological steady state can be maintained indefinitely. The modifications to μ0 (12.39) and β (12.40) are only one way to implement the desired trade-off (decreasing μ0 and β with increasing ρ), but in qualitative models like this, the main results are often very robust with regard to the exact mathematical expression used.
The level of maintenance does also influence fertility, m(t). It is assumed that the age at maturation, a, will increase with rising ρ and that the initial reproductive rate, f, is a decreasing function of ρ. We furthermore assume that fertility declines due to age-related deterioration with the same Gompertzian rate term as survivorship. From these conditions, equations can be derived for fertility (12.41), age at maturation (12.42), and initial reproductive rate (12.43).
Now we have all the information that are necessary to solve the Euler–Lotka equation for different values of repair, ρ, (Figure 12.32). The calculations confirm that there exists an optimal level of maintenance, ρopt, which results in a maximal fitness. Depending on the ecological niche (represented by environmental mortality, γ), the optimal amount of maintenance varies. In a risky environment, the optimum is shifted toward lower maintenance and a niche with low external mortality, selects for individuals with a relatively high investment in maintenance.
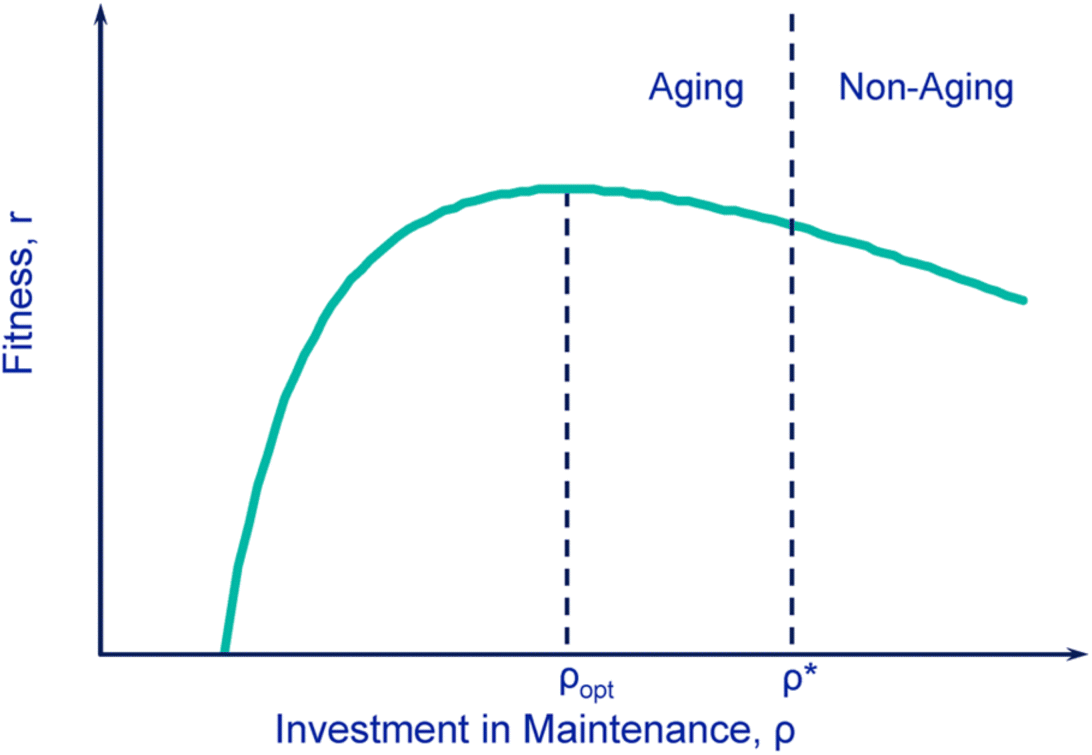
Figure 12.32 The disposable soma theory predicts that the optimal investment in maintenance is always less then what would be required to achieve a nonaging state. The exact position of this optimum (which maximizes fitness) depends on the environmental risk a species is exposed to over evolutionary times. Organisms living in a niche with heavy external mortality should invest less in maintenance than organisms that are exposed to little external mortality.
This fits quite nicely with biological observation. Species like mice or rabbits live in a high-risk environment and, as predicted, they invest heavily in offspring but have little left for maintenance. Consequently, their aging rate is high and life expectancy low (even under risk-free laboratory conditions). Humans or elephants, by contrast, inhabit a low-risk environment, spend fewer resources for offspring, and invest more in repair. Especially instructive are birds, which live two to three times as long as mammals of comparable body weight. Again, this long life span can be predicted by the enormous reduction of external mortality that accompanies the ability to fly and thus escape predators or starvation.
Another important result of the model is that the optimal level of maintenance and repair is always below the critical level, ρ*, that is required for the evolution of a nonaging organism. This result can also be understood intuitively. Since all species have an external mortality that is above zero, they have a finite life expectancy, even without aging. This means, even though it might be physiological possible to have such an efficient repair system that damage does not accumulate with time, resulting in a potentially immortal organism, this never results in a maximal fitness value. Only in the limit of γ = 0, ρopt approaches ρ*.
12.4.2 Using Stochastic Simulations to Study Mitochondrial Damage
The Biological Problem
It was already mentioned that defective mitochondria accumulate in old cells. These organelles developed roughly two billion years ago from free-living prokaryotic ancestors [90]. This endosymbiotic origin also explains the fact that mitochondria still contain their own genetic material in form of a small circular DNA, named mtDNA. During the course of evolution most mitochondrial genes were transferred to the nucleus, but the genes for 13 proteins are still located on the human mtDNA [91]. Mitochondria are involved in several essential processes like apoptosis, calcium homeostasis, and fatty acid degradation, but their most important task is the generation of ATP via oxidative phosphorylation at the inner mitochondrial membrane. All of the proteins encoded on the mtDNA are involved in this process. Since ATP is essential for thousands of biochemical reactions, it could very well be that damage to the “powerhouses of the cell” is a major contributor to the aging process.
Many studies have shown that damage to mtDNA accumulates with age in various mammalian species such as rats, monkeys, and humans [92–97]. The most prominent type of damage seems to be deletion mutations, which have lost up to 50% of the total mtDNA sequence. These mutants then accumulate in a cell, overtaking the wild-type population of mitochondria. Cells containing damaged mitochondria can be identified by staining for enzymatic activity and Figure 12.33 shows a characteristic result of a muscle cross-section of a 38-months-old rat. Affected cells are typically negative for the mitochondrially encoded enzyme cytochrome-c oxidase (COX) and overexpress the nuclear-encoded enzyme succinate dehydrogenase (SDH). It can be seen that the cross-section displays a mosaic pattern with most cells being healthy and interspersed a few cells with effectively no COX activity at all. Furthermore, the experimental studies have shown that in each COX negative cell, it is a single type of deletion mutant that is clonally expanded, and different COX negative cells are overtaken by different clonally expanded deletion mutants.

Figure 12.33 Enzymatic staining for COX and SDH activity of a muscle cross section from a 38-month-old rat. The muscle fibers marked by “X” show a COX− (a) and SDH++ (b) phenotype, while the neighboring cells present the healthy wild-type phenotype. The black bar represents 50 µm. (Reproduced with permission from Ref. [92].)
The challenge is now to identify a biochemical mechanism that can explain these experimental findings. That is, it has to explain (i) why deletion mutants accumulate in the presence of wild-type mtDNA, (ii) why it is always a single mutant and not several that are present in an affected cell (low heteroplasmy), and (iii) how such a mechanism can work for species with life spans ranging from 3 to 100 years. An interesting hypothesis that has been put forward and that we want to study in more detail is the idea that pure random drift might be sufficient to explain this clonal expansion [98,99]. Elson et al. [98] simulated a population of 1000 mtDNAs with a 10 day half-life and a deletion probability between 10−6 and 10−4 per replication event. They defined COX negative cells as those that contain more than 60% mutant mtDNA at the end of the simulation and showed that, after 120 years, between 1 and 10% COX negative cells had a degree of heteroplasmy compatible with experimental observations. However, can such a process also work for short-lived animals like rodents, which show a similar pattern of accumulation as in humans but on a greatly accelerated time scale [92,96]?
Modeling Approach
How can such an idea be modeled mathematically? This is an interesting problem, since the standard approaches are not applicable in this special case. Most often the time course of the biological entities to be modeled (molecules, cells, and organisms) is described by differential equations, which are then solved analytically or more often numerically by a suitable software tool. However, we cannot use differential equations to describe the fate of wild-type and mutant mtDNAs because the hypothesis assumes that all mtDNAs have identical parameter values for growth and degradation. Thus, in the deterministic case, the number of mutant mtDNAs would always remain at their initial value after the mutation event, which is 1. So, we have here a situation where the system must be modeled stochastically, since the proposed explanation relies completely on random effects. Normally we would use one of the simulation tools that are capable to perform stochastic simulations such as Copasi or VirtualCell, but it turns out that this, too, is not possible in our situation. The problem is that we have an undetermined number of variables. Each time a deletion event happens, it creates a new type of mutant, that is, per definition, different from all currently existing ones in the cell. This effectively creates a new variable in our model, whose time course we need to follow. Furthermore, there is no way to know how many of these new variables will be created during the course of the simulation. This behavior cannot be handled by classical tools for stochastic simulations.
The only solution in such a case is to write a computer program that is tailor made for the specific problem. Exactly, this has been done by Kowald and Kirkwood [100] and in the following we will have a closer look at the source code. Stochastic simulations are always computationally demanding and thus a suitable programming language such as Java or C/C++ should be chosen. In our case, a Java program was developed within the Eclipse IDE. We cannot discuss the whole program, but instead will concentrate and comment on the core number crunching routine.
Stochastic simulations only generate single trajectories and therefore it is necessary to perform many repetitions to calculate meaningful statistics (e.g., fraction of COX negative cells). At line 121, this outer loop starts, which performs Nrepeats repetitions. In the next lines, important program variables are initialized for the next trajectory simulation, which starts at line 130. A central step during program development is the choice of suitable data structures to hold the state variables of the system. In this example, mitoL is a simple list of integers that holds the number of wild-type mtDNAs followed by the numbers of one or more mutant mtDNAs. The simulation progresses in fixed time intervals of 1 h until the simulation time is reached or all wild-type mtDNAs are lost (line 130). This is similar to the τ-leap method (see Section 7.2.3) with the difference that the time interval is much shorter than the average time interval of the modeled reactions (mtDNA degradation & replication). In lines 131–137, the program collects and stores information about the number of type of mutants in ergL. This happens only every 30 days to keep the amount of data at a manageable size.
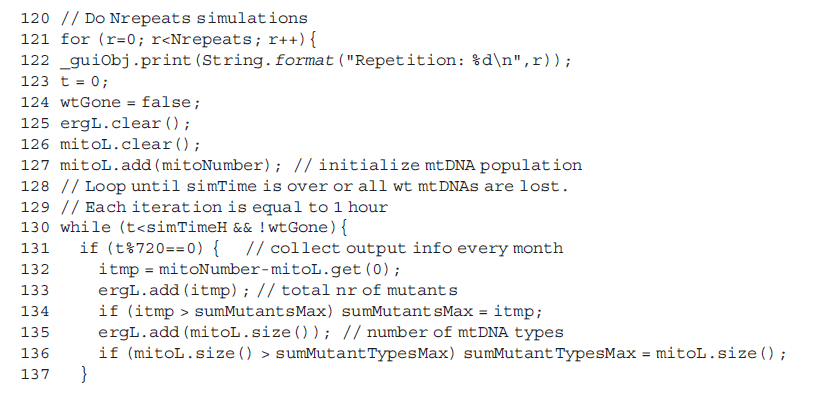
In the “for loop” starting at line 141, the program iterates through all different types of mtDNA and the small loop from line 145–147 calculates how many molecules should be degraded during this time step and at line 148 the number of existing mtDNAs is reduced accordingly. This is the place where stochasticity enters the simulation. The “if clause” starting at 151 checks if all wild-type mtDNAs have been lost and performs some necessary bookkeeping in that case. Finally, line 164 removes elements from mitoL that are zero. These stem from entries for mutant mtDNAs that have been completely eradicated by degradation.
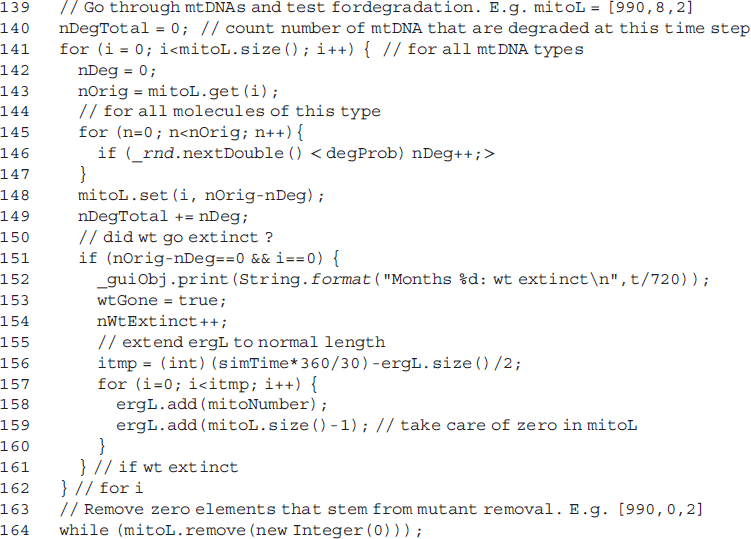
The model implements a very simple mechanism for replacing degraded mtDNAs. Exactly the same number that is degraded, is newly synthesized via replication, such that the total number of mtDNAs is always equal to mitoNumber. This is a typical example how certain aspects of biology are simplified for mathematical modeling because they are not relevant for the modeled problem or because more details are not known. Within the “for loop” starting at line 168, the new mtDNAs are created by making a copy of a randomly chosen (line 169) parent mtDNA. Since mtDNAs are arranged by types within mitoL, some lines of code (171–175) are necessary to identify the parent type. During the replication process a deletion can happen, creating a new mutant type. This depends on the parameter mutProb and is implemented by lines 177–181. That completes the computations for this time step and in line 185 the number of simulated hours is increased by one until simTimeH has been reached.
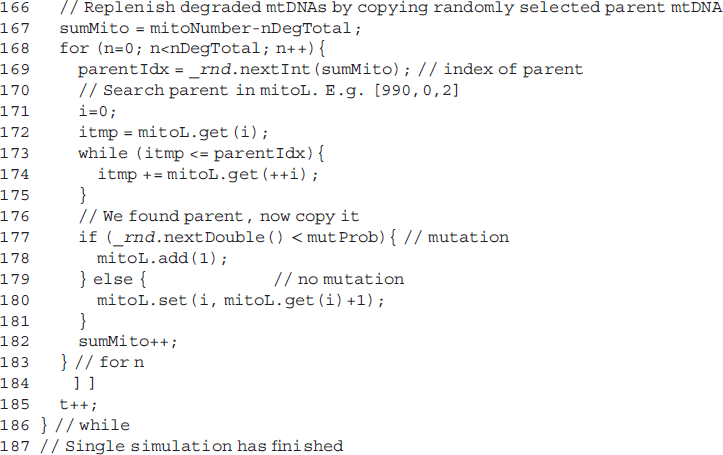
If the wild type has been lost or we have less than 40% wild-type mtDNAs (line 189), we keep track of this by incrementing some counter variables (190–199). Finally, we write the data that were collected on a monthly basis to an output file (204–209). Thus, for each repetition one long line of text is generated with the monthly count of the total number of mutants and another long line with the monthly count of the number of different mutant types. This concludes our inspection of the simulation code and in the next section we look at some of the results that can be obtained from the simulation data.
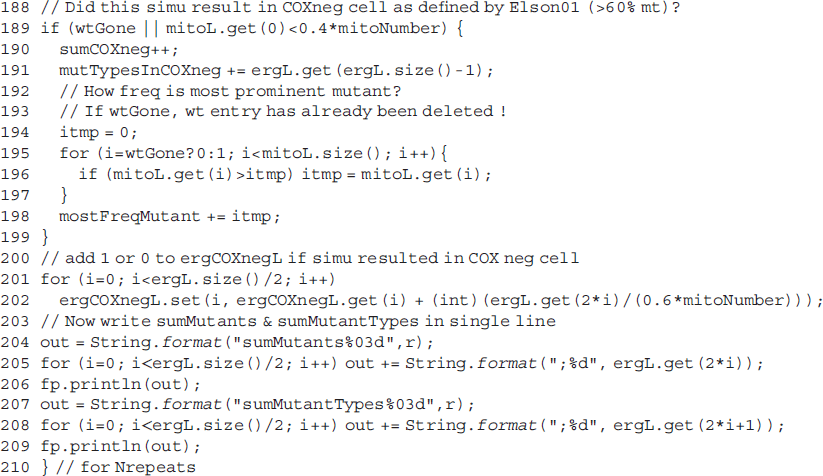
Results
The output of the simulation program is a collection of trajectories describing how many mutant mtDNAs accumulate with time and to how many different mutant types they belong. Figure 12.34(a) shows three typical trajectories for a simulation lasting for 120 years. During one simulation (black), some mutant mtDNAs appear after approx. 20 years and reach roughly 200 copies, which correspond to 20% of the total mtDNA population. However, random fluctuations cause these mutants to disappear again and after 120 years this simulation ends with a healthy cell, containing no mutant mtDNAs. The simulation shown in red displays a completely different behavior. After about 60 years, there is a sharp rise in mutant mtDNAs that completely replace the wild type around year 95. Once all wild-type mtDNAs are lost, the simulation has reached an absorbing boundary condition since there is no way to recreate wild-type mtDNAs.
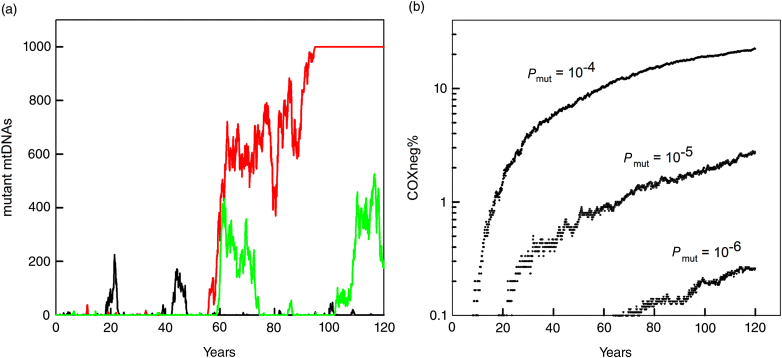
Figure 12.34 (a) Three single trajectories showing the appearance of mutant mtDNAs in a population that initially consists of 1000 wild-type molecules. After 120 years, the mutant mtDNA has either overtaken the population (red), has gone extinct (black) or exists at an intermediate level (green). mtDNA half-life is 10 days and the mutation probability per replication is 4 × 10⁻⁵. (b) Increase in COX negative cells with time for three different mutation rates. A cell is defined as COX negative if it contains more than 60% mutant mtDNAs. The curves for Pmut = 10−4 and 10−5 are calculated from 3000 trajectories and from 15 000 in case of Pmut = 10−6.
By calculating a large number of trajectories, interesting statistical insights can be obtained. Figure 12.34(b) illustrates the increase in COX negative cells calculated from 3000 (Pmut = 10−4 and 10−5) respectively 15 000 trajectories (Pmut = 10−6). The larger number of simulations for the low mutation rate is necessary to obtain a “smooth” curve. Experimentally, it is known that around 4% of postmitotic human cells are COX negative after 80 years [93,101], which means that a mutation rate of 10−5–10−4 per replication is compatible with these results.
As mentioned earlier an important experimental observation is the low degree of mtDNA heteroplasmy for species with widely different life spans. To study this phenomenon, stochastic simulations were performed for different life spans (3, 10, 40, 80, and 120 years) and the average number of different mtDNA types per COX negative cell is shown in Figure 12.35. Since the level of COX negative cells in old individuals of species like rat and man is similar, the mutation rate was adjusted such that at the end of the simulation time the 3000 trajectories yielded 10% of COX negative cells.
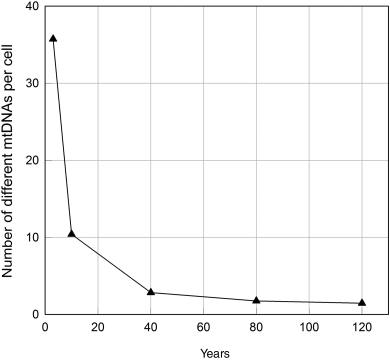
Figure 12.35 Number of different types of mtDNAs per COX negative cell depending on the simulation time (3, 10, 40, 80, and 120 years). For each simulation time a mutation rate was chosen that resulted in 10% COX negative cells. The data points are calculated from 3000 trajectories each.
From the diagram, it is immediately obvious that the number of different mtDNA types per COX negative cell depends strongly on the simulated life span. If random drift can act over a time of 120 years, there are on average only 1.46 different mutant types per COX negative cell. A value that is in good agreement with experimental results obtained from humans. However, already for a life span of 40 years (e.g., rhesus monkeys), there are 2.8 mutant types per cell, hardly compatible with observation. And finally for a life span of 3 years (e.g., rats), the simulations predict more than 35 different mtDNA mutants per cell, completely incompatible with experimental studies. Thus, the simulation results are very clear and rule out random drift as possible explanation for the accumulation of mtDNA deletion mutants in short-lived species.
12.4.3 Using Delay Differential Equations to Study Mitochondrial Damage
If random drift is not a likely explanation for the accumulation of mitochondrial deletion mutants, what else could be the mechanism? An interesting possibility that has been proposed is related to the reduced genome size of the deletion mutants [102,103]. If the reduced size directly translates into a reduced replication time, this should provide the mutants with a selection advantage. However, replication normally only occurs to replace mtDNAs that have been degraded via mitophagy. And since the time necessary for replication (1–2 h) [104] is much shorter than the half-life (1–3 weeks) [105,106], it is unclear if this idea can work. Figure 12.36 provides an overview of the model system. mtDNAs can either be in a “free” or a “busy” state. In the free state, they can respond to cellular signals and enter the busy state by starting a round of replication. After a certain delay, Δt, the original molecule plus a copy return into the free pool. Wild-type and mutant form respond with the same probability to replication signals, but deletion mutants will spend a shorter time in the busy state and hence return earlier into the free pool than wild-type mtDNAs. This is the source of the selection advantage.
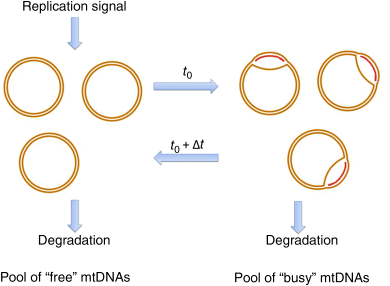
Figure 12.36 Selection advantage via a reduced genome size. If a replication signal is received by the pool of “free” mtDNA, some of them respond by starting replication and entering the “busy” state. After a replication time, Δt, two molecules of mtDNA are generated and return into the “free” pool. It is assumed that “free” as well as “busy” mtDNAs are degraded at the same rate, leading to the same half-life for wild-type and mutant molecules.
Kowald et al. [107] have investigated this problem using delay differential equations as well as stochastic simulations, but we will concentrate here on the development of the system of DDEs. The model contains four variables that require four differential equations:
- wtF: number of wild-type mtDNAs in the free pool.
- wtB: number of wild-type mtDNAs in the busy pool.
- mtF: number of mutant mtDNAs in the free pool.
- mtB: number of mutant mtDNAs in the busy pool.
These variables can undergo the following set of reactions, which describe the transfer from one pool into the other, the increase in molecule number caused by replication and the removal of mtDNAs because of degradation.


Differential equations are a standard approach to model biochemical reactions. While ordinary differential equations (ODE) only refer to variable values at one time point, x(t), delay differential equations (DDE) also refer to variable values at some time point in the past, x(t−Δt). Because in our model replication needs a certain time span after which molecules reappear from the busy state, DDEs are required instead of ODEs.
Each of the four Eqs. (12.44)–(12.47) consists of three terms describing (i) the transfer of mtDNAs to or from the busy pool, (ii) the transfer of mtDNAs to or from the free pool, and (iii) the degradation process. Let us inspect the second term of (12.44) more closely. It describes the flux of wild-type mtDNAs from the free pool into the busy pool. This depends on the current amount of free mtDNAs, wtF(t), and on how strongly mtDNAs responds to cellular replication signals. It is assumed that the replication probability declines with the total amount of existing mtDNAs. The rational is that some form of negative feedback exists that limits the production of new mtDNAs if already many exist. The mathematical expression that was used to model this behavior is of the form  . This construct has the property that the replication probability is equal to the parameter replS if only very few mtDNAs are present and drops to replS/2 when the number of mtDNAs has reached carryC. Now, we can also understand the first term that quantifies the flux of mtDNAs from the busy pool back into the free pool at the end of the replication process. This depends on the amount of free wild-type mtDNAs that started replication at t−Δt, which is given by
  . The factor 2 reflects the fact that each mtDNAs that starts replication is doubled in that process. The origin of the exponential expression, however, is not that obvious. It stems from the fact that also mtDNAs in the busy state are subject to degradation. As can be seen from the third term of the equation, a first-order decay is assumed, leading to an exponential decline. Therefore, the quantity of returning mtDNAs has to be diminished by this factor. The only difference between the equations for mutants and wild type is a shorter replication time, expressed as Δt times the size of the deletion (ranging from 0 to 1).


Results
Please note that the DDE model does not contain de novo mutations. It describes the competition between existing mutant and wild-type molecules. The original publication [107] also contains a stochastic model to take mutations into account, but we will restrict ourselves to the results of the deterministic DDE model. The software Mathematica was used to solve the equations numerically and Figure 12.37a shows the time course of wild-type (wt) and deletion mutant (mt) for a set of parameters based on literature values. The simulation was started with 999 molecules of wild-type and a single mutant molecule, reflecting the situation immediately after a mutation event. The main conclusions that can be drawn are that the shorter replication time does indeed provide a selection advantage for the deletion mutant, but it takes almost 100 years before the wild type goes extinct (drops below one copy).
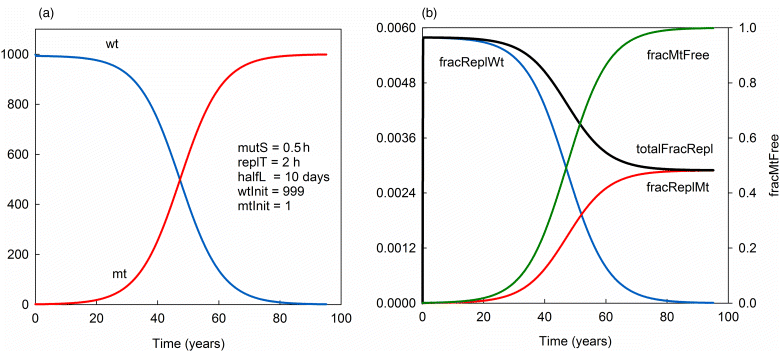
Figure 12.37 (a) Numerical solutions of the set of delay differential equations, showing the time course of wild-type (wt) and mutant (mt) mtDNA (aggregated values of free and busy pool). (b) Additional information such as the fraction of replicating wild-type molecules (fracReplWt), the fraction of replicating mutant molecules (fracReplMt), the total fraction of replicating mtDNAs (totalFracRepl), and the fraction of mutant molecules in the free pool (fracMtFree) are given.
To better understand the model behavior, it is necessary to see how extinction times depend on parameters such as the replication time or the half-life of mtDNAs. To make the results comparable between simulations, it is important that the steady-state level of the total mtDNA population remains the same, since it is very likely that extinction times also depend on the population size. One way to achieve this is to adjust the free parameter carryC, which controls the replication probability, accordingly. The relationship between the mtDNA steady-state level, Mss, and the model parameters can be obtained by setting the left-hand side of the DDE system to zero and then solving it for the steady-state values of mtDNAs in the free and busy state. For this, it is important to realize that under steady-state conditions it holds that x(t) = x(t−Δt). The sum of these values is Mss and given by the following expression:

And thus carryC is equal to:

Figure 12.38 shows the effects of varying half-life or replication time while maintaining a constant total population of mtDNAs. The simulations reveal that either shortening the half-life or increasing the time required for replication leads to a drastic reduction of the extinction time. Thus, the larger the ratio between half-life and replication time, the longer is the resulting extinction time. The reduced size of the mutant is only an advantage in the busy state (via a faster exit time) and consequently the selection advantage dwindles if the total fraction of replicating mtDNAs is decreasing. And as can be seen from Figure 12.38 increasing the half-life or decreasing the replication time diminishes this important parameter.
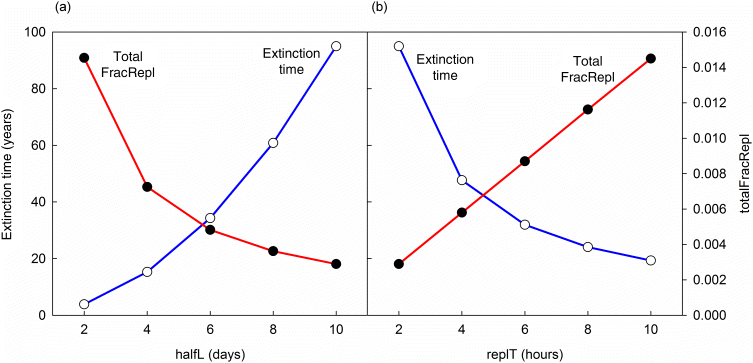
Figure 12.38 (a) Effects of varying the half-life (halfL) on the extinction time of the wild-type and the total fraction of replicating molecules. A replication time of 2 h was used. (b) Effects of varying the replication time (replT) on the extinction time of the wild-type and the total fraction of replicating molecules. A half-life of 10 days was used. Simulations were started with 999 wild-type and a single mutant mtDNA with 50% of the wild-type size.
Thus, mathematical modeling confirms that it is very unlikely that mitochondrial deletion mutants gain a selection advantage from a faster replication time based on their reduced size.
Exercises
- 1) Implement an alternative model for glycolysis as shown in Figure 12.2. However, use Michaelis–Menten kinetics instead of mass actions as has been used for the simulations shown in Figure 12.3. How would the behavior change?
- 2) Calculate the flux control coefficients for the model of the threonine synthesis pathway. If required, use a computational tool providing the necessary functions.
- 3) Consider the Ras activation cycle shown in Figure 12.14 with the parameters given there. The concentration of GAP be 0.1. GEF gets activated according to
 . Calculate the signaling time
  and the signal duration
  (Eqs. (12.29) and (12.30)).
 - 4) MAP kinase cascades comprise kinases and phosphatases. How would such a cascade behave if there were no phosphatases?
- 5) In MAP kinase cascades, proteins have typically multiple phosphorylation sites. How would the model described in Figure 12.17 and (Eqs. 12.14)–(12.22) change if we would include all potential phosphorylation sites and all sequences of phosphorylation and dephosphorylation events?
- 6) Signaling pathways often regulate the expression of genes coding for their own components. What kind of feedback does this impose? On which time scale would we expect an effect?
References
- 1. Olivier, B.G. and Snoep, J.L. JWS Online: Online Cellular Systems Modelling [updated 20 August 2004]. Available from: jjj.biochem.sun.ac.za.
- 2. Snoep, J.L. and Olivier, B.G. (2002) Java Web Simulation (JWS); a web based database of kinetic models. Mol. Biol. Rep., 29 (1–2), 259–263.
- 3. Stanford, N.J., Lubitz, T., Smallbone, K., Klipp, E., Mendes, P., and Liebermeister, W. (2013) Systematic construction of kinetic models from genome-scale metabolic networks. PloS One, 8 (11), e79195.
- 4. Hynne, F., Dano, S., and Sorensen, P.G. (2001) Full-scale model of glycolysis in Saccharomyces cerevisiae. Biophys. Chem., 94 (1–2), 121–163.
- 5. Rizzi, M., Baltes, M., Theobald, U., and Reuss, M. (1997) In vivo analysis of metabolic dynamics in Saccharomyces cerevisiae: II. Mathematical model. Biotechnol. Bioeng., 55 (4), 592–608.
- 6. Theobald, U., Mailinger, W., Baltes, M., Rizzi, M., and Reuss, M. (1997) In vivo analysis of metabolic dynamics in Saccharomyces cerevisiae: I. Experimental observations. Biotechnol. Bioeng., 55 (2), 305–316.
- 7. Tiger, C.F., Krause, F., Cedersund, G., Palmer, R., Klipp, E., Hohmann, S. et al. (2012) A framework for mapping, visualisation and automatic model creation of signal-transduction networks. Mol. Syst. Biol., 8, 578.
- 8. Yi, T.M., Kitano, H., and Simon, M.I. (2003) A quantitative characterization of the yeast heterotrimeric G protein cycle. Proc. Natl. Acad. Sci. USA, 100 (19), 10764–10769.
- 9. Dohlman, H.G. (2002) G proteins and pheromone signaling. Annu. Rev. Physiol., 64, 129–152.
- 10. Neer, E.J. (1995) Heterotrimeric G proteins: organizers of transmembrane signals. Cell, 80 (2), 249–257.
- 11. Blumer, K.J. and Thorner, J. (1991) Receptor-G protein signaling in yeast. Annu. Rev. Physiol., 53, 37–57.
- 12. Buck, L.B. (2000) The molecular architecture of odor and pheromone sensing in mammals. Cell, 100 (6), 611–618.
- 13. Dohlman, H.G., Thorner, J., Caron, M.G., and Lefkowitz, R.J. (1991) Model systems for the study of seven-transmembrane-segment receptors. Annu. Rev. Biochem., 60, 653–688.
- 14. Banuett, F. (1998) Signalling in the yeasts: an informational cascade with links to the filamentous fungi. Microbiol. Mol. Biol. Rev., 62 (2), 249–274.
- 15. Wang, P. and Heitman, J. (1999) Signal transduction cascades regulating mating, filamentation, and virulence in Cryptococcus neoformans. Curr. Opin. Microbiol., 2 (4), 358–362.
- 16. Dohlman, H.G., Song, J., Apanovitch, D.M., DiBello, P.R., and Gillen, K.M. (1998) Regulation of G protein signalling in yeast. Semin. Cell Dev. Biol., 9 (2), 135–141.
- 17. Offermanns, S. (2000) Mammalian G-protein function in vivo: new insights through altered gene expression. Rev. Physiol. Biochem. Pharmacol., 140, 63–133.
- 18. Dohlman, H.G. and Thorner, J.W. (2001) Regulation of G protein-initiated signal transduction in yeast: paradigms and principles. Annu. Rev. Biochem., 70, 703–754.
- 19. Meigs, T.E., Fields, T.A., McKee, D.D., and Casey, P.J. (2001) Interaction of Galpha 12 and Galpha 13 with the cytoplasmic domain of cadherin provides a mechanism for beta-catenin release. Proc. Natl. Acad. Sci. USA, 98 (2), 519–524.
- 20. Dohlman, H.G. and Thorner, J. (1997) RGS proteins and signaling by heterotrimeric G proteins. J. Biol. Chem., 272 (7), 3871–3874.
- 21. Ross, E.M. and Wilkie, T.M. (2000) GTPase-activating proteins for heterotrimeric G proteins: regulators of G protein signaling (RGS) and RGS-like proteins. Annu. Rev. Biochem., 69, 795–827.
- 22. Siderovski, D.P., Strockbine, B., and Behe, C.I. (1999) Whither goest the RGS proteins? Crit. Rev. Biochem. Mol. Biol., 34 (4), 215–251.
- 23. Burchett, S.A. (2000) Regulators of G protein signaling: a bestiary of modular protein binding domains. J. Neurochem., 75 (4), 1335–1351.
- 24. Takai, Y., Sasaki, T., and Matozaki, T. (2001) Small GTP-binding proteins. Physiol. Rev., 81 (1), 153–208.
- 25. Francke, C., Postma, P.W., Westerhoff, H.V., Blom, J.G., and Peletier, M.A. (2003) Why the phosphotransferase system of Escherichia coli escapes diffusion limitation. Biophys. J., 85 (1), 612–622.
- 26. Rohwer, J.M., Meadow, N.D., Roseman, S., Westerhoff, H.V., and Postma, P.W. (2000) Understanding glucose transport by the bacterial phosphoenolpyruvate:glycose phosphotransferase system on the basis of kinetic measurements in vitro. J. Biol. Chem., 275 (45), 34909–34921.
- 27. Postma, P.W., Broekhuizen, C.P., and Geerse, R.H. (1989) The role of the PEP: carbohydrate phosphotransferase system in the regulation of bacterial metabolism. FEMS Microbiol. Rev., 5 (1–2), 69–80.
- 28. Postma, P.W., Lengeler, J.W., and Jacobson, G.R. (1993) Phosphoenolpyruvate:carbohydrate phosphotransferase systems of bacteria. Microbiol. Rev., 57 (3), 543–594.
- 29. Klipp, E., Nordlander, B., Kruger, R., Gennemark, P., and Hohmann, S. (2005) Integrative model of the response of yeast to osmotic shock. Nat. Biotechnol., 23 (8), 975–982.
- 30. Hohmann, S. (2002) Osmotic stress signaling and osmoadaptation in yeasts. Microbiol. Mol. Biol. Rev., 66 (2), 300–372.
- 31. Wilkinson, M.G. and Millar, J.B. (2000) Control of the eukaryotic cell cycle by MAP kinase signaling pathways. Faseb J., 14 (14), 2147–2157.
- 32. Huang, C.Y. and Ferrell, J.E. Jr. (1996) Ultrasensitivity in the mitogen-activated protein kinase cascade. Proc. Natl. Acad. Sci. USA, 93 (19), 10078–10083.
- 33. Kholodenko, B.N. (2000) Negative feedback and ultrasensitivity can bring about oscillations in the mitogen-activated protein kinase cascades. Eur. J. Biochem., 267 (6), 1583–1588.
- 34. Force, T., Bonventre, J.V., Heidecker, G., Rapp, U., Avruch, J., and Kyriakis, J.M. (1994) Enzymatic characteristics of the c-Raf-1 protein kinase. Proc. Natl. Acad. Sci. USA, 91 (4), 1270–1274.
- 35. Lee, E., Salic, A., Kruger, R., Heinrich, R., and Kirschner, M.W. (2003) The roles of APC and Axin derived from experimental and theoretical analysis of the Wnt pathway. PLoS Biology, 1 (1), E10.
- 36. Goentoro, L. and Kirschner, M.W. (2009) Evidence that fold-change, and not absolute level, of beta-catenin dictates Wnt signaling. Mol. Cell, 36 (5), 872–884.
- 37. Goentoro, L., Shoval, O., Kirschner, M.W., and Alon, U. (2009) The incoherent feedforward loop can provide fold-change detection in gene regulation. Mol. Cell, 36 (5), 894–899.
- 38. Benary, U., Kofahl, B., Hecht, A., and Wolf, J. (2013) Modeling Wnt/beta-catenin target gene expression in APC and wnt gradients under wild type and mutant conditions. Front. Physiol., 4, 21.
- 39. Thomas, R. and Kaufman, M. (2002) Conceptual tools for the integration of data. C. R. Biol., 325 (4), 505–514.
- 40. Tyson, J.J. (1975) Classification of instabilities in chemical-reaction systems. J. Chem. Phys., 62 (3), 1010–1015.
- 41. Schaber, J., Baltanas, R., Bush, A., Klipp, E., and Colman-Lerner, A. (2012) Modelling reveals novel roles of two parallel signalling pathways and homeostatic feedbacks in yeast. Mol. Syst. Biol., 8, 622.
- 42. Heinrich, R., Neel, B.G., and Rapoport, T.A. (2002) Mathematical models of protein kinase signal transduction. Mol. Cell, 9 (5), 957–970.
- 43. Komarova, N.L., Zou, X., Nie, Q., and Bardwell, L. (2005) A theoretical framework for specificity in cell signaling. Mol Syst. Biol., 1, 0023.
- 44. Schaber, J., Kofahl, B., Kowald, A., and Klipp, E. (2006) A modelling approach to quantify dynamic crosstalk between the pheromone and the starvation pathway in baker's yeast. FEBS J., 273 (15), 3520–3533.
- 45. Kaizu, K., Ghosh, S., Matsuoka, Y., Moriya, H., Shimizu-Yoshida, Y., and Kitano, H. (2010) A comprehensive molecular interaction map of the budding yeast cell cycle. Mol. Syst. Biol., 6, 415.
- 46. Hartwell, L.H. (1974) Saccharomyces cerevisiae cell cycle. Bacteriol. Rev., 38 (2), 164–198.
- 47. Hartwell, L.H., Culotti, J., Pringle, J.R., and Reid, B.J. (1974) Genetic control of the cell division cycle in yeast. Science, 183 (120), 46–51.
- 48. Nurse, P. (1975) Genetic control of cell size at cell division in yeast. Nature, 256 (5518), 547–551.
- 49. Pardee, A.B. (1974) A restriction point for control of normal animal cell proliferation. Proc. Natl. Acad. Sci. USA, 71 (4), 1286–1290.
- 50. Nurse, P. and Bissett, Y. (1981) Gene required in G1 for commitment to cell cycle and in G2 for control of mitosis in fission yeast. Nature, 292 (5823), 558–560.
- 51. Goldbeter, A. (1991) A minimal cascade model for the mitotic oscillator involving cyclin and cdc2 kinase. Proc. Natl. Acad. Sci. USA, 88 (20), 9107–9111.
- 52. Goldbeter, A. and Koshland, D.E. Jr. (1984) Ultrasensitivity in biochemical systems controlled by covalent modification. Interplay between zero-order and multistep effects. J. Biol. Chem., 259 (23), 14441–14447.
- 53. Chen, K.C., Calzone, L., Csikasz-Nagy, A., Cross, F.R., Novak, B., and Tyson, J.J. (2004) Integrative analysis of cell cycle control in budding yeast. Mol. Biol. Cell., 15 (8), 3841–3862.
- 54. Chen, K.C., Csikasz-Nagy, A., Gyorffy, B., Val, J., Novak, B., and Tyson, J.J. (2000) Kinetic analysis of a molecular model of the budding yeast cell cycle. Mol. Biol. Cell, 11 (1), 369–391.
- 55. Novák, B., Tóth, A., Csikász-Nagy, A., Györffy, B., Tyson, J.J., and Nasmyth, K. (1999) Finishing the cell cycle. J. Theor. Biol., 199 (2), 223–233.
- 56. Tyson, J.J., Novak, B., Odell, G.M., Chen, K., and Thron, C.D. (1996) Chemical kinetic theory: understanding cell-cycle regulation. Trends Biochem. Sci., 21 (3), 89–96.
- 57. Spiesser, T.W., Muller, C., Schreiber, G., Krantz, M., and Klipp, E. (2012) Size homeostasis can be intrinsic to growing cell populations and explained without size sensing or signalling. FEBS J., 279 (22), 4213–4230.
- 58. Spiesser, T.W., Uschner, F., Adler, S., Münzner, U., Krantz, M., and Klipp, E. (2015) A yeast cell cycle model integrating stress signaling and physiology, in Systems Biology of the Cell Cycle: Towards Integration with Cell Physiology (ed. M. Barberis), Springer.
- 59. Adrover, M.A., Zi, Z., Duch, A., Schaber, J., Gonzalez-Novo, A., Jimenez, J. et al. (2011) Time-dependent quantitative multicomponent control of the G(1)-S network by the stress-activated protein kinase Hog1 upon osmostress. Sci. Signal., 4 (192), ra63.
- 60. Fall, C.P., Marland, E.S., Wagner, J.M., and Tyson, J.J. (2002) Computational Cell Biology, Springer-Verlag New York, Inc.
- 61. Oeppen, J. and Vaupel, J.W. (2002) Broken limits to life expectancy. Supramol. Sci., 296, 1029–1031.
- 62. Gompertz, B. (1825) On the nature of the function expressive of the law of human mortality and on a new mode of determining life contingencies. Philos. Trans. R. Soc., 2, 513–585.
- 63. Makeham, W.H. (1867) On the law of mortality. J. Inst. Actuaries, 13, 325–358.
- 64. Kowald, A. (2002) Lifespan does not measure ageing. Biogerontology, 3 (3), 187–190.
- 65. Medvedev, Z.A. (1990) An attempt at a rational classification of theories of ageing. Biol. Rev., 65, 375–398.
- 66. Lundblad, V. and Szostak, J.W. (1989) A mutant with a defect in telomere elongation leads to senescence in yeast. Cell, 57, 633–643.
- 67. Yu, G.-L., Bradley, J.D., Attardi, L.D., and Blackburn, E.H. (1990) In vivo alteration of telomere sequences and senescence caused by mutated Tetrahymena telomerase RNAs. Nature, 344, 126–131.
- 68. Olovnikov, A.M. (1973) A theory of Marginotomy. J. Theor. Biol., 41, 181–190.
- 69. Watson, J.D. (1972) Origin of concatameric T4 DNA. Nature, 239, 197–201.
- 70. Harley, C.B. (1991) Telomere loss: mitotic clock or genetic time bomb? Mut. Res., 256, 271–282.
- 71. Harley, C.B., Vaziri, H., Counter, C.M., and Allsopp, R.C. (1992) The telomere hypothesis of cellular aging. Exp. Gerontol., 27, 375–382.
- 72. Hayflick, L. (1965) The limited in vitro lifetime of human diploid cell strains. Exp. Cell Res., 37, 614–636.
- 73. von Zglinicki, T., Saretzki, G., Docke, W., and Lotze, C. (1995) Mild hyperoxia shortens telomeres and inhibits proliferation of fibroblasts. A model for senescence. Exp. Cell Res., 220 (1), 186–193.
- 74. Hirsch, H.R., Coomes, JA., and Witten, M. (1989) The waste-product theory of aging: transformation to unlimited growth in cell cultures. Exp. Gerontol., 24 (2), 97–112.
- 75. Miquel, J., Economos, A.C., Fleming, J., and Johnson, J.E. (1980) Mitochondrial role in cell ageing. Exp. Geront., 15, 575–591.
- 76. Linnane, A.W., Baumer, A., Maxwell, R.J., Preston, H., Zhang, C., and Marzuki, S. (1990) Mitochondrial gene mutation: the ageing process and degenerative diseases. Biochem. Int., 22 (6), 1067–1076.
- 77. Linnane, A.W., Marzuki, S., Ozawa, T., and Tanaka, M. (1989) Mitochondrial DNA mutations as an important contributor to ageing and degenerative diseases. Lancet, 333, 642–645.
- 78. de Grey, A.D.N.J. (1997) A proposed refinement of the mitochondrial free radical theory of aging. BioEssays., 19 (2), 161–166.
- 79. Kowald, A., Jendrach, M., Pohl, S., Bereiter-Hahn, J., and Hammerstein, P. (2005) On the relevance of mitochondrial fusions for the accumulation of mitochondrial deletion mutants: a modelling study. Aging Cell., 4 (5), 273–283.
- 80. Kowald, A. and Kirkwood, T.B. (2014) Transcription could be the key to the selection advantage of mitochondrial deletion mutants in aging. Proc. Natl. Acad. Sci. USA, 111 (8), 2972–2977.
- 81. Weismann, A. (1891) Essays Upon Heredity and Kindred Biological Problems, 2nd edn (ed.): Clarendon Press, Oxford.
- 82. Maynard Smith, J. (1976) Group selection. Q. Rev. Biol., 51, 277–283.
- 83. Medawar, PB. (1952) An Unsolved Problem of Biology: An Inaugural Lecture Delivered at University College, H.K. Lewis, London.
- 84. Stearns, S.C. and Hoekstra, R.F. (2000) Evolution, An Introduction, Oxford University Press.
- 85. Williams, G.C. (1957) Pleiotropy, natural selection and the evolution of senescence. Evolution, 11, 398–411.
- 86. Kirkwood, T.B.L. and Holliday, R. (1986) Ageing as a consequence of natural selection, in The Biology of Human Ageing (eds A.H. Bittles and K.J. Collins), Cambridge University Press, p. 1–15.
- 87. Kirkwood, T.B.L. and Rose, M.R. (1991) Evolution of senescence: Late survival sacrificed for reproduction, Philosophical Transactions of the Royal Society, London B, 332, pp. 15–24.
- 88. Maynard Smith, J. (1989) Evolutionary Genetics, Oxford University Press, Oxford.
- 89. Stearns, S.C. (1992) The Evolution of Life Histories, Oxford University Press, Oxford.
- 90. Schwartz, R.M. and Dayhoff, M.O. (1978) Origins of prokaryotes, eukaryotes, mitochondria, and chloroplasts. Science, 199, 395–403.
- 91. Anderson, S., Bankier, A.T., Barrell, B.G., Debruijn, M.H.L., Coulson, A.R., Drouin, J. et al. (1981) Sequence and organization of the human mitochondrial genome. Nature, 290, 457–465.
- 92. Cao, Z., Wanagat, J., McKiernan, S.H., and Aiken, J.M. (2001) Mitochondrial DNA deletion mutations are concomitant with ragged red regions of individual, aged muscle fibers: analysis by laser-capture microdissection. Nucleic acids Res., 29 (21), 4502–4508.
- 93. Brierley, E.J., Johnson, M.A., Lightowlers, R.N., James, O.F., and Turnbull, D.M. (1998) Role of mitochondrial DNA mutations in human aging: implications for the central nervous system and muscle. Ann. Neurol., 43 (2), 217–223.
- 94. Khrapko, K., Bodyak, N., Thilly, W.G., van Orsouw, N.J., Zhang, X., Coller, H.A. et al. (1999) Cell by cell scanning of whole mitochondrial genomes in aged human heart reveals a significant fraction of myocytes with clonally expanded deletions. Nucleic Acids Res., 27 (11), 2434–2441.
- 95. Gokey, N.G., Cao, Z., Pak, J.W., and Lee, D., McKiernan, S.H., McKenzie, D. et al. (2004) Molecular analyses of mtDNA deletion mutations in microdissected skeletal muscle fibers from aged rhesus monkeys. Aging Cell., 3 (5), 319–326.
- 96. Herbst, A., Pak, J.W., McKenzie, D., Bua, E., Bassiouni, M., and Aiken, J.M. (2007) Accumulation of mitochondrial DNA deletion mutations in aged muscle fibers: evidence for a causal role in muscle fiber loss. J. Gerontol. A Biol. Sci. Med. Sci., 62 (3), 235–245.
- 97. McKiernan, S.H., Colman, R., Lopez, M., Beasley, T.M., Weindruch, R., and Aiken, J.M. (2009) Longitudinal analysis of early stage sarcopenia in aging rhesus monkeys. Exp. Gerontol., 44 (3), 170–176.
- 98. Elson, J.L., Samuels, D.C., Turnbull, D.M., and Chinnery, P.F. (2001) Random intracellular drift explains the clonal expansion of mitochondrial DNA mutations with age. Am. J. Hum. Genet., 68 (3), 802–806.
- 99. Chinnery, P.F. and Samuels, D.C. (1999) Relaxed replication of mtDNA: a model with implications for the expression of disease. Am. J. Hum. Genet., 64 (4), 1158–1165.
- 100. Kowald, A. and Kirkwood, T.B. (2013) Mitochondrial mutations and aging: random drift is insufficient to explain the accumulation of mitochondrial deletion mutants in short-lived animals. Aging Cell., 12 (4), 728–731.
- 101. Müller-Höcker, J. (1990) Cytochrome c oxidase deficient fibres in the limb muscle and diaphragm of man without muscular disease: an age-related alteration. J. Neurol. Sci., 100 (1–2), 14–21.
- 102. Wallace, D.C. (1992) Mitochondrial genetics: a paradigm for aging and degenerative diseases? Science, 256 (5057), 628–632.
- 103. Lee, C.M., Lopez, M.E., Weindruch, R., and Aiken, J.M. (1998) Association of age-related mitochondrial abnormalities with skeletal muscle fiber atrophy. Free Radic. Biol. Med., 25 (8), 964–972.
- 104. Clayton, D.A. (1982) Replication of animal mitochondrial DNA. Cell, 28 (4), 693–705.
- 105. Huemer, R.P., Lee, K.D., Reeves, A.E., and Bickert, C. (1971) Mitochondrial studies in senescent mice - II. Specific activity, bouyant density, and turnover of mitochondrial DNA. Exp. Gerontol., 6, 327–334.
- 106. Korr, H., Kurz, C., Seidler, T.O., Sommer, D., and Schmitz, C. (1998) Mitochondrial DNA synthesis studied autoradiographically in various cell types in vivo. Braz. J. Med. Biol. Res., 31 (2), 289–298.
- 107. Kowald, A., Dawson, M., and Kirkwood, T.B. (2014) Mitochondrial mutations and ageing: can mitochondrial deletion mutants accumulate via a size based replication advantage? J. Theor. Biol., 340, 111–118.
