page 134
CHAPTER
FIVE
5
Estimating Project Times and Costs
page 135
Plans are of little importance, but planning is essential.
— Winston Churchill, former British prime minister
Estimating is the process of forecasting or approximating the time and cost of completing project deliverables. Estimating processes are frequently classified as top-down and bottom-up. Top-down estimates are usually done by senior management. Management will often derive estimates from analogy, group consensus, or mathematical relationships. Bottom-up estimates are typically performed by the people who are doing the work. Their estimates are based on estimates of elements found in the work breakdown structure. Exhibit 5.1 summarizes some of the key reasons for estimating.
EXHIBIT 5.1
Why Estimating Time and Cost Is Important
|
All project stakeholders prefer accurate cost and time estimates, but they also understand the inherent uncertainty in all projects. Inaccurate estimates lead to false expectations and consumer dissatisfaction. Accuracy is improved with greater effort, but is it worth the time and cost? Estimating costs money! Project estimating becomes a trade-off, balancing the benefits of better accuracy against the costs for securing increased accuracy.
page 136
Cost, time, and budget estimates are the lifeline for control; they serve as the standard for comparison of actual and plan throughout the life of the project. Project status reports depend on reliable estimates as the major input for measuring variances and taking corrective action. Ideally, the project manager, and in most cases the customer, would prefer to have a database of detailed schedule and cost estimates for every work package in the project. Regrettably, such detailed data gathering is not always possible or practical, and other methods are used to develop project estimates.
5.1 Factors Influencing the Quality of Estimates
A typical statement in the field is the desire to “have a 95 percent probability of meeting time and cost estimates.” Past experience is a good starting point for developing time and cost estimates. But past experience estimates must almost always be refined by other considerations to reach the 95 percent probability level. Factors related to the uniqueness of the project will have a strong influence on the accuracy of estimates. Project, people, and external factors all need to be considered to improve the quality of estimates for project times and costs.
Planning Horizon
The quality of the estimate depends on the planning horizon; estimates of current events are close to 100 percent accurate but are reduced for more distant events. For example, cost estimates for a party you are organizing this weekend should be much more accurate than the estimates for a party that will take place in six months. Now imagine how difficult it would be to estimate the total cost of a four-year transportation project. The accuracy of time and cost estimates should improve as you move from the conceptual phase to the point where individual work packages are defined.
Project Complexity
Time to implement new technology has a habit of expanding in an increasing, nonlinear fashion. Sometimes poorly written scope specifications for new technology result in errors in estimating times and costs.
People
The people factor can influence the quality of time and cost estimates. For example, accuracy of estimates depends on the skills of the people making the estimates. How familiar are they with the task they are estimating?
page 137
Project Structure and Organization
Which project structure is chosen to manage the project will influence time and cost estimates. One of the major advantages of a dedicated project team is the speed gained from concentrated focus and localized project decisions. This speed comes at an additional cost of tying up personnel full time. Conversely, projects operating in a matrix environment may reduce costs by more efficiently sharing personnel across projects but may take longer to complete, since attention is divided and coordination demands are higher.
Padding Estimates
In some cases people are inclined to pad estimates. For example, if you are asked how long it takes you to drive to the airport, you might give an average time of 30 minutes, assuming a 50/50 chance of getting there in 30 minutes. If you are asked the fastest you could possibly get there, you might reduce the driving time to 20 minutes. Finally, if you are asked how long the drive would take if you absolutely had to be there to meet with the president, it is likely you would increase the estimate to, say, 50 minutes to ensure not being late.
In work situations where we are asked for time and cost estimates, most of us are inclined to add a little padding to reduce the risk of being late. If everyone at all levels of the project adds a little padding to reduce risk, the project duration and cost are seriously overstated. This phenomenon causes some managers or owners to call for a 10–15 percent cut in time and/or cost for the project. Of course, the next time the game is played, the person estimating cost and/or time will pad the estimate to 20 percent or more. Clearly such games defeat chances for realistic estimates, which is what is needed to be competitive.
Organizational Culture
Organizational culture can significantly influence project estimates. In some organizations padding estimates is tolerated and even privately encouraged. Other organizations place a premium on accuracy and strongly discourage estimating gamesmanship. Organizations vary in the importance they attach to estimates. The prevailing belief in some organizations is that detailed estimating takes too much time and is not worth the effort or that it’s impossible to predict the future. Other organizations subscribe to the belief that accurate estimates are the bedrock of effective project management. Organizational culture shapes every dimension of project management; estimating is not immune to this influence.
Other Factors
Finally, nonproject factors can impact time and cost estimates. For example, equipment down-time can alter time estimates. National holidays, vacations, and legal limits can influence project estimates. Project priority can influence resource assignment and impact time and cost.
Project estimating is a complex process. The quality of time and cost estimates can be improved when these variables are considered in making the estimates. Estimates of time and cost together allow the manager to develop a time-phased budget, which is imperative for project control. Before discussing macro and micro estimating methods for times and costs, a review of estimating guidelines will remind us of some of the important “rules of the game” that can improve estimating.
page 138
5.2 Estimating Guidelines for Times, Costs, and Resources
Managers recognize time, cost, and resource estimates must be accurate if project planning, scheduling, and controlling are to be effective. However, there is substantial evidence suggesting poor estimates are a major contributor to projects that have failed. Therefore, every effort should be made to see that initial estimates are as accurate as possible, since the choice of no estimates leaves a great deal to luck and is not palatable to serious project managers. Even though a project has never been done before, a manager can follow seven guidelines to develop useful work package estimates.
Responsibility. At the work package level, estimates should be made by the person(s) most familiar with the task. Draw on their expertise! Except for supertechnical tasks, those responsible for getting the job done on schedule and within budget are usually first-line supervisors or technicians who are experienced and familiar with the type of work involved. These people will not have some preconceived, imposed duration for a deliverable in mind. They will give an estimate based on experience and best judgment. A secondary benefit of using those responsible is the hope they will “buy in” to seeing that the estimate materializes when they implement the work package. If those involved are not consulted, it will be difficult to hold them responsible for failure to achieve the estimated time. Finally, drawing on the expertise of team members who will be responsible helps to build communication channels early.
The use of several people to estimate. It is well known that a cost or time estimate usually has a better chance of being reasonable and realistic when several people with relevant experience and/or knowledge of the task are used (sometimes called “crowdsourcing”). True, people bring different biases based on their experience. But discussion of the individual differences in their estimate leads to consensus and tends to eliminate extreme estimate errors.
Normal conditions. When task time, cost, and resource estimates are determined, they are based on certain assumptions. Estimates should be based on normal conditions, efficient methods, and a normal level of resources. Normal conditions are sometimes difficult to discern, but it is necessary to have a consensus in the organization as to what normal conditions mean in this project. If the normal workday is eight hours, the time estimate should be based on an eight-hour day. Similarly, if the normal workday is two shifts, the time estimate should be based on a two-shift workday. Any time estimate should reflect efficient methods for the resources normally available. The time estimate should represent the normal level of resources—people or equipment. For example, if three programmers are available for coding or two road graders are available for road construction, time and cost estimates should be based on these normal levels of resources unless it is anticipated the project will change what is currently viewed as “normal.” In addition, possible conflicts in demand for resources on parallel or concurrent activities should not be considered at this stage. The need for adding resources will be examined when resource scheduling is discussed in a later chapter.
Time units. Specific time units to use should be selected early in the development phase of the project network. All task time estimates need consistent time units. Estimates of time must consider whether normal time is represented by calendar days, workdays, workweeks, person days, single shift, hours, minutes, etc. In practice the use of workdays is the dominant choice for expressing task duration. However, in projects such as a heart transplant operation, minutes probably would be page 139more appropriate as a time unit. One such project that used minutes as the time unit was the movement of patients from an old hospital to an elegant new one across town. Since there were several life-endangering moves, minutes were used to ensure patient safety so that proper emergency life-support systems would be available if needed. The point is, network analysis requires a standard unit of time. When computer programs allow more than one option, some notation should be made of any variance from the standard unit of time. If the standard unit of time is a five-day workweek and the estimated activity duration is in calendar days, it must be converted to the normal workweek.
Independence. Estimators should treat each task as independent of other tasks that might be integrated by the WBS. Use of first-line managers usually results in considering tasks independently; this is good. Top managers are prone to aggregate many tasks into one time estimate and then deductively make the individual task time estimates add to the total. If tasks are in a chain and performed by the same group or department, it is best not to ask for all the time estimates in the sequence at once to avoid the tendency for a planner or a supervisor to look at the whole path and try to adjust individual task times in the sequence to meet an arbitrary imposed schedule or some rough “guesstimate” of the total time for the whole path or segment of the project. This tendency does not reflect the uncertainties of individual activities and generally results in optimistic task time estimates. In summary, each task time estimate should be considered independently of other activities.
Contingencies. Work package estimates should not include allowances for contingencies. The estimate should assume normal or average conditions, even though every work package will not materialize as planned. For this reason top management needs to create an extra fund for contingencies that can be used to cover unforeseen events.
Risk assessment added to the estimate to avoid surprises to stakeholders. It is obvious some tasks carry more time and cost risks than others. For example, a new technology usually carries more time and cost risks than a proven process. Simply identifying the degree of risk lets stakeholders consider alternative methods and alter process decisions. A simple breakdown by optimistic, most likely, and pessimistic for task time could provide valuable information regarding time and cost. See Chapter 7 for further discussion of project risk.
Where applicable, these guidelines will greatly help to avoid many of the pitfalls found so often in practice.
5.3 Top-Down versus Bottom-Up Estimating
Since estimating efforts cost money, the time and detail devoted to estimating are important decisions. Yet when estimating is considered, you as a project manager may hear statements such as these:
Rough order of magnitude is good enough. Spending time on detailed estimating wastes money.
Time is everything; our survival depends on getting there first! Time and cost accuracy is not an issue.
The project is internal. We don’t need to worry about cost.
The project is so small, we don’t need to bother with estimates. Just do it.
page 140
However, there are sound reasons for using top-down or bottom-up estimates. Table 5.1 depicts conditions that suggest when one approach is preferred over another.
TABLE 5.1
Conditions for Preferring Top-Down or Bottom-Up Time and Cost Estimates
| Condition | Top-Down Estimates | Bottom-Up Estimates |
| Strategic decision making | X | |
| Cost and time important | X | |
| High uncertainty | X | |
| Internal, small project | X | |
| Fixed-price contract | X | |
| Customer wants details | X | |
| Unstable scope | X |
Top-down estimates usually are derived from someone who uses experience and/or information to determine the project duration and total cost. However, these estimates are sometimes made by top managers who have very little knowledge of the component activities used to complete the project. For example, a mayor of a major city making a speech noted that a new law building would be constructed at a cost of $23 million and would be ready for occupancy in two and one-half years. Although the mayor probably asked for an estimate from someone, the estimate could have come from a luncheon meeting with a local contractor who wrote an estimate (guesstimate) on a napkin. This is an extreme example, but in a relative sense this scenario is frequently played out in practice. See Snapshot from Practice 5.1: Portland Aerial Tram for another example of this. The question actually is, do these estimates represent low-cost, efficient methods? Seldom. The fact that the estimate came from the top can influence people responsible to “do what it takes to make the estimate.”
If possible and practical, you want to push the estimating process down to the work package level for bottom-up estimates that establish low-cost, efficient methods. This process can take place after the project has been defined in detail. Good sense suggests project estimates should come from the people most knowledgeable about the estimate needed. The use of several people with relevant experience with the task can improve the time and cost estimate. The bottom-up approach at the work package level can serve as a check on cost elements in the WBS by rolling up the work packages and associated cost accounts to major deliverables. Similarly, resource requirements can be checked. Later, the time, resource, and cost estimates from the work packages can be consolidated into time-phased networks, resource schedules, and budgets that are used for control.
The bottom-up approach also provides the customer with an opportunity to compare the low-cost, efficient method approach with any imposed restrictions. For example, if the project completion duration is imposed at two years and your bottom-up analysis tells you the project will take two and one-half years, the client can now consider the trade-off of the low-cost method versus compressing the project to two years—or in rare cases canceling the project. Similar trade-offs can be compared for different levels of resources or increases in technical performance. The assumption is any movement away from the low-cost, efficient method will increase costs—e.g., overtime. The preferred approach in defining the project is to make rough top-down estimates, develop the WBS/OBS, make bottom-up estimates, develop schedules and budgets, and reconcile differences between top-down and bottom-up estimates. These steps should be done before final negotiation with either an internal or external customer. page 141In conclusion, the ideal approach is for the project manager to allow enough time for both the top-down and bottom-up estimates to be worked out so that a complete plan based on reliable estimates can be offered to the customer. In this way false expectations are minimized for all stakeholders and negotiation is reduced.
page 142
5.4 Methods for Estimating Project Times and Costs
Top-Down Approaches for Estimating Project Times and Costs
At the strategic level, top-down estimating methods are used to evaluate the project proposal. Sometimes much of the information needed to derive accurate time and cost estimates is not available in the initial phase of the project—for example, design is not finalized. In these situations top-down estimates are used until the tasks in the WBS are clearly defined.
Consensus Method
This method simply uses the pooled experience of senior and/or middle managers to estimate the total project duration and cost. It typically involves a meeting where experts discuss, argue, and ultimately reach a decision as to their best guesstimate. Firms seeking greater rigor will use the Delphi Method to make these macro estimates. See Snapshot from Practice 5.2: The Delphi Method.
page 143
It is important to recognize that these first top-down estimates are only a rough cut and typically occur in the “conceptual” stage of the project. The top-down estimates are helpful in initial development of a complete plan. However, such estimates are sometimes significantly off the mark because little detailed information is gathered. At this level individual work items are not identified. Or in a few cases the top-down estimates are not realistic because top management “wants the project.” Nevertheless, the initial top-down estimates are helpful in determining whether the project warrants more formal planning, which would include more detailed estimates. Be careful that macro estimates made by senior managers are not dictated to lower-level managers who might feel compelled to accept the estimates even if they believe resources are inadequate.
Ratio Method
Top-down methods (sometimes called parametric) usually use ratios, or surrogates, to estimate project times or costs. Top-down ratio methods are often used in the concept, or “need,” phase of a project to get an initial duration and cost estimate for the project. For example, contractors frequently use number of square feet to estimate the cost and time to build a house; that is, a house of 2,700 square feet might cost $160 per square foot (2,700 feet × $160 per square foot equals $432,000). Likewise, knowing the square feet and dollars per square foot, experience suggests it should take approximately 100 days to complete. Two other common examples of top-down cost estimates are the cost for a new plant estimated by capacity size and a software product estimated by features and complexity.
Apportion Method
This method is an extension to the ratio method. Apportionment is used when projects closely follow past projects in features and costs. Given good historical data, estimates can be made quickly with little effort and reasonable accuracy. This method is very common in projects that are relatively standard but have some small variation or customization.
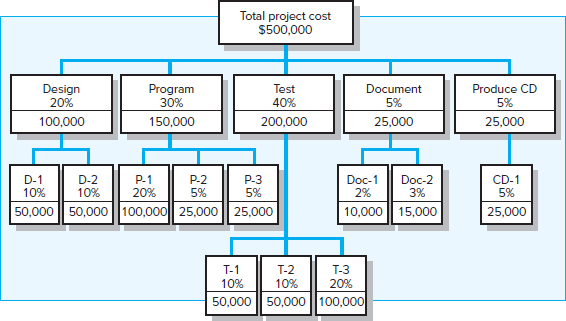
Anyone who has borrowed money from a bank to build a house has been exposed to this process. Given an estimated total cost for the house, banks and the FHA (Federal Housing Authority) authorize pay to the contractor by completion of specific segments of the house. For example, foundation might represent 3 percent of the total loan, framing 25 percent, plumbing and heating 15 percent, etc. Payments are made as these items are completed. An analogous process is used by some companies that apportion costs to deliverables in the WBS—given average cost percentages from past projects. Figure 5.1 presents an example similar to one found in practice. Assuming the total project cost is estimated, using a top-down estimate, to be $500,000, the costs are apportioned as a percentage of the total cost. For example, the costs apportioned to the “Document” deliverable are 5 percent of the total, or $25,000. The subdeliverables “Doc-1 and Doc-2” are allocated 2 and 3 percent of the total—$10,000 and $15,000, respectively.
FIGURE 5.1 Apportion Method of Allocating Project Costs Using the Work Breakdown Structure
Function Point Methods for Software and System Projects
In the software industry, software development projects are frequently estimated using weighted macro variables called function points or major parameters such as number of inputs, number of outputs, number of inquiries, number of data files, and number of interfaces. These weighted variables are adjusted for a complexity factor and added. The total adjusted count provides the basis for estimating the labor effort and cost page 144for a project (usually using a regression formula derived from data of past projects). This latter method assumes adequate historical data by type of software project for the industry—for example, MIS systems. In the U.S. software industry, one person-month represents on average five function points. A person working one month can generate on average (across all types of software projects) about five function points. Of course, each organization needs to develop its own average for its specific type of work. Such historical data provide a basis for estimating the project duration. Variations of this top-down approach are used by companies such as IBM, Bank of America, Sears Roebuck, HP, AT&T, Ford Motors, GE, DuPont, and many others. See Table 5.2 and Table 5.3 for a simplified example of function point count methodology.
TABLE 5.2
Simplified Basic Function Point Count Process for a Prospective Project or Deliverable
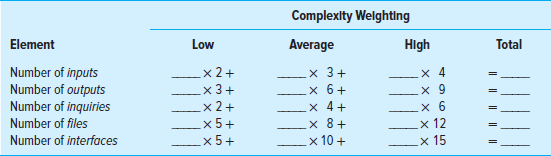
From historical data the organization developed the weighting scheme for complexity found in Table 5.2. Function points are derived from multiplying the number of kinds of elements by weighted complexity.
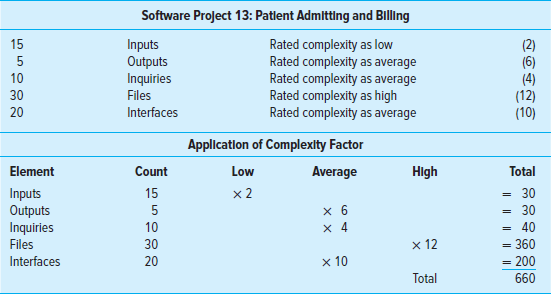
Table 5.3 shows the data collected for a specific task or deliverable: Patient Admitting and Billing—the number of inputs, outputs, inquiries, files, and interfaces along with the expected complexity rating. Finally, the application of the element count is applied and the function point count total is 660. Given this count and the fact that 1 person-month has historically been equal to 5 function points, the job will require page 145132 person-months (660/5 = 132). Assuming you have 10 programmers who can work on this task, the duration would be approximately 13 months. The cost is easily derived by multiplying the labor rate per month times 132 person-months. For example, if the monthly programmer rate is $8,000, then the estimated cost would be $1,056,000 (132 × 8,000). Although function point metrics are useful, their accuracy depends on adequate historical data, the currency of the data, and the relevancy of the project/deliverable to past averages.
TABLE 5.3
Example: Function Point Count Method
Learning Curves
Some projects require that the same task, group of tasks, or product be repeated several times. Managers know intuitively that the time to perform a task improves with repetition. This phenomenon is especially true of tasks that are labor intensive. In these circumstances the pattern of improvement phenomenon can be used to predict the reduction in time to perform the task. From empirical evidence across all industries, the pattern of this improvement has been quantified in the learning curve (also known as improvement curve, experience curve, and industrial progress curve), which is described by the following relationship:
Each time the output quantity doubles, the unit labor hours are reduced at a constant rate.
In practice the improvement ratio may vary from 60 percent, representing very large improvement, to 100 percent, representing no improvement at all. Generally as the difficulty of the work decreases the expected improvement also decreases and the improvement ratio that is used becomes greater. One significant factor to consider is the proportion of labor in the task in relation to machine-paced work. Obviously a lower percentage of improvement can occur only in operations with high labor content. Appendix 5.1 at the end of the chapter provides a detailed example of how the improvement phenomenon can be used to estimate time and cost for repetitive tasks.
The main disadvantage of top-down approaches to estimating is simply that the time and cost for a specific task are not considered. Grouping many tasks into a common basket encourages errors of omission and the use of imposed times and costs.
Micro, bottom-up estimating methods are usually more accurate than macro methods.
page 146
Bottom-Up Approaches for Estimating Project Times and Costs
Template Method
If the project is similar to past projects, then template methods can be used as a starting point for the new project. Templates are created based on the costs of previous, similar projects. Differences in the new project can be noted and past times and costs adjusted to reflect these differences. For example, a ship repair drydock firm has a set of standard repair projects (i.e., templates for overhaul, electrical, mechanical) that are used as starting points for estimating the cost and duration of any new project. Differences from the appropriate standardized project are noted (for times, costs, and resources) and changes are made. This approach enables the firm to develop a potential schedule, estimate costs, and develop a budget in a very short time span. Development of such templates in a database can quickly reduce estimate errors.
Parametric Procedures Applied to Specific Tasks
Just as parametric techniques such as cost per square foot can be the source of top-down estimates, the same technique can be applied to specific tasks. For example, as part of an MS Office conversion project, 36 different computer workstations needed to be converted. Based on past conversion projects, the project manager determined that on average one person could convert three workstations per day. Therefore the task of converting the 36 workstations would take three technicians four days [(36/3)/3]. Similarly, to estimate the wallpapering allowance on a house remodel, the contractor figured a cost of $5 per square yard of wallpaper and $2 per yard to install it, for a total cost of $7. By measuring the length and height of all the walls, she was able to calculate the total area in square yards and multiply it by $7.
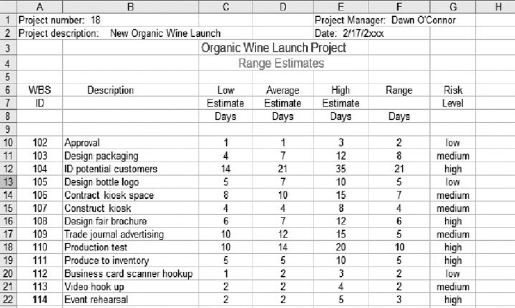
Range Estimating
When do you use range estimating? Range estimating works best when work packages have significant uncertainty associated with the time or cost to complete. If the work package is routine and carries little uncertainty, using a person most familiar with the work package is usually the best approach. He is likely to know best how to estimate work packages durations and costs. However, when work packages have significant uncertainty associated with the time or cost to complete, it is a prudent policy to require three time estimates—low, average, and high (borrowed from PERT methodology that uses probability distributions). The low to high give a range within which the average estimate will fall. Determining the low and high estimates for the activity is influenced by factors such as complexity, technology, newness, and familiarity.
How do you get the estimates? Since range estimating works best for work packages that have significant uncertainty, having a group determine the low, average, and high cost or duration gives best results. Group estimating tends to refine extremes by bringing more evaluative judgments to the estimate and potential risks. The judgment of others in a group helps to moderate extreme perceived risks associated with a time or cost estimate. Involving others in making activity estimates gains buy-in and credibility to the estimate.
Figure 5.2 presents an abridged estimating template using three time estimates for work packages developed by a cross-functional group or groups of project stakeholders. The group estimates show the low, average, and high for each work package. The Risk Level column is the group’s independent assessment of the degree of confidence that the actual time will be very close to the estimate. In a sense this number page 147represents the group’s evaluation of many factors (e.g., complexity, technology) that might impact the average time estimate. In our example, the group feels work packages 104, 108, 110, 111, and 114 have a high chance that the average time may vary from expected. Likewise, the group’s confidence feels the risk of work packages 102, 105, and 112 not materializing as expected is low.
FIGURE 5.2
Range Estimating Template
Source: Microsoft Excel
How do you use the estimate? Group range estimating gives the project manager and owner an opportunity to assess the confidence associated with project times (and/or costs). For example, a contractor responsible for building a high-rise apartment building can tell the owner that the project will cost between $3.5 and $4.1 million and take between six and nine months to complete. The approach helps to reduce surprises as the project progresses. The range estimating method also provides a basis for assessing risk, managing resources, and determining the project contingency fund. (See Chapter 7 for a discussion of contingency funds.) Range estimating is popular in software and new product projects where up-front requirements are fuzzy and not well known. Group range estimating is often used with phase estimating, which is discussed next.
A Hybrid: Phase Estimating
This approach begins with a top-down estimate for the project and then refines estimates for phases of the project as it is implemented. Some projects by their nature cannot be rigorously defined because of the uncertainty of design or the final product. These projects are often found in aerospace projects, IT projects, new technology projects, and construction projects where design is incomplete. In these projects, phase or life-cycle estimating is frequently used.
Phase estimating is used when an unusual amount of uncertainty surrounds a project and it is impractical to estimate times and costs for the entire project. Phase estimating uses a two-estimate system over the life of the project. A detailed estimate is developed for the immediate phase and a macro estimate is made for the remaining phases of the project. Figure 5.3 depicts the phases of a project and the progression of estimates over its life.
page 148
FIGURE 5.3
Phase Estimating over Project Life Cycle
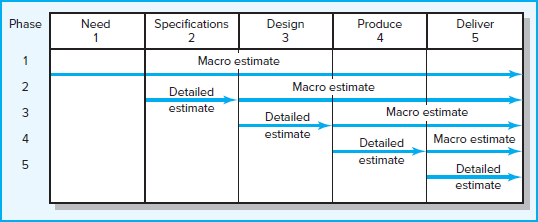
For example, when the project need is determined, a macro estimate of the project cost and duration is made so analysis and decisions can be made. Simultaneously a detailed estimate is made for deriving project specifications and a macro estimate for the remainder of the project. As the project progresses and specifications are solidified, a detailed estimate for design is made and a macro estimate for the remainder of the project is computed. Clearly, as the project progresses through its life cycle and more information is available, the reliability of the estimates should be improving. See Snapshot from Practice 5.3: Estimate Accuracy.
Phase estimating is preferred by those working on projects where the final product is not known and the uncertainty is very large—for example, the development of reusable rockets or domestic robots. The commitment to cost and schedule is only necessary over the next phase of the project, and commitment to unrealistic future schedules and costs based on poor information is avoided. This progressive macro/micro method provides a stronger basis for using schedule and cost estimates to manage progress during the next phase.
page 149
Unfortunately, your customer—internal or external—will want an accurate estimate of schedule and cost the moment the decision is made to implement the project. Additionally, the customer who is paying for the project often perceives phase estimating as a blank check because costs and schedules are not firm over most of the project life cycle. Even though the reasons for phase estimating are sound and legitimate, most customers have to be sold on its legitimacy. A major advantage for the customer is the opportunity to change features, re-evaluate the project, or even cancel it in each new phase. In conclusion, phase estimating is very useful in projects that possess huge uncertainties concerning the final nature (shape, size, features) of the project.
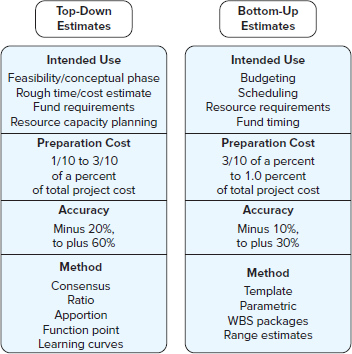
See Figure 5.4 for a summary of the differences between top-down and bottom-up estimates.
FIGURE 5.4
Top-Down and Bottom-Up Estimates
Obtaining accurate estimates is a challenge. Committed organizations accept the challenge of coming up with meaningful estimates and invest heavily in developing their capacity to do so. Accurate estimates reduce uncertainty and support a discipline for effectively managing projects.
5.5 Level of Detail
Level of detail is different for different levels of management. At any level the detail should be no more than is necessary and sufficient. Top management interests usually center on the total project and major milestone events that mark major accomplishments—for example, “build oil platform in the north sea” or “complete prototype.” Middle management might center on one segment of the project or one milestone. First-line managers’ interests may be limited to one task or work package. One of the beauties of WBS is the ability to aggregate network information so each level of management can have the kind of information necessary to make decisions.
Getting the level of detail in the WBS to match management needs for effective implementation is crucial, but the delicate balance is difficult to find. See Snapshot from Practice 5.4: Level of Detail. The level of detail in the WBS varies with the page 150complexity of the project; the need for control; the project size, cost, and duration; and other factors. If the structure reflects excessive detail, there is a tendency to break the work effort into department assignments. This tendency can become a barrier to success, since the emphasis will be on departmental outcomes rather than on deliverable outcomes. Excessive detail also means more unproductive paperwork. Note that if the level of the WBS is increased by one, the number of cost accounts may increase geometrically. On the other hand, if the level of detail is not adequate, an organization unit may find the structure falls short of meeting its needs. Fortunately, the WBS has built-in flexibility. Participating organization units may expand their portion of the structure to meet their special needs. For example, the Engineering Department may wish to further break their work on a deliverable into smaller packages by electrical, civil, and mechanical. Similarly, the Marketing Department may wish to break their new product promotion into TV, radio, periodicals, and newspapers.
5.6 Types of Costs
Assuming work packages are defined, detailed cost estimates can be made. Here are typical kinds of costs found in a project:
Direct costs
Labor
Materials
Equipment
Other
Direct project overhead costs
General and administrative (G&A) overhead costs
page 151
The total project cost estimate is broken down in this fashion to sharpen the control process and improve decision making.
Direct Costs
These costs are clearly chargeable to a specific work package. Direct costs can be influenced by the project manager, project team, and individuals implementing the work package. These costs represent real cash outflows and must be paid as the project progresses; therefore, direct costs are usually separated from overhead costs. Lower-level project rollups frequently include only direct costs.
Direct Project Overhead Costs
Direct overhead rates more closely pinpoint which resources of the organization are being used in the project. Direct project overhead costs can be tied to project deliverables or work packages. Examples include the salary of the project manager and temporary rental space for the project team. Although overhead is not an immediate out-of-pocket expense, it is real and must be covered in the long run if the firm is to remain viable. These rates are usually a ratio of the dollar value of the resources used—e.g., direct labor, materials, equipment. For example, a direct labor burden rate of 20 percent would add a direct overhead charge of 20 percent to the direct labor cost estimate. A direct charge rate of 50 percent for materials would carry an additional 50 percent charge to the material cost estimate. Selective direct overhead charges provide a more accurate project (job or work package) cost than does using a blanket overhead rate for the whole project.
General and Administrative (G&A) Overhead Costs
These represent organization costs that are not directly linked to a specific project. They are carried for the duration of the project. Examples include organization costs across all products and projects such as advertising, accounting, and senior management above the project level. Allocation of G&A costs varies from organization to organization. However, G&A costs are usually allocated as a percent of total direct cost or a percent of the total of a specific direct cost such as labor, materials, or equipment.
Given the totals of direct and overhead costs for individual work packages, it is possible to cumulate the costs for any deliverable or for the entire project. A percentage can be added for profit if you are a contractor. A breakdown of costs for a proposed contract bid is presented in Figure 5.5.
FIGURE 5.5
Contract Bid Summary Costs
| Direct costs | $80,000 |
| Direct overhead | $20,000 |
| Total direct costs | $100,000 |
| G&A overhead (20%) | $20,000 |
| Total costs | $120,000 |
| Profit (20%) | $24,000 |
| Total bid | $144,000 |
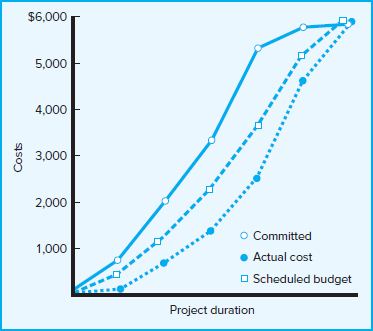
Perceptions of costs and budgets vary depending on their users. The project manager must be very aware of these differences when setting up the project budget and when communicating these differences to others. Figure 5.6 depicts these different perceptions. page 152The project manager can commit costs months before the resource is used. This information is useful to the financial officer of the organization in forecasting future cash outflows. The project manager is interested in when the budgeted cost is expected to occur and when the budgeted cost actually is charged (earned); the respective timings of these two cost figures are used to measure project schedule and cost variances.
FIGURE 5.6
Three Views of Cost
5.7 Refining Estimates
As described in Chapter 4, detailed work package estimates are aggregated and “rolled up” by deliverable to estimate the total direct cost of the project. Similarly, estimated durations are entered into the project network to establish the project schedule and determine the overall duration of the project. Experience tells us that for many projects the total estimates do not materialize and the actual costs and schedule of some projects significantly exceed original work package–based estimates. In order to compensate for the problem of actual cost and schedule exceeding estimates, some project managers adjust total costs by some multiplier (e.g., total estimated costs × 1.20).
The practice of adjusting original estimates by 20 percent or even 100 percent begs the question of why, after investing so much time and energy on detailed estimates, the numbers could be so far off. There are a number of reasons for this, most of which can be traced to the estimating process and the inherent uncertainty of predicting the future. Following are some of those reasons.
Interaction costs are hidden in estimates. According to the guidelines, each task estimate is supposed to be done independently. However, tasks are rarely completed in a vacuum. Work on one task is dependent upon prior tasks, and the hand-offs between tasks require time and attention. For example, people working on prototype development need to interact with design engineers after the design is completed, whether to simply ask clarifying questions or to make adjustments in the original design. Similarly, the time necessary to coordinate activities is typically not reflected in independent estimates. Coordination is reflected in meetings and briefings as page 153well as time necessary to resolve disconnects between tasks. Time, and therefore cost, devoted to managing interactions rises exponentially as the number of people and different disciplines involved increases on a project.
Normal conditions do not apply. Estimates are supposed to be based on normal conditions. While this is a good starting point, it rarely holds true in real life, especially when it comes to the availability of resources. Resource shortages, whether in the form of people, equipment, or materials, can extend original estimates. For example, under normal conditions four bulldozers are typically used to clear a certain site size in five days, but the availability of only three bulldozers would extend the task duration to eight days. Similarly, the decision to outsource certain tasks can increase costs as well as extend task durations, since time is added to acclimating outsiders to the particulars of the project and the culture of the organization.
Things go wrong on projects. Design flaws are revealed after the fact, extreme weather conditions occur, accidents happen, and so forth. Although you shouldn’t plan for these risks to happen when estimating a particular task, the likelihood and impact of such events need to be considered.
Project scope and plans change. As one gets further and further into the project, a manager obtains a better understanding of what needs to be done to accomplish the project. This may lead to major changes in project plans and costs. Likewise, if the project is a commercial project, changes often have to be made midstream to respond to new demands by the customer and/or competition. Unstable project scopes are a major source of cost overruns. While every effort should be made up front to nail down the project scope, it is becoming increasingly difficult to do so in our rapidly changing world.
People are overly optimistic. There is solid research indicating that people tend to overestimate how quickly they can get things done (Buehler, Griffin, & Ross, 1994; Lovallo & Kahneman, 2003).
People engage in strategic misrepresentation. There is growing evidence that some project promoters underestimate the costs of projects and overestimate project benefits in order to win approval. This appears to be particularly true for large-scale public works projects, which have a notorious habit of coming in way over budget (remember Snapshot from Practice 5.1: Portland Aerial Tram).
The reality is that for many projects not all of the information needed to make accurate estimates is available, and it is impossible to predict the future. The challenge is further compounded by human nature and the political dynamics associated with gaining project approval. The dilemma is that without solid estimates the credibility of the project plan is eroded. Deadlines become meaningless, budgets become rubbery, and accountability becomes problematic.
Such challenges will influence the final time and cost estimates. Even with the best estimating efforts, it may be necessary to revise estimates based on relevant information prior to establishing a baseline schedule and budget.
Effective organizations adjust estimates of specific tasks once the risks, resources, and particulars of the situation have been more clearly defined. They recognize that the rolled-up estimates generated from a detailed estimate based on the WBS are just the starting point. As they delve further into the project-planning process, they make appropriate revisions in both the time and cost of specific activities. They factor the final assignment of resources into the project budget and schedule. For example, when they realize that page 154only three instead of four bulldozers are available to clear a site, they adjust both the time and cost of that activity. They adjust estimates to account for specific actions to mitigate potential risks on the project. For example, to reduce the chances of design code errors, they add the cost of independent testers to the schedule and budget. Finally, organizations adjust estimates to take into account abnormal conditions. For example, if soil samples reveal excessive ground water, then they adjust foundation costs and times.
There will always be some mistakes, omissions, and adjustments that will require additional changes in estimates. Fortunately, every project should have a change management system in place to accommodate these situations and any impact on the project baseline. Change management and contingency funds will be discussed in Chapter 7.
5.8 Creating a Database for Estimating
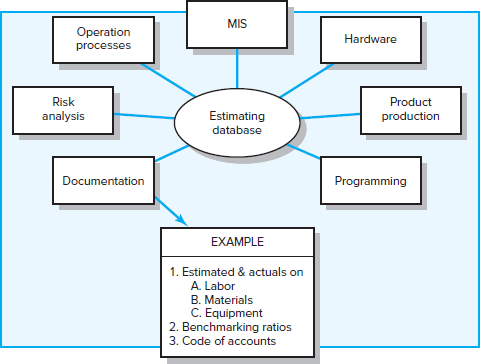
The best way to improve estimates is to collect and archive data on past project estimates and actuals. Saving historical data—estimates and actuals—provides a knowledge base for improving project time and cost estimating. Creating an estimating database is a “best practice” among leading project management organizations.
Some organizations, such as Boeing and IBM, have large estimating departments of professional estimators that have developed large time and cost databases. Others collect these data through the project office. This database approach allows the project estimator to select a specific work package item from the database for inclusion. The estimator then makes any necessary adjustments concerning the materials, labor, and equipment. Of course, any items not found in the database can be added to the project—and ultimately to the database if desired. Again, the quality of the database estimates depends upon the experience of the estimators, but over time the data quality should improve. Such structured databases serve as feedback for estimators and as benchmarks for cost and time for each project. In addition, comparison of estimate and actual for different projects can suggest the degree of risk inherent in estimates. See Figure 5.7 for the structure of a database similar to those found in practice.
FIGURE 5.7
Estimating Database Templates
page 155
5.9 Mega Projects: A Special Case
Mega projects are large-scale, complex ventures that typically cost $1 billion or more, take many years to complete, and involve multiple private and public stakeholders. They are often transformational, and impact millions of people (Flyvbjerg, 2014). Examples include high-speed rail lines, airports, healthcare reform, the Olympics, development of new aircraft, and so forth. What do these projects have in common beyond scope and complexity? They all tend to go way over budget and fall behind schedule. For example, the new Denver airport that opened in 1995 had cost overruns of 200 percent and was completed two years later than planned. The “Chunnel,” the 31-mile-plus tunnel that connects France with England, was 80 percent over budget. These are but two examples of many public works and other large-scale projects in which costs came in way over than planned. In a study of government infrastructure projects, Flyvbjerg found costs for bridges and tunnels, roads, and rails to be underestimated 34 percent, 20 percent, and 45 percent, respectively, from baseline estimates (Flyvbjerg, Bruzelius, & Rothengatter, 2003)!
Mega projects often involve a double whammy. Not only did they cost much more than expected, but they underdelivered on benefits they were to provide. The Denver airport realized only 55 percent of forecasted traffic during its first year of operation. The Chunnel traffic revenues have been one-half of what was predicted with internal rate of return of −14.5 percent! Again Flyvbjerg’s study revealed a consistent pattern of underusage on most infrastructure projects (Flyvbjerg et al., 2003), including only a 5 percent forecasted usage for the Kolkata (Calcutta) metro in India!
So why does there appear to be a consistent pattern of overestimating benefits and underestimating costs? Many argue the sheer complexity and long time horizon make it impossible to accurately estimate costs and benefits. While this is certainly true, Flyvbjerg and his colleagues’ research suggests that other factors come in to play. They concluded that in most cases project promoters use deception to promote projects not for public good but for personal gain, political or economic. Deception may be deliberate, or may be the product of overzealousness, optimism, and ignorance (Flyvbjerg et al., 2003). In some cases, promoters rationalize that nothing great would ever get built if people knew in advance what the real costs and challenges involved were (Hirschman, 1967).
On some mega projects, there is a triple whammy. Not only are they over budget and under value, but the cost of maintaining them exceeds the benefits received. These kinds of projects are called white elephants.
A “white elephant” suggests a valuable, but burdensome, possession, which its owner cannot easily dispose of and whose cost (particularly upkeep) is out of proportion with its usefulness. The term derives from the story that the Kings of Siam (now Thailand) would often make a present of a white elephant to courtiers who had fallen out of favor with the king. At first glance, it was a great honor to receive such a revered beast from the king. However, the true intent was to ruin the recipient by forcing him to absorb the costs of taking care of the animal.
Examples of white elephants abound. While traveling across southern China one of the authors was struck by the palatial stature of the Trade Expo buildings each city had. It was as if each city had tried to outdo its neighbor in terms of grandeur. When asked how often they were used, city officials would say once or twice a year. The 2015 FIFA scandal brought attention to the hidden costs of hosting the World Cup. South Africa built six new world-class stadiums for the 2010 competition. None of the post–World Cup revenue generated from these stadiums exceeds their maintenance cost (Molloy & Chetty, 2015).
page 156
White elephants are not limited to buildings and stadiums. Air France had to mothball the Concorde, the world’s fastest commercial airline, because maintenance costs and noise restrictions did not justify a three-flights-a-week schedule. It is not uncommon in our personal lives to acquire white elephants, such as underutilized vacation homes or yachts.
Flyvbjerg and others argue that cost overrun is not the price of doing big things and that we are capable of making better informed decisions on mega projects. The first step is to assume there is optimism bias and even deception on the part of promoters. Proposals should require a thorough review by impartial observers who do not have vested interest in the project. Some if not all financial risk should be absorbed by promoters and those who benefit financially from the project. Sustainable business practices should be used and maintenance costs be integrated into the forecasted cost/benefit analyses of projects. See Snapshot from Practice 5.5: Avoiding the Curse of the White Elephant to see how British organizers tried to avoid the curse of the white elephant in the 2012 Olympic games.
In particular, Flyvbjerg advocates an external view based on the outcome of similar projects completed in the past. It is called reference class forecasting (RCF) and involves three major steps:
Select a reference class of projects similar to your potential project, for example, cargo ships or bridges.
Collect and arrange outcome data as a distribution. Create a distribution of cost overruns as a percentage of the original project estimate (low to high).
Use the distribution data to arrive at a realistic forecast. Compare the original cost estimate for the project with the reference class projects. Take, for example, a three-mile-long rail tunnel project. Tunnel advocates estimate that it will cost $100 million. Analyses of similar tunnel projects in the region indicate that on average they are 34 percent over budget. If the proponents cannot come up with a reasonable explanation for why this project will be different, decision makers should assume that the tunnel will cost at least $134 million.
The benefits of RCF are compelling:
Outside empirical data mitigates human bias.
Political, strategic, and promoter forces have difficulty ignoring outside RCF information.
RCF serves as a reality check for funding large projects.
RCF helps executives avoid unsound optimism.
RCF leads to improved accountability.
RCF provides a basis for project contingency funds.
The use of RCF is increasing as governments and organizations require this method be used to temper project promoters’ estimates and reduce cost/benefit inaccuracies.
page 157
page 158
Summary
Quality time and cost estimates are the bedrock of project control. Past experience is the best starting point for these estimates. The quality of estimates is influenced by other factors such as people, technology, and downtimes. Companies that excel record past experiences and create an estimation database that provides quick and accurate information on the cost of specific work packages.
Using top-down estimates is good for initial and strategic decision making or in situations where the costs associated with developing better estimates have little benefit. However, in most cases the bottom-up approach to estimating is preferred and more reliable because it assesses each work package, rather than the whole project, section, or deliverable of a project. Estimating time and costs for each work package facilitates development of the project schedule and a time-phased budget, which are needed to control the project as it is implemented. Using the estimating guidelines will help eliminate many common mistakes made by those unacquainted with estimating times and costs for project control.
The level of time and cost detail should follow the old phrase “no more than is necessary and sufficient.” Managers must remember to differentiate among committed outlays, actual costs, and scheduled costs. It is well known that up-front efforts in clearly defining project objectives, scope, and specifications vastly improve time and cost estimate accuracy.
Culture plays a significant role in estimating. If the focus is on what went wrong instead of who is to blame, then people should be more forthright in sharing their experiences and insights. However, if you work in a punitive organizational culture that is only concerned with results, you are likely to be much more guarded in what you share and may even pad estimates out of self-protection.
Finally, large-scale mega projects like subway systems or football stadiums often suffer from underestimated costs and overestimated benefits. They also can evolve into white elephants whose cost of maintenance exceeds benefits. Steps must be taken to remove bias and compare mega project estimates with similar projects that have been done in the past.
Key Terms
Review Questions
Why are accurate estimates critical to effective project management?
How does the culture of an organization influence the quality of estimates?
What are the differences between bottom-up and top-down estimating approaches? Under what conditions would you prefer one over the other?
What are the major types of costs? Which costs are controllable by the project manager?
Why is it difficult to estimate mega project (e.g., airport, stadium) costs and benefits?
Define a white elephant in project management. Provide a real-life example.
page 159
SNAPSHOT  FROM PRACTICE
Discussion Questions
5.1 Portland Aerial Tram
Can you think of a local public project that had significant cost overruns like the Portland Tram project?
Do you agree with the statement that “nothing great would ever be built if people knew in advance what the real costs and challenges were”?
5.2 The Delphi Method
What kinds of estimates are best suited for this method?
5.3 Estimate Accuracy
Why is the range so much higher for IT projects than construction projects?
5.5 Avoiding the Curse of the White Elephant
Can you identify personal examples of white elephants?
What else do you think Olympic organizers could do to make the event more sustainable?
Exercises
Calculate the direct cost of labor for a project team member using the following data:
Hourly rate: $50/hr
Hours needed: 120
Overhead rate: 40%
Calculate the direct and total direct costs of labor for a project team member using the following data:
Hourly rate: $50/hr
Hours needed: 100
Overhead rate: 30%
The Munsters have been saving money in order to buy a house. They figure that, given current interest rates, they could afford a $400,000 home. Before looking at houses on the market they decide to explore the possibility of building a new home. The Munsters figure they could buy a suitable lot for $70,000–$75,000. At a minimum they want to build a 2,400-square-foot house. The cost for a house of the quality they desire is $160 per square foot. Given this information, should the Munsters pursue the option of building a new house?
Mrs. Publinsky and her husband, Xander, are planning their dream house. The lot for the house sits high on a hill with a beautiful view of the White Mountains. The plans show the size of the house to be 2,900 square feet. The average price for a lot and house similar to this one has been $150 per square foot. Fortunately, Xander is a retired plumber and feels he can save money by installing the plumbing himself. Mrs. Publinsky feels she can take care of the interior decorating. They both feel they can complete the exterior painting with the help of their two sons.
The following average cost information is available from a local bank that makes loans to local contractors and dispenses progress payments to contractors when specific tasks are verified as complete.
25% Excavation and framing complete 8% Roof and fireplace complete 3% Wiring roughed in 6% Plumbing roughed in 5% Siding on 17% Windows, insulation, walks, plaster, and garage complete 9% Furnace installed 4% Plumbing fixtures installed 5% Exterior painting complete 4% Light fixtures installed, finish hardware installed 6% Carpet and trim installed 4% Interior decorating 4% Floors laid and finished page 160What is the estimated cost for the Publinskys’ house if they use contractors to complete all of the house?
Estimate what the cost of the house would be if the Publinskys used their talents to do some of the work themselves.
Exercise Figure 5.1 is a project WBS with cost apportioned by percentages. If the total project cost is estimated to be $800,000, what are the estimated costs for the following deliverables?
Design
Programming
In-house testing
What weaknesses are inherent in this estimating approach?
EXERCISE FIGURE 5.1
WBS Figure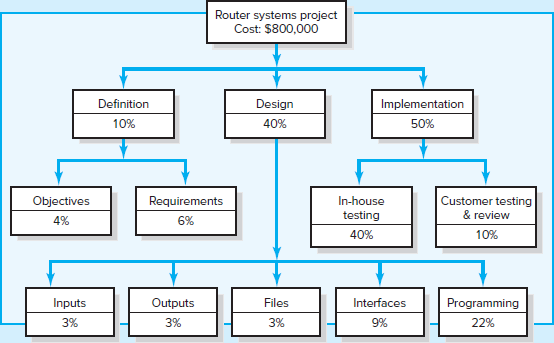
Assume you are the project manager for the Tidal 2 software project. You have been asked to calculate the expected cost for the project. Your company’s database indicates that developers can handle eight function points each person-month and that the cost per developer at your firm is $5,000 per month. You and your team of five developers have come up with the following requirements:
Elements Count Complexity Inputs 10 Low Outputs 4 Low Inquiries 4 High Files 28 Medium Interfaces 18 High Using the “complexity weighting” scheme shown in Table 5.2 and the information provided, calculate the total number of function points, the estimated cost, and the estimated duration of the Tidal 2 project.
page 161 Omega 2 Project. Using the “complexity weighting” scheme shown in Table 5.2 and the following function point complexity weight table, estimate the total function point count. Assume historical data suggest five function points equal one person a month and six people have been assigned to work on the project.
Complexity Weight Table Number of inputs 15 Rated complexity low Number of outputs 20 Rated complexity average Number of inquiries 10 Rated complexity average Number of files 30 Rated complexity average Number of interfaces 50 Rated complexity high What is the estimated project duration?
If 20 people are available for the project, what is the estimated project duration?
If the project must be completed in six months, how many people will be needed for the project?
References
Buehler, R., D. Griffin, and M. Ross, “Exploring the ‘Planning Fallacy’: Why People Underestimate Their Task Completion Times,” Journal of Personality and Social Psychology, vol. 67, no. 3 (1994), pp. 366–81.
Dalkey, N. C., D. L. Rourke, R. Lewis, and D. Snyder, Studies in the Quality of Life: Delphi and Decision Making (Lexington, MA: Lexington Books, 1972).
Flyvbjerg, B., “Curbing Optimism Bias and Strategic Misrepresentation in Planning: Reference Class Forecasting in Practice,” European Planning Studies, vol. 16, no. 1 (January 2008), pp. 3–21.
Flyvbjerg, B., “From Nobel Prize to Project Management: Getting Risks Right,” Project Management Journal, August 2006, pp. 5–15.
Flyvbjerg, B., “What You Should Know about Megaprojects and Why: An Overview,” Project Management Journal, vol. 45, no. 2 (April/May 2014), pp. 6–19.
Flyvbjerg, B., N. Bruzelius, and W. Rothengatter, Mega Projects and Risk: An Anatomy of Ambition (UK: Cambridge University Press, 2003).
Gray, N. S., “Secrets to Creating the Elusive ‘Accurate Estimate,’” PM Network, August 2001, p. 56.
Hirschman. A. O., “The Principle of the Hiding Hand,” The Public Interest, Winter 1967, pp. 10–23.
Jeffery, R., G. C. Low, and M. Barnes, “A Comparison of Function Point Counting Techniques,” IEEE Transactions on Software Engineering, vol. 19, no. 5 (1993), pp. 529–32.
Jones, C., Applied Software Measurement (New York: McGraw-Hill, 1991).
Jones, C., Estimating Software Costs (New York: McGraw-Hill, 1998).
Kharbanda, O. P., and J. K. Pinto, What Made Gertie Gallop: Learning from Project Failures (New York: Von Nostrand Reinhold, 1996).
Lovallo, D., and D. Kahneman, “Delusions of Success: How Optimism Undermines Executives’ Decisions,” Harvard Business Review, July 2003, pp. 56–63.
page 162
Magne, E., K. Emhjellenm, and P. Osmundsen, “Cost Estimation Overruns in the North Sea,” Project Management Journal, vol. 34, no. 1 (2003), pp. 23–29.
McLeod, G., and D. Smith, Managing Information Technology Projects (Cambridge, MA: Course Technology, 1996).
Molloy, E., and T. Chetty, “The Rocky Road to Legacy: Lessons from the 2010 FIFA World Cup South Africa Stadium Program,” Project Management Journal, vol. 46, no. 3 (June/July 2015), pp. 88–107.
Symons, C. R., “Function Point Analysis: Difficulties and Improvements,” IEEE Transactions on Software Engineering, vol. 14, no. 1 (1988), pp. 2–11.
Walters, D. J., P. Fernbach, C. Fox, and S. Sloman, “Known Unknowns: A Critical Determinant of Confidence and Calibration,” Management Science, vol. 63, no. 12 (2017), pp. 3999–4446.
Case 5.1
Sharp Printing, AG
Three years ago the Sharp Printing (SP) strategic management group set a goal of having a color laser printer available for the consumer and small business market for less than $200. A few months later the senior management met off-site to discuss the new product. The results of this meeting were a set of general technical specifications along with major deliverables, a product launch date, and a cost estimate based on prior experience.
Shortly afterward a meeting was arranged for middle management explaining the project goals, major responsibilities, project start date, and importance of meeting the product launch date within the cost estimate. Members of all departments involved attended the meeting. Excitement was high. Although everyone saw the risks as high, the promised rewards for the company and the personnel were emblazoned in their minds. A few participants questioned the legitimacy of the project duration and cost estimates. A couple of R&D people were worried about the technology required to produce the high-quality product for less than $200. But given the excitement of the moment, everyone agreed the project was worth doing and doable. The color laser printer project was to have the highest project priority in the company.
Lauren was selected to be the project manager. She had 15 years of experience in printer design and manufacture, which included successful management of several projects related to printers for commercial markets. Since she was one of those uncomfortable with the project cost and time estimates, she felt getting good bottom-up time and cost estimates for the deliverables was her first concern. She quickly had a meeting with the significant stakeholders to create a WBS identifying the work packages and organization unit responsible for implementing the work packages. Lauren stressed that she wanted time and cost estimates from those who would do the work or were the most knowledgeable, if possible. Getting estimates from more than one source was encouraged. Estimates were due in two weeks.
The compiled estimates were placed in the WBS/OBS. The corresponding cost estimate seemed to be in error. The cost estimate was $1,250,000 over the top-down senior page 163management estimate; this represented about a 20 percent overrun! Furthermore, the bottom-up time estimate based on the project network was four months longer than the top management time estimate. Another meeting was scheduled with the significant stakeholders to check the estimates and to brainstorm for alternative solutions. At this meeting everyone agreed the bottom-up cost and time estimates appeared to be accurate. Following are some of the suggestions from the brainstorming session.
Change scope.
Outsource technology design.
Use the priority matrix (found in Chapter 4) to get top management to clarify their priorities.
Partner with another organization or build a research consortium to share costs and to share the newly developed technology and production methods.
Cancel the project.
Commission a break-even study for the laser printer.
Very little in the way of concrete savings was identified, although there was consensus that time could be compressed to the market launch date, but at additional costs.
Lauren met with the marketing (Connor), production (Kim), and design (Gage) managers, who yielded some ideas for cutting costs, but nothing significant enough to have a large impact. Gage remarked, “I wouldn’t want to be the one to deliver the message to top management that their cost estimate is $1,250,000 off! Good luck, Lauren.”
At this point, what would you do if you were the project manager?
Was top management acting correctly in developing an estimate?
What estimating techniques should be used for a mission-critical project such as this?
Case 5.2
Post-Graduation Adventure
Josh and Mike met as roommates during freshman year at Macalester College in St. Paul, Minnesota. Despite a rocky start they became best friends. They are planning a two-week adventure together to celebrate their graduation in June. Josh has never been to Europe and wants to visit France or Spain. Mike spent a semester abroad in Aarhus, Denmark, and traveled extensively in northern Europe. Even though Mike has never been to France or Spain, he wants to go to someplace more exotic, like South Africa or Vietnam. For the past week they have been arguing over where they should go. Josh argues that it will cost too much to fly to South Africa or Vietnam, while Mike counters that it will be much cheaper to travel in Vietnam or South Africa once they are there. They agree that they can spend no more than $3,500 each on the trip and could be gone for only two weeks.
One evening when they were arguing with each other over beers with friends, Sara said, “Why don’t you use what you learned in your project management class to decide what to do?” Josh and Mike looked at each other and agreed that made perfect sense.
Assume you are either Mike or Josh; how would you go about making a decision using project management methodology?
Looking first at only cost, what decision would you make?
After cost, what other factors should be considered before making a decision?
page 164
Appendix 5.1
Learning Curves for Estimating
A forecast estimate of the time required to perform a work package or task is a basic necessity for scheduling the project. In some cases the manager simply uses judgment and past experience to estimate work package time or uses historical records of similar tasks.
Most managers and workers intuitively know that improvement in the amount of time required to perform a task or group of tasks occurs with repetition. A worker can perform a task better/quicker the second time and each succeeding time she performs it (without any technological change). It is this pattern of improvement that is important to the project manager and project scheduler.
This improvement from repetition generally results in a reduction of labor hours for the accomplishment of tasks and results in lower project costs. From empirical evidence across all industries, the pattern of this improvement has been quantified in the learning curve (also known as improvement curve, experience curve, and industrial progress curve), which is described by the following relationship:
Each time the output quantity doubles, the unit labor hours are reduced at a constant rate.
For example, assume that a manufacturer has a new contract for 16 prototype units and a total of 800 labor hours were required for the first unit. Past experience has indicated that on similar types of units the improvement rate has been 80 percent. This relationship of improvement in labor hours is shown below:
| Unit | Labor Hours | |
| 1 | 800 | |
| 2 | 800 × .80 = | 640 |
| 4 | 640 × .80 = | 512 |
| 8 | 512 × .80 = | 410 |
| 16 | 410 × .80 = | 328 |
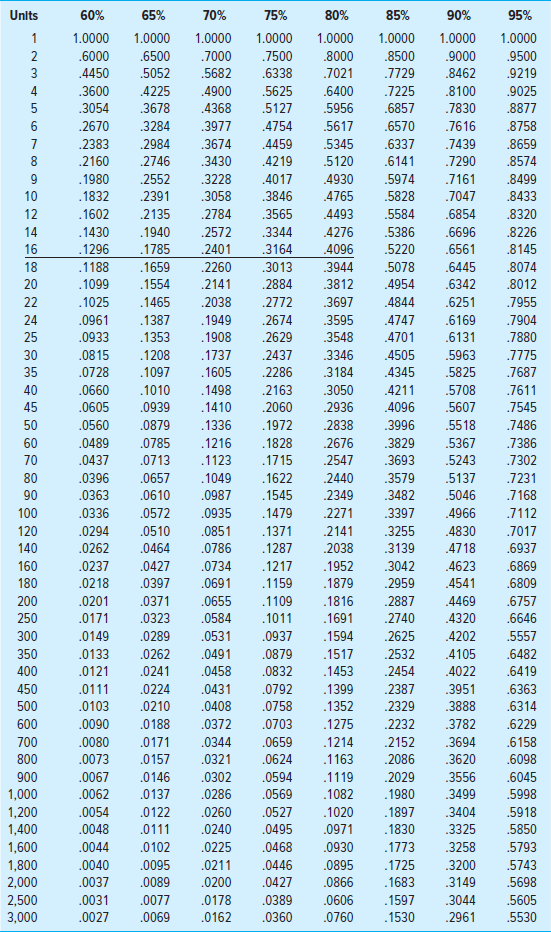
By using Table A5.1 unit values, similar labor hours per unit can be determined. Looking across the 16 unit level and down the 80 percent column, we find a ratio of .4096. By multiplying this ratio times the labor hours for the first unit, we obtain the per unit value:

That is, the 16th unit should require close to 328 labor hours, assuming an 80 percent improvement ratio.
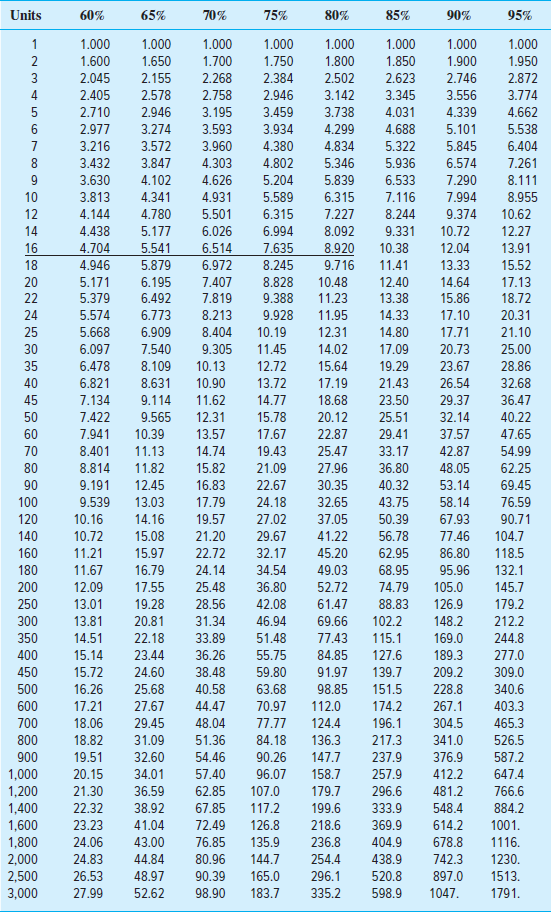
Obviously a project manager may need more than a single unit value for estimating the time for some work packages. The cumulative values in Table A5.2 provide factors for computing the cumulative total labor hours of all units. In the previous example, for the first 16 units, the total labor hours required would be

page 165
TABLE A5.1
Learning Curves Unit Values
page 166
TABLE A5.2
Learning Curves Cumulative Values
page 167
By dividing the total cumulative hours (7,136) by the units, the average unit labor hours can be obtained:

Note how the labor hours for the 16th unit (328) differs from the average for all 16 units (446). The project manager, knowing the average labor costs and processing costs, could estimate the total prototype costs. (The mathematical derivation of factors found in Tables A5.1 and A5.2 can be found in Jelen, F. C., and J. H. Black, Cost and Optimization Engineering, 2nd ed. (New York: McGraw-Hill, 1983.)
FOLLOW-ON CONTRACT EXAMPLE
Assume the project manager gets a follow-on order of 74 units; how should he estimate labor hours and cost? Going to the cumulative Table A5.2 we find at the 80 percent ratio and 90 total units intersection—a 30.35 ratio.
| 800 × 30.35 = | 24,280 labor hours for 90 units |
| Less previous 16 units = | 7,136 |
| Total follow-on order = | 17,144 labor hours |
| 17,144/74 equals 232 average labor hours per unit | |
Labor hours for the 90th unit can be obtained from Table A5.1: .2349 × 800 = 187.9 labor hours. (For ratios between given values, simply estimate.)
Exercise A5.1
Norwegian Satellite Development Company (NSDC)
Cost Estimates
for
World Satellite Telephone Exchange Project
NSDC has a contract to produce eight satellites to support a worldwide telephone system (for Alaska Telecom, Inc.) that allows individuals to use a single, portable telephone in any location on earth to call in and out. NSDC will develop and produce the eight units. NSDC has estimated that the R&D costs will be NOK (Norwegian Krone) 12,000,000. Material costs are expected to be NOK 6,000,000. They have estimated that the design and production of the first satellite will require 100,000 labor hours, and an 80 percent improvement curve is expected. Skilled labor cost is NOK 300 per hour. Desired profit for all projects is 25 percent of total costs.
How many labor hours should the eighth satellite require?
How many labor hours for the whole project of eight satellites?
What price would you ask for the project? Why?
Midway through the project your design and production people realize that a 75 percent improvement curve is more appropriate. What impact does this have on the project?
Near the end of the project, Deutsch Telefon AG requests a cost estimate for four satellites identical to those you have already produced. What price will you quote them? Justify your price.
Design elements: Snapshot from Practice, Highlight box, Case icon: ©Sky Designs/Shutterstock