This appendix shows calculations for the main economic effects expected to result from this book's proposed changes to federal tax and support policy. These outcomes include: (1) reductions in subsidies and other support to the animal food industry, (2) a drop in consumption of animal foods, (3) a new tax burden for taxpayers, (4) a new tax credit for taxpayers, (5) an increase in tax revenue, (6) higher federal government outflows associated with the tax credit, (7) lower state and federal government outflows under Medicare and Medicaid programs, (8) a cash surplus for the federal government, and (9) decreases in externalized costs. As a reminder, economics is not a precise science, so while these figures may seem meticulously calculated, they are just estimates. You don't really know how something will play out until you try it, although you can certainly make predictions.
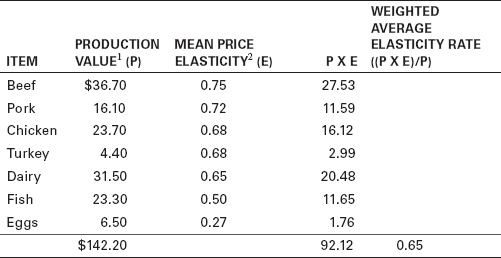
The following calculations use a constant of 0.65 as the price elasticity of demand for animal foods. This constant is a weighted average based on the individual fair market values of animal foods produced yearly and their respective price elasticities, as shown in table C1. Note that “production value,” roughly analogous to wholesale value, is used rather than retail value because retail sales data for individual animal foods is not uniformly available.
TABLE C1 Animal Food Production Values, Elasticities, and Weighted Average Elasticity Rate (dollar amounts in billions)1, 2
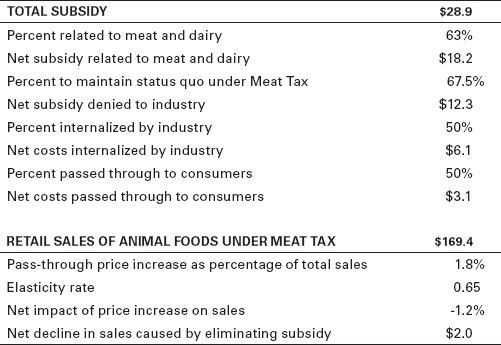
The proposed support changes affect two categories. First, there's the gross figure of $28.9 billion that the USDA spends supporting US farmers with loans, insurance, research, marketing assistance, and other help (the research and marketing subsidy).3 My recommendation is to eliminate the portion of this subsidy related to animal food production, which is roughly $18.2 billion.4 Loss of this subsidy will have an effect on both producers and consumers.
From the producers' perspective, because the Meat Tax will cause consumption (and production) of animal foods to decline by 32.5 percent (see “Drop in Consumption” below), the portion of this subsidy on which producers would rely in order to maintain the status quo after adjusting sales for the effects of the Meat Tax is 67.5 percent (1 – 0.325) of $18.2 billion, or $12.3 billion. In other words, following the drop in consumption, a subsidy of only $12.3 billion will allow producers to maintain production at the new, lower level.
In the absence of data predicting how producers are likely to respond to the loss of certain services, it is reasonable to assume that they will choose to discontinue roughly half of these formerly subsidized services and continue half at their own expense ($6.1 billion). And in light of data showing that producers typically internalize some portion of increases in production costs (ranging from a minority to a majority of such costs), it is reasonable to assume further that producers will internalize roughly half of these costs and pass the other half ($3 billion) on to consumers.5 The resulting price increase is roughly 1.8 percent of the total retail sales of animal foods, after reducing this sales figure for the effects of the Meat Tax (see “Drop in Consumption” below). Table C2 shows the effect of applying the demand elasticity constant of 0.65 to this increase: eliminating this subsidy will cause consumer demand to decline by about 1.2 percent.
TABLE C2 Effects of Eliminating Research and Marketing Subsidy (dollar amounts in billions)
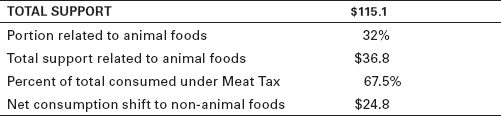
The second support change affects the gross figure of $115.1 billion in food and nutrition assistance that the USDA provides to low-income Americans. My recommendation is to exclude animal foods from nutrition assistance programs. Applying the 32 percent multiplier introduced in chapter 5 (consumer spending on animal foods as a portion of total retail food spending) yields a total of $36.8 billion related to animal foods to be shifted to non-animal foods.6 In a Meat Tax economy, because consumption of animal foods is lower by 32.5 percent, excluding animal foods from nutrition support represents a net decline in animal food sales of 67.5 percent of $36.8 billion, or $24.8 billion. This figure represents 14.6 percent of the total retail sales under the Meat Tax of $169.4 billion.
TABLE C3 Effects of Excluding Animal Foods from Nutrition Support (dollar amounts in billions)
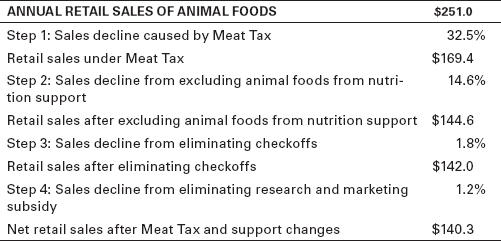
This proposal would cause annual US consumption of animal foods to fall by an estimated 44.1 percent, from $251 billion to $140 billion. It's easiest to explain this drop as occurring in multiple steps. First, with demand elasticity at 0.65, the 50 percent tax and resulting price increase causes consumption to drop by 32.5 percent (0.5 x 0.65)—yielding an initial sales decline from $251 billion to $169 billion. Next, as we saw above, excluding animal foods from nutrition support causes these sales to decline by a further 14.6 percent, eliminating checkoffs causes a further sales decline of 1.8 percent,7 and eliminating the research and marketing subsidy causes sales to further decline by 1.2 percent. The net result is that retail sales fall to about $140.3 billion, 44.1 percent below their current level. Note that there is no particular importance in the order of these steps; the net result of $140.3 billion is the same regardless of how the steps are sequenced.
TABLE C4 Effects of Meat Tax and Support Changes on Quantity Demanded (dollar amounts in billions)
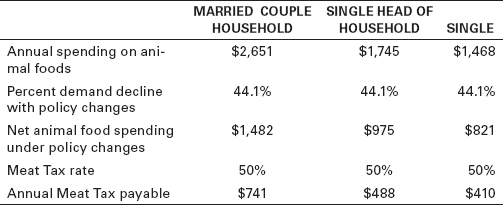
The Meat Tax will impose a new tax burden on Americans. We can calculate this burden by determining consumption levels under the Meat Tax, and then determining the tax paid by consumers at those consumption levels. The US Bureau of Labor Statistics estimates that on average, American family units spend between $1,468 and $2,651 yearly on meat, eggs, dairy, and fish.8 Table C5 shows the Meat Tax's estimated burden on Americans by family unit type, after accounting for projected declines in consumption.
TABLE C5 Meat Tax Burden on American Family Units
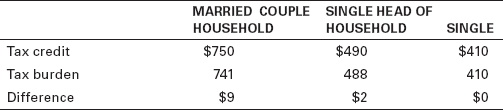
The proposal includes providing tax credits to offset the cost of the Meat Tax to individual taxpayers. Rounding each family unit's Meat Tax–related burden up to the nearest multiple of $10 to determine the appropriate credit amount, the proposed credits and projected tax relief are as shown in table C6.
TABLE C6 Tax Credits and Burdens by Family Unit
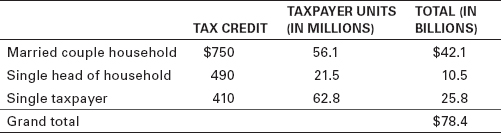
Using the Internal Revenue Service's figures for taxpayers by family unit type, the proposed tax credits would cost an estimated $78.4 billion, as shown in table C7.
TABLE C7 Cost of Tax Credits9
Another effect of the proposed changes is to lower state and federal expenditures on Medicare and Medicaid programs. Of all US health care expenditures, Medicare pays an average of 20 percent and Medicaid an average of 15 percent.10 Accordingly, reductions in direct US health care costs associated with animal food consumption will lead to lower government payments under these programs, as shown in table C8. The federal government pays all Medicare costs and roughly two-thirds of Medicaid costs, yielding total annual federal savings of $22.4 billion. The total annual state savings are $3.6 billion. (Note that because these savings relate to gains in wellness that will be achieved only as individual eating habits lead to fewer health care problems, it may take several years of improvement in diet and health before these gains are fully realized each year.)
TABLE C8 Reduced Government Payments to Medicare and Medicaid Programs (dollar amounts in billions)
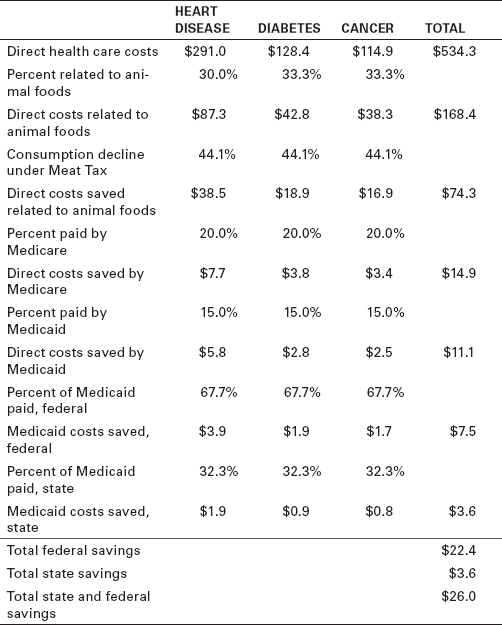
(Note that the direct health care costs itemized above are significantly lower than the total health care costs attributable to these three diseases. That's because the total costs include indirect costs such as lost wages, which are excluded from the above calculations as they do not affect Medicare or Medicaid.)
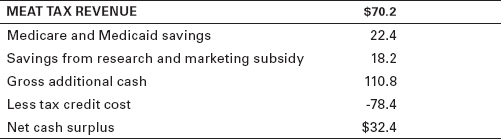
Using data from tables C2, C4, C7, and C8, we can estimate the annual impact these proposed changes will have on cash in the US Treasury. With adjusted retail sales of animal foods at $140.3 billion and a tax rate of 50 percent, the Meat Tax will generate tax revenue of about $70.2 billion. Combining this with the other estimated figures yields a total annual federal cash surplus of about $32.4 billion, as shown in table C9.
TABLE C9 Changes in US Treasury's Cash Flow (in billions)
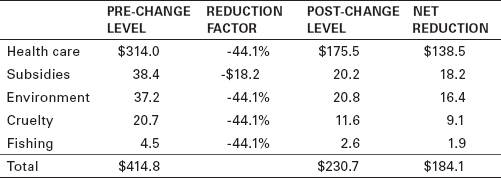
Finally, the Meat Tax and other proposed changes would greatly reduce the externalized costs of meat and dairy production. As shown in table C10, the total annual reduction in externalized costs is estimated at roughly $184 billion. With the exception of subsidies, all externalized costs would be reduced by 44.1 percent, which is the factor by which the policy changes are estimated to reduce consumption and hence production. Subsidies are reduced by the amount of the research and marketing subsidy proposed to be eliminated.
TABLE C10 Annual Reduction in Externalized Costs of Animal Foods Resulting from Meat Tax and Other Changes (dollar amounts in billions)