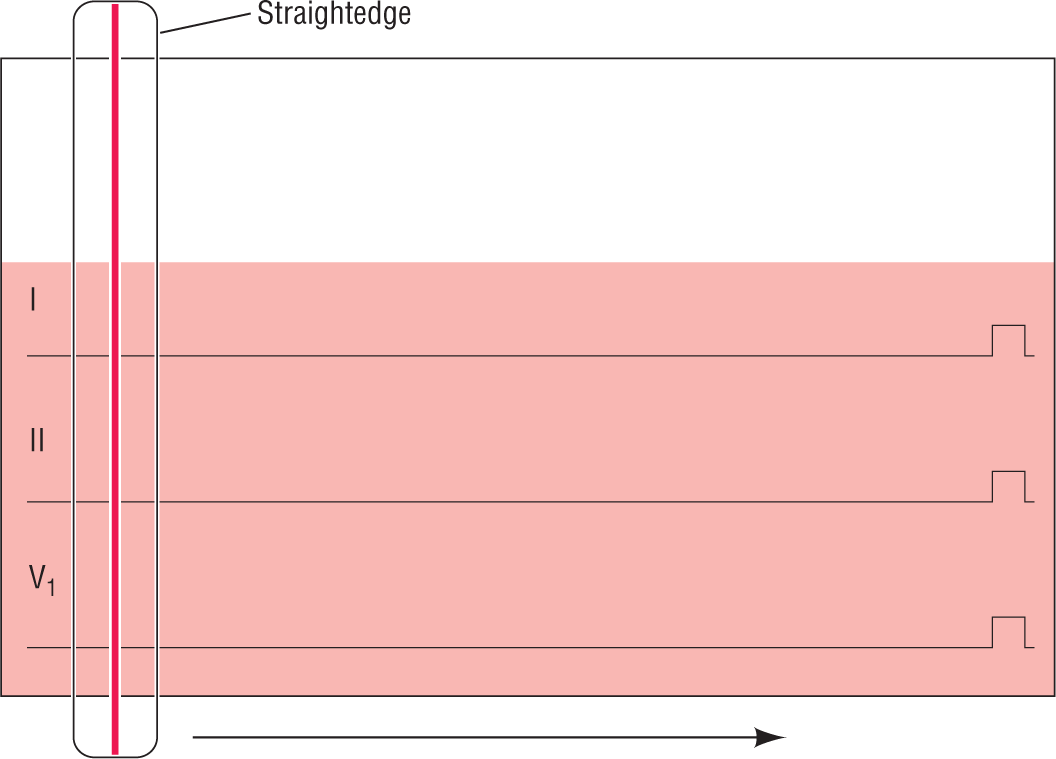
Figure 3-3 The red line represents time; events that touch the red line occurred simultaneously.
© Jones & Bartlett Learning.
Temporal Relationship of Multiple-Lead Strips
Quite frequently, you may obtain an ECG that has three or more leads occurring simultaneously in real time. The leads that are to be viewed will be programmed by the person obtaining the strip directly on the machine. The resulting strip will present the leads, one on top of the other.
When you have a multiple-lead strip, it is critical to remember that the events shown on the paper are occurring at exactly the same time across all the visible leads when viewed vertically. For example, imagine that we have a transparent ruler with a red line running through it, placed on top of the ECG (Figure 3-3). As we move the ruler across the paper, each event that is touching that perpendicular red line occurred at the same moment. The ECG machine’s computer is capable of measuring three or more leads at once and representing them on the ECG simultaneously. Please note that only those events touching the red line occurred simultaneously. Always check that the tips of the complexes are found along the same vertical line on the ECG paper. This protects you against making a mistake in interpreting the complexes.

Figure 3-3 The red line represents time; events that touch the red line occurred simultaneously.
© Jones & Bartlett Learning.
Why Is Temporal Spacing Important?
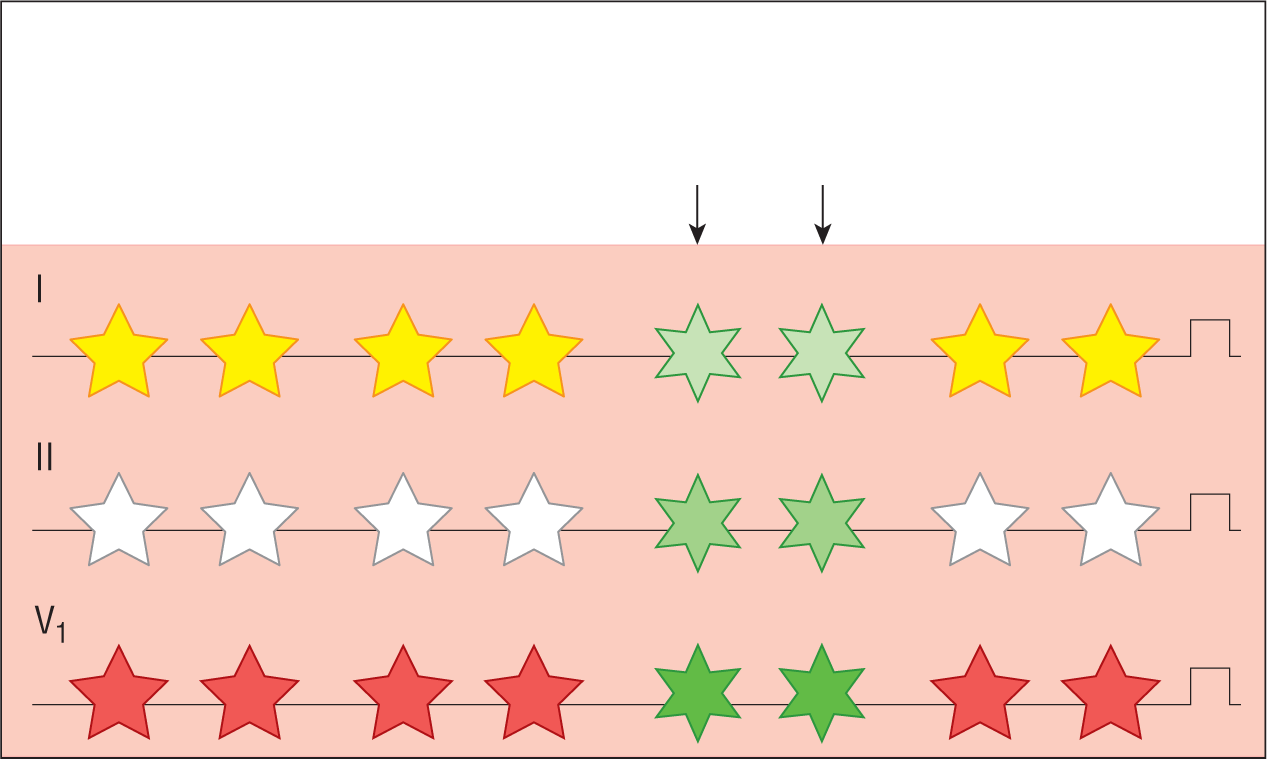
Why are we making such a big deal about this temporal spacing thing? Consider a situation such as the one shown in Figure 3-4. To simplify matters, we have represented the complexes as stars, both five- and six-pointed. As you are interpreting the rhythm strip, you notice on the lead V1 rhythm strip that the fifth and sixth complexes are different; they are six-pointed stars instead of the baseline five-pointed ones. You can use this information to alter your interpretation appropriately in the other leads where the sixth point may not be as clearly visible. If you did not have a multiple-lead rhythm strip to show you that these two aberrant complexes were different, you could easily misinterpret the strip. Thanks to the multiple-lead rhythm strip, when you interpret the complexes appearing in leads I and II, you will take into account that the morphology of these QRS complexes is different from the others, and you can make the right interpretation and diagnosis.

Figure 3-4 Different types of stars represent different morphologies.
© Jones & Bartlett Learning.
Let’s make the point crystal clear: This knowledge could dramatically alter your final diagnosis. It can—and we are trying not to be too dramatic here—save the patient’s life. For a great example, see the scenarios in Chapter 40, Putting It All Together. Among other things, temporal spacing is very important in determining rhythms, intervals, ST-segment changes, premature complexes, and aberrantly conducted beats.