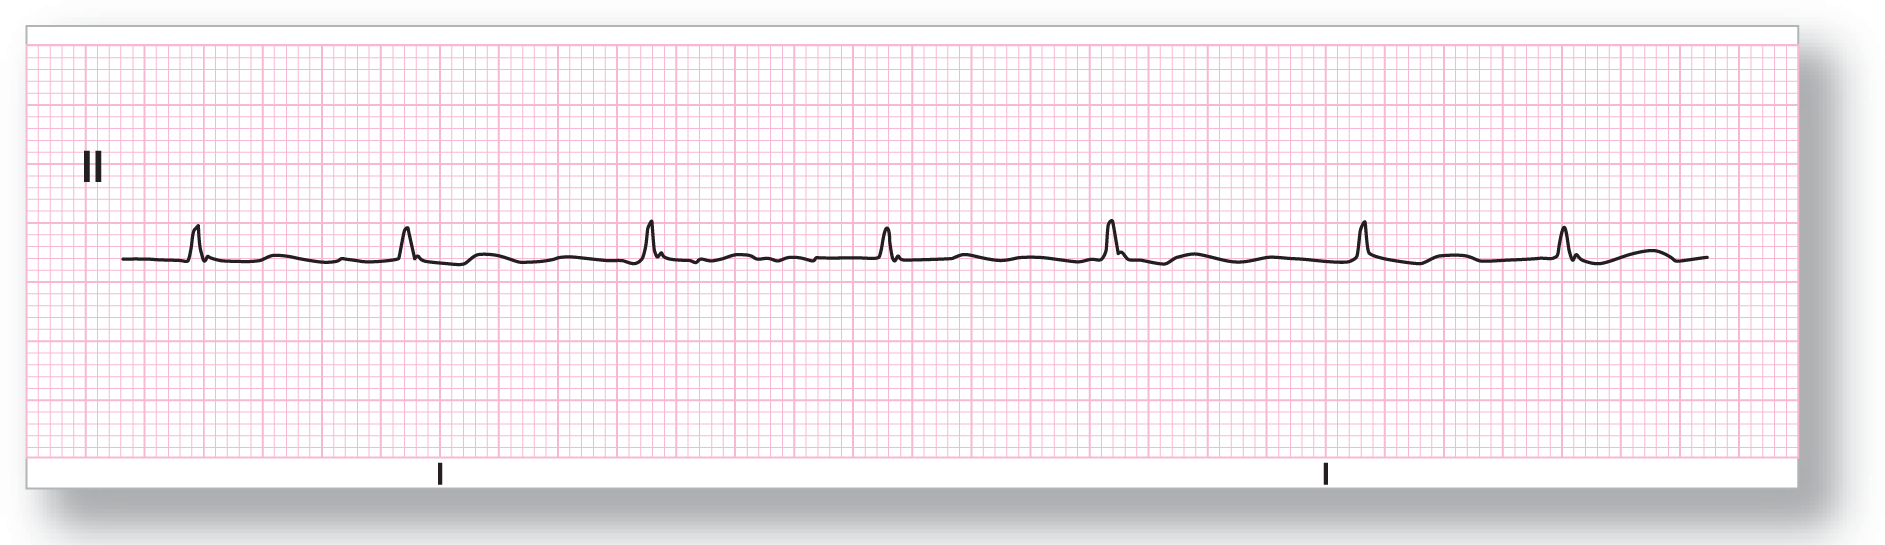
Figure 16-4 What is the rhythm?
From Arrhythmia Recognition: The Art of Interpretation, courtesy of Tomas B. Garcia, MD.
Take a look at Figure 16-4. Can you recognize the rhythm? Notice that there are no discernible P waves that repeat throughout the strip. The rhythm is irregularly irregular and in the normal range for rate. The QRS complexes are normal and there are minimal non-specific changes in the ST segments. Those of you with some previous arrhythmia recognition background may say that the rhythm is atrial fibrillation and, based on this strip alone, you could be right. But is that the right answer?
Figure 16-4 What is the rhythm?
From Arrhythmia Recognition: The Art of Interpretation, courtesy of Tomas B. Garcia, MD.
Now, take a look at another strip taken from the same patient (Figure 16-5). Can you figure out why the rhythms appear to be so clearly different? The answer lies in the leads that were used. In Figure 16-4, lead II was used. In Figure 16-5, lead V1 was used. In the strip taken from lead V1, we see clearly that there are some P waves. They are recurrent, reproducible, and consistent. That knocks out the theory that this is atrial fibrillation.
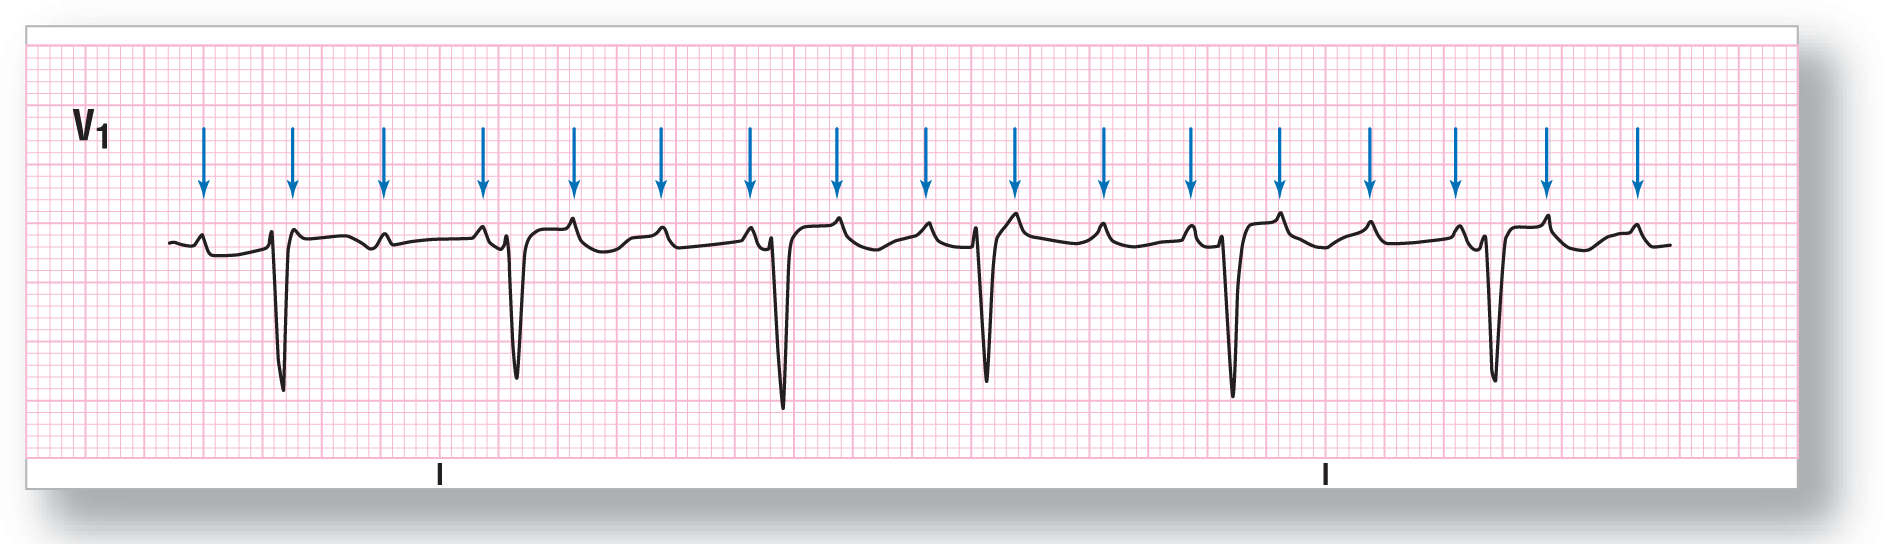
Figure 16-5 What is the rhythm? The P waves are obvious in lead V1 (see blue arrows) when compared to lead II.
From Arrhythmia Recognition: The Art of Interpretation, courtesy of Tomas B. Garcia, MD.
So, what is the rhythm? Let’s go over the information slowly and methodically. As we mentioned, the P waves are regular. In addition, they are occurring at a very fast rate. This is definitely an atrial tachycardia. Now, are the P waves consistent with sinus P-wave morphology? You need an old strip or ECG to correctly answer that question beyond a reasonable doubt, but we can make an educated guess, looking at the strip, that they are not. Let’s keep going.
How fast are the atria going? The atrial rate is about 200 BPM! Remember, the normal rate for a sinus tachycardia is between 100 and 160 BPM, although rates as high as 220 BPM have been documented. This is at the higher end of the sinus tachycardia spectrum. Focal ATs are usually between 100 and 200 BPM, but rates as high as 250 BPM are not uncommon. Therefore, it is more likely that a focal AT is the answer, but we can’t be sure.
Are the P waves upright in lead II? Remember, P waves are normally upright in lead II because the normal atrial repolarization wave travels toward leads I and II (Figure16-6). In Figure 16-1, the P waves are isoelectric in lead II. That means that, at the very least, the P wave axis of the atria is not normal. In other words, there is a very high possibility that the P waves are starting at an ectopic focus. Putting this together with the rate information makes focal AT the most likely culprit. Once again, a previous strip showing the sinus P-wave morphology would be confirmatory.

Figure 16-6 The sinus node and the P-wave axis. This Figure graphically represents the P-wave axis as a light blue vector heading inferiorly and to the left. Note that the vector is heading toward the positive poles of leads I and II. Remember, a vector heading toward the positive pole of a lead gives rise electrocardiographically to an upright or positive wave in that lead. Since an impulse that originated in the sinus node can only travel downward and to the left, then the P wave has to be upright in leads I, II, III, aVF, V5, and V6.
© Jones & Bartlett Learning.
To close out our discussion of problems with lead II in focal AT with block, let’s go over an important clinical point. Usually, the ventricular response to the atrial tachycardia is regular. In Figures 16-4 and 16-5, the ventricular response was irregular. This occurred because of a variable AV block (for a full discussion, see Chapter 28, Atrioventricular Blocks). If the P waves in lead II are isoelectric or of small amplitude, the appearance of the strip could easily be misdiagnosed as atrial fibrillation by an experienced clinician. You need to have a high index of suspicion when approaching any rhythm abnormality, especially focal AT with block.
Another clinical point to keep in mind is that focal AT with block is quite often associated with digitalis toxicity. What is the primary use today for digitalis? It is primarily used to control chronic atrial fibrillation. If you have a strip like Figure 16-4, you may diagnose it quickly as atrial fibrillation and not think twice about your diagnosis. As part of your treatment, you may actually give the patient more digitalis. As you can imagine, this could be a fatal mistake if the patient’s rhythm was actually a focal AT with block caused by digoxin toxicity. Giving more digitalis to a toxic patient would be like adding fuel to a fire.
The take-home message in this section is that lead II alone is not always dependable to make the diagnosis in many rhythms, and especially in focal AT with block. If the P waves are isoelectric or of small amplitude, the chance of missing the diagnosis could be very high. Whenever you see a change in a patient’s rhythm, especially in someone taking digoxin, you should obtain a full 12-lead ECG and look at all of the leads to evaluate the rhythm correctly.
ARRHYTHMIA RECOGNITION
Focal Atrial Tachycardia with Block
| Rate: | Atrial 150 to 250 BPM; variable ventricular rate |
| Regularity: | Regular or regularly irregular |
| P wave:
Morphology: Upright in II, III, and aVF: |
Present
Different Sometimes |
| P:QRS ratio: | Variable due to type of AV block |
| PR interval: | Variable due to type of AV block |
| QRS width: | Normal |
| Grouping: | Usually none |
| Dropped beats: | Yes |
DIFFERENTIAL DIAGNOSIS
Focal Atrial Tachycardia with Block
CLINICAL PEARL
If you ever see a P wave near the midpoint between two QRS complexes, look for a buried P wave. Very long PR intervals are much less common than arrhythmias containing a 2:1 block!
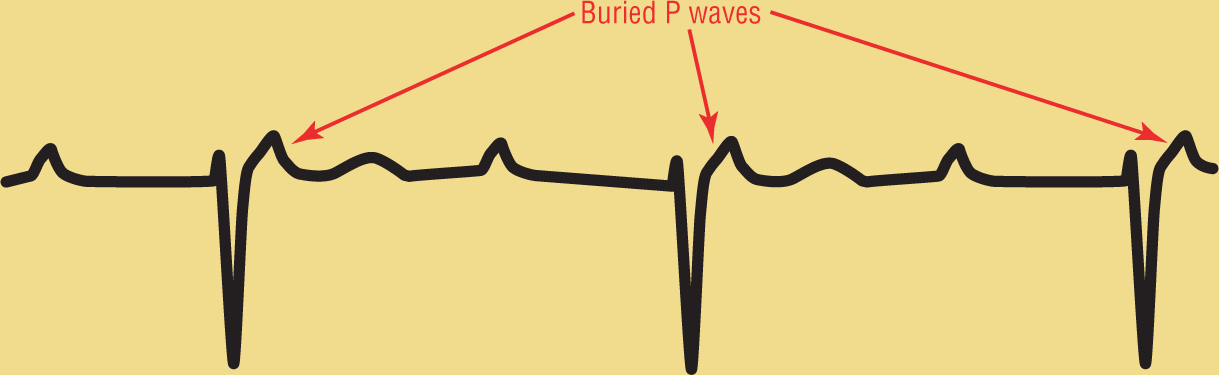
Figure 16-7 This is not a sinus rhythm with a first-degree AV block!
© Jones & Bartlett Learning.
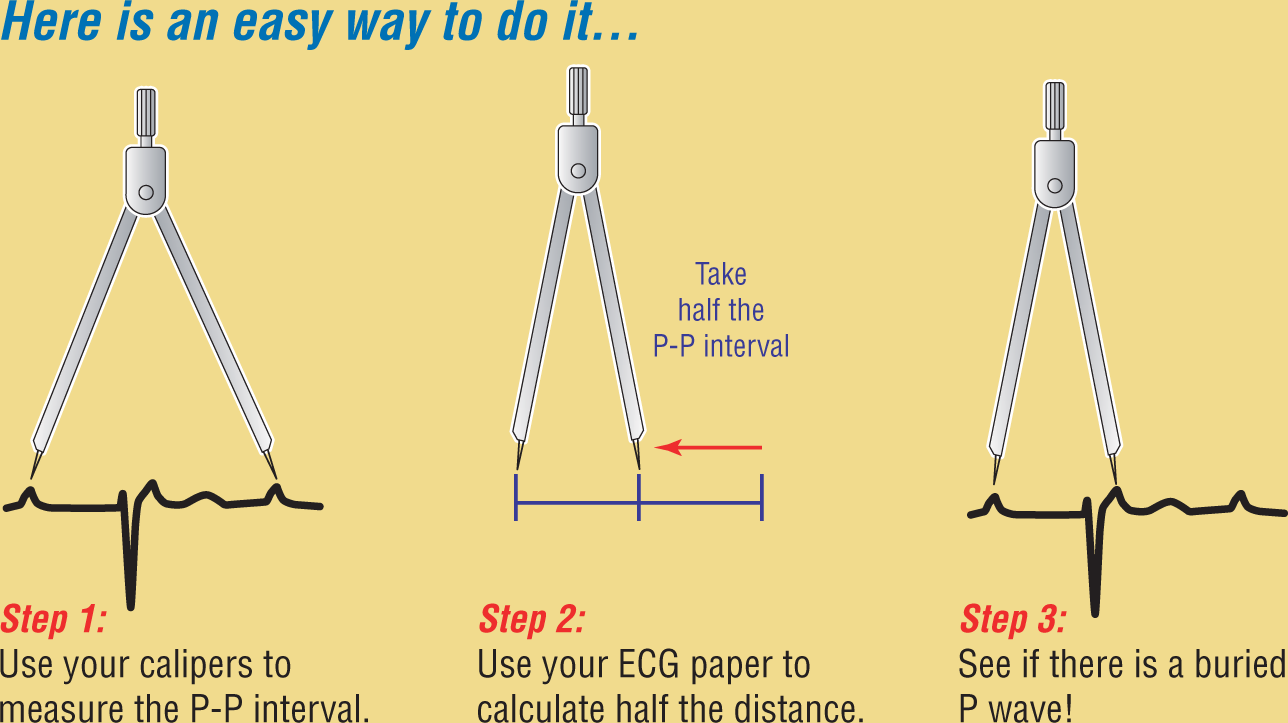
Figure 16-8 Identifying a buried P wave.
© Jones & Bartlett Learning.
Description