Table 9.1 QCA truth table (outcome: positive attitude change), all observations

Factors that matter for reconciliation1
The objective of this chapter is to apply a fuzzy-set Qualitative Comparative Analysis (QCA) that provides insights on how contextual settings can influence locals’ attitudes towards conflict transformation. Drawing on the survey data from Mindanao and Maluku (375 respondents from eight village-level locations), the aim of this particular QCA design is to discern potential effects on individual attitude change not only by looking at project participation (as in the previous chapters) but also by gauging a set of relevant socioeconomic, ethnic, and religious conditions.
Our QCA design features six conditions which were identified and extracted from the survey data and one outcome indicator. The outcome indicator (methodologically equivalent to the “dependent variable” in regression analysis) is concerned with measuring the attitude change of community members towards other religious groups that participated in local conflicts. This outcome includes an intertemporal component. Two survey data points are used to determine self-perceived improvements in attitude “before” and “after” participating in a church-based activity.2 Furthermore, the outcome score contains three sets of questionnaire results measuring attitudes towards other religious beliefs, towards religious violence, and towards members of other religious groups.3
The six conditions considered in this research design include the following aspects: first, participation in church-based activities (Q25 and Q31a); second, the level of education (approximated by “the highest attained school degree,” QB05); third, the level of income and financial wellbeing (approximated by reported annual incomes and consumption baskets, Q1a-x and B06); fourth, the level of social capital and community solidarity (approximated by self-perceived social positions, levels of local respect and trust, Q15b and Q8n/m); fifth, the level of fundamentalist religious preferences in politics and state affairs (approximated by influence of religious norms in state affairs and politics, Q14b, Q14j, Q14k); and sixth, the level of ethnic identification of respondents (approximated by the importance of ethnic membership, Q6c_a, Q8k, and Q13b).
In the following research setup, the established conditions are to be tested for their effect on the outcome. The QCA method based on Boolean algebra provides a unique opportunity to not only analyze the isolated effects of conditions on the outcome but also to consider the relevance of specific effect combinations as well. The QCA research design provides “terms” (or condition combinations) as results, indicating which conditions together have a measurable effect on the outcome. Using this technique, interactions of reinforcing or mitigating effects become visible in the resulting combinations.4 Based on outlined conditions, the analysis was guided by a number of research propositions:
We briefly consider each of these propositions. Church-based activities are intended to contribute to interfaith dialogue, peaceful cohabitation, and local reconciliation. The participation levels in such activities (proposition 1) should therefore provide a positive effect on our designated outcome. Higher levels of education (proposition 2) are likely to stimulate personal reflection and provide new socioeconomic opportunities, both of which may reduce personal grievances and stimulate interfaith tolerance. Higher income levels (proposition 3) go hand in hand with less precarious living conditions and, as such, with lower risks of economically induced mobilization against other religious groups. The effect of social capital (proposition 4) depends on the nature and scope of local solidarity. If local solidarity and trust are narrowly confined to members of one specific religious and/
Table 9.1 QCA truth table (outcome: positive attitude change), all observations
or ethnic group – “bonding” social capital – then one might not expect pronounced attitude changes. However, if a community evinces solidarity and trust networks that cut across religious and ethnic boundaries (i.e., “bridging” social capital), it is more likely to find positive changes in interfaith attitudes.
Fundamentalist religious orientations (proposition 5) imply strong leanings towards religious identification and solid belief systems and, as such, they can diminish reconciliation efforts. Ethnic identification (proposition 6) is assumed to delimit the effect of reconciliation, not least because strong ethnic cleavages are likely to reinforce conflict-accelerating mindsets and “us against them” mentalities.
The QCA truth table, sorted by number of cases, shows which combinations are most frequent in respect to associated cases. Table 9.1 summarizes the results. Notably, the first four combinations all include “education,” “social” and “participation” and are associated with the positive outcome of attitude improvement towards members of the other religious group. To visualize salient condition combinations in a more discernable and visually appealing way, Figure 9.1 presents a Venn diagram based on the truth table results outlined above.
The Venn diagram makes it possible to visualize which of the six conditions are strongly linked to positive outcomes (i.e., improved respondent attitudes towards other religious groups). At high inclusion5 levels of 0.8, our data indicates the trends outlined in Figure 9.1. Each of the six overlapping “oval shapes” represents one condition. The elevated (and slightly shaded) oval shape, for instance, encompasses all observations that fulfill the condition “participation.” Dark gray shadings imply inclusion levels of 0.8 or more. This indicates that at least 80 percent of all observations in a given set of conditions (i.e., a specific truth table row) confirm the expected positive outcome: an improved attitude towards the other religious group. Light gray shadings indicate that inclusion levels (share of confirming observations) are below 0.8 and hence suggest a lower “goodness of fit.” White shadings signify that there are no observations for this particular combination. The numbers in each of these shaded fields indicate the quantity of cases that conform with the respective combination of conditions.
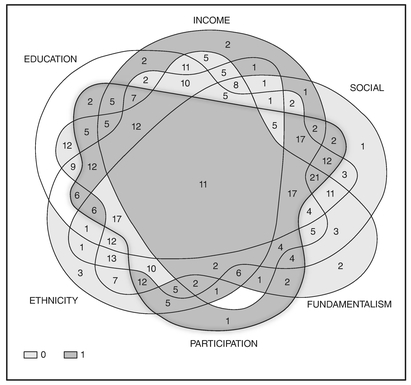
Figure 9.1 QCA Venn diagram (outcome: positive attitude change), all observations
Overall, the Venn diagram already provides a strong indication as to what condition combinations are closely associated with observable attitude improvements. Certainly, participation in church-based activities appears to be highly relevant for positive attitude change in a large number of cases. This is evident in the dark gray shading of the elevated oval shape for participation (see Figure 9.1). In contrast, the conditions ethnic identification (“ethnicity”), social capital (“social”), and fundamentalist religious orientations (“fundamentalism”) appear to be associated with lower rates of inclusion. The larger share of light gray shadings in the three respective oval shapes associated with these conditions implies a weaker association with overall attitude improvements.
The outlined results can be further elaborated on and specified by applying a set-theoretic reduction process. By applying an “Enhanced Quine McCluskey Algorithm” (EQMCC), which is available in software packages such as R, it is possible to reduce all the potential combinations of conditions (outlined in the truth table above; see Table 9.1) to a smaller number of highly relevant combinations. The results of this algorithmic reduction are displayed in Table 9.2.
The output in Table 9.2, which is based on computer simulations with minimum inclusion levels of 0.75 and minimum PRI levels6 of 0.50, highlights a number of interesting results:
The first two resulting terms feature the presence of “education” and “income” as prominent conditions, accompanied by the respective absence of the “fundamentalism” and “ethnicity” factors.7 The two described factor combinations show the highest Inclusion and PRI scores and, thus, indicate a relatively high effect on attitude improvements. These two results support four of our propositions (nos. 2, 3, 5, and 6). In other words, they indicate that community members with high educational attainment and income levels, as well as low ethnic or fundamentalist religious orientations, are likely
Table 9.2 QCA results for the outcome “attitude improvement”
| Inclusion | PRI | |
|---|---|---|
| (1) EDUCATION*INCOME*~FUNDAMENTALISM | 0.86 | 0.60 |
| (2) EDUCATION*INCOME*~ETHNICITY | 0.86 | 0.63 |
| (3) EDUCATION*SOCIAL*~FUNDAMENTALISM | 0.85 | 0.58 |
| (4) SOCIAL*~FUNDAMENTALISM*~ETHNICITY | 0.84 | 0.57 |
| (5) INCOME*FUNDAMENTALISM*~ETHNICITY | 0.83 | 0.54 |
| (6) EDUCATION*PARTICIPATION | 0.75 | 0.54 |
candidates for attitude changes in the direction of tolerance and reconciliation. This finding is corroborated by the case of Wayame (see chapter 6), a village with a high share of well-educated middle class families (Panggabean 2004: 429). Wayame was the only location in Ambon City that was able to maintain interreligious peace during the entire conflict (Al Qurtuby 2016: 109).
The next combinations – education*social*non-fundamentalism and social*non-fundamentalism*non-ethnicity – serve to highlight the positive effect of social capital. This positive effect is pronounced both in the presence of high education and low fundamentalist effects (which may reinforce a “bridging” rather than a “bonding” type of social capital); and in the combined absence of strong fundamentalist religious and ethnic orientations (which, again, may foster a bridging or cross-cutting character of social networks). These results lend support to the fourth proposition, namely that well-interconnected individuals with social relationships transcending religious or ethnic divides are likely to show attitude improvements.
The fifth result – income*fundamentalism*non-ethnicity – suggests that uncompromising or fundamentalist religious orientations can in some cases exert a positive influence on attitudes. The outlined combination indicates that well-to-do residents with low ethnic orientations and high levels of religious piety or zeal can show reconciliatory attitudes. Our interview data suggests that this is particularly likely in cases where fundamentalist religious orientations are inspired by values of forgiveness and compassion.
Consistent with the truth table above (see Table 9.1), the sixth result highlights the positive effect of participation in church-based activities. According to the calculations, project participation is particularly influential once it coincides with high levels of education. With Inclusion/PRI rates of 0.75 and 0.54 respectively, these results evince a high level of consistency. They also tally well with patterns in the Venn diagram (Figure 9.1), which indicate high consistency levels (inclusion values of 0.80 or above; dark gray shading) in the areas where “participation” and “education” coincide.8 Overall, this finding also serves as a reminder that church-based projects, which aim at fostering reconciliation and peaceful coexistence, may be particularly successful if accompanied by rising education standards.
One way to add further robustness to QCA findings is to estimate consistent factor combinations for the absence of a specific outcome as well. The literature on advanced QCA analysis recommends as a standard of good analytical practice the estimation of “non-outcomes” in a separate analysis (Schneider & Wagemann 2010: 12f). In line with this recommendation, the
Table 9.3 QCA results for non-outcome “attitude improvement”
| Inclusion | PRI | |
|---|---|---|
| (1) ~EDUCATION*ETHNICITY | 0.89 | 0.74 |
| (2) ~EDUCATION*INCOME*~SOCIAL*FUNDAMENTALISM | 0.87 | 0.57 |
| (3) PARTICIPATION*ETHNICITY | 0.80 | 0.59 |
| (4) SOCIAL*~PARTICIPATION | 0.78 | 0.60 |
| (5) INCOME*~PARTICIPATION | 0.75 | 0.55 |
| (6) FUNDAMENTALISM*~PARTICIPATION | 0.75 | 0.61 |
following output (Table 9.3) was generated to examine which combinations are associated with an absence of attitude improvements.
As outlined in Table 9.3, the combination non-education*ethnicity is consistently associated with the non-outcome. The concurrence of low education and strong ethnic identification hence appears to coincide with no attitude improvements towards the other religious group. The high Inclusion and PRI values signal a high degree of certainty regarding this effect.
The second most consistent combination is the combination of non-education*income*non-social*fundamentalism. Low levels of education and social capital, combined with high levels of income and fundamentalist religious orientations, seem to be a recipe for low attitude improvements. This lends additional support to the above-described education and social capital propositions, but it also indicates that higher income levels can be of no effect to reconciliatory attitudes when they coincide with less education and strong fundamentalist religious orientations.
The last three results in Table 9.3 provide additional insights into the effects of participation in church-based projects. It is evident that an absence of project participation goes hand-in-hand with an absence of desirable attitudinal change which, inversely, highlights that participation in church-based activities has a positive effect. This does not seem to be the case, however, if project participation is combined with high levels of ethnic orientation (third result). Here the negative effect of “ethnicity” exceeds the repeated positive effect of “participation.”
The QCA analysis reveals a rich picture of interactions between selected conditions. We can observe that combinations with the factors “education,” “income,” and “participation” are consistently associated with a positive outcome. Thus, there is a strong indication that respondents with higher levels of schooling, economic security, and project participation are most likely to report attitudinal improvements towards the other religious group over time.
Strong ethnic orientations feature as the predominant negative factor in attitude change. Mental divides along ethnic divides lead to less tolerance. Estimates for the non-outcome (i.e., the absence of attitude improvements) show that the combination of strong ethnic identification and low educational levels is consistently associated with low improvement.
Networks of communal solidarity and trust, commonly associated with the notion of “social capital,” have stronger positive effects once they are “bridging” intra-group divides (i.e., coincide with lower ethnic or fundamentalist religious orientations).
Overall, the QCA analysis provides additional support for the finding that participation in church-based activities has positive effects on participants’ attitudes towards reconciliation. Equally importantly, it offers valuable insights into contextual factors that surround church projects. These suggest that higher levels of education, personal prosperity, and (in a more contingent way) social capital are accelerators of observable attitude improvements, whereas ethnic identification and (to some extent) fundamentalist religious orientations are likely to be detrimental to reconciliatory efforts.
1 The authors gratefully acknowledge the substantial technical contributions of Mr Felix Ettensperger (University of Freiburg) to this chapter.
2 The questions that establish this comparison are Q46 (“What image did you have of the individuals from other religious groups before you took part in the reconciliation project”) and Q48 (“What image did you have of the individuals from other religious groups after you took part in the reconciliation project”).
3 These indicators were drawn from the survey questions Q8h, Q14g, and Q13c.
4 For a detailed discussion of the QCA technique and its theoretical foundations see, for instance, Ragin (1987, 2000, 2006) and Schneider and Wagemann (2006, 2007, 2010).
5 The level of inclusion (Thiem & Dusa 2013) or consistency (Ragin 1987) reflects the percentage of observations in each set-theoretic combination of conditions (i.e., in each truth table row) that conforms with the outcome in question. This percentage value represents a goodness of fit: it “indicates how closely a perfect subset relation is approximated” in the given data (Ragin 2008: 44). Inclusion levels of 0.75 or 0.80 are widely recommended in the QCA literature as benchmarks for a good set-theoretic fit (Rihoux & Ragin 2009; Schneider & Wagemann 2012).
6 The PRI (proportional reduction of inconsistency) value is an additional measure addressing the issue of rows that might be consistent with both the outcome and its negation. See Schneider & Wagemann (2012: 242–244). The lower the PRI value, the higher the outlined risk of inconsistency. In our analysis, we set the minimum PRI at 0.50.
7 A brief note on notations: the operator “ ~ ” signifies the absence/negation of a condition; the operator “ * ” signifies the combination of conditions.
8 Interestingly, the few inconsistencies (signified by light grey shadings) are fields that entail the conditions “ethnicity” and “fundamentalism” as codetermining factors; a result that highlights the possible detrimental influence of these latter two conditions.
Al Qurtuby, Sumanto (2016): Religious Violence and Conciliation in Indonesia: Christians and Muslims in the Moluccas, London & New York: Routledge.
Panggabean, Samsu Rizal (2004): “Maluku: The Challenge of Peace,” In: Annelies Heijmans, Nicola Simmonds & Hans van de Veen (eds.), Searching for Peace in Asia Pacific: An Overview of Conflict Prevention and Peacebuilding Activities, Boulder & London: Lynne Rienner, pp. 416–437.
Ragin, Charles C. (1987): The Comparative Method: Moving Beyond Qualitative and Quantitative Strategies, Berkeley: University of California Press.
Ragin, Charles C. (2000): Fuzzy-Set Social Science, Chicago, IL: University of Chicago Press.
Ragin, Charles C. (2006): “Set Relations in Social Research: Evaluating Their Consistency and Coverage,” Political Analysis 14(3): 291–310.
Ragin, Charles C. (2008): Redesigning Social Inquiry: Fuzzy Sets and Beyond, Chicago, IL: Chicago University Press.
Rihoux, Benoit & Ragin, Carles C. (eds.) (2009): Configurational Comparative Methods: Qualitative Comparative Analysis (QCA) and Related Techniques, Los Angeles: Sage Publications.
Schneider, Carsten Q. & Wagemann, Claudius (2006): “Reducing Complexity in Qualitative Comparative Analysis (QCA): Remote and Proximate Factors and the Consolidation of Democracy,” European Journal of Political Research 45: 751–786.
Schneider, Carsten Q. & Wagemann, Claudius (2007): Qualitative Comparative Analysis (QCA) und Fuzzy Sets – Ein Lehrbuch für Anwender und jene, die es werden wollen, Opladen: Barbara Budrich.
Schneider, Carsten Q. & Wagemann, Claudius (2010): “Standards of Good Practice in Qualitative Comparative Analysis (QCA) and Fuzzy-Sets,” Comparative Sociology 9: 1–22.
Schneider, Carsten Q. & Wagemann, Claudius (2012): Set-theoretic Methods for the Social Sciences: A guide to Qualitative Comparative Analysis, New York: Cambridge University Press.
Thiem, Alrik & Dusa, Adrian (2013): “QCA: A Package for Qualitative Comparative Analysis,” The R Journal 5(1).
