Chapter 5
Drag
Drag is the component of the aerodynamic force that is parallel to the relative wind and retards the forward motion of the aircraft. At subsonic speeds, there are two kinds of drag we will discuss: induced drag and parasite drag. A third kind of drag, compressibility drag, occurs at high speeds and will be discussed in Chapter 16.
Drag is generated by the interaction of a solid body with a fluid (liquid or gas), and for drag to be generated, the solid body must be in contact with the liquid or gas. Drag is generated by the difference in velocity between the solid object (wing) and the fluid (air). There must be motion between the object and the fluid, so if no motion exists then no drag can exists. As we saw in Chapter 3 it makes no difference whether the object moves through a static fluid or whether the fluid moves past a static solid object. Since drag is a force it therefore becomes a vector quantity and possesses both a magnitude and a direction. We have seen that drag acts in a direction that is opposite to the motion of the aircraft, the same way that lift acts perpendicular to the motion.
DRAG EQUATION
The basic drag equation is similar to the basic lift equation (Eq. 4.2):
Rewriting gives
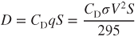
The coefficient of drag, CD, is the ratio of the drag pressure to the dynamic pressure. Values of CD have been obtained experimentally for all airfoil sections and can be found in other publications. Figure 5.1 shows typical curve for CD vs. AOA for the same airfoil.
Figure 5.1 CL vs. AOA and CD vs. AOA.
Drag depends on multiple factors, including the density and viscosity of the air, as well as the velocity, size, and shape of the body. Determining the value of the drag coefficient is more difficult than determining the lift coefficient because there are several sources of drag. The drag coefficient includes the various forms of parasite and induced drag components. Most drag coefficients are determined experimentally using wind tunnels and computational fluid dynamics (CFD).
INDUCED DRAG
Induced drag, Di, is the least understood type of drag, but it is the most important, especially in the critical low‐speed region of flight. It is called the drag due to lift because it occurs only when lift is developed. Induced drag occurs because the distribution of lift is not uniform across the wing as it varies from the wing root to the wing tip. As discussed in earlier chapters, there is a pressure difference between the upper and lower surfaces of the wing. Vortices are formed at the wing tips, which produce a circular flow that is very strong near the tips of the wing and decreases in intensity closer to the wing root. The magnitude of induced drag depends on the amount of lift being generated by the wing, the distribution of lift across the span, and the configuration of high lift devices and landing gear. In general, an aircraft is producing a high magnitude of induced drag when it is heavy, clean, and slow.
Up to this point we have been discussing airfoils, not wings. We must now consider the planform of the wing, or the shape of the wing as viewed from above. In describing the planform of a wing, several terms must be explained. These are shown in Fig. 5.2.
- The wing area, S, is the plan surface area, including the area covered by the fuselage.
- The wing span, b, is the distance from tip to tip.
- The average chord, cav, is the geometric average chord:

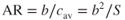
- The aspect ratio, AR, is the span divided by the average chord:
- The root chord, cr, is the chord measured at the aircraft centerline. The tip chord ct, is the chord measured at the wingtip.
- The taper ratio, λ (lambda), is the ratio of ct to cr:

- The sweep angle, Λ (uppercase lambda), is the angle between the line of 25% chord points and a perpendicular to the root chord.
- The mean aerodynamic chord, MAC, is the chord drawn through the centroid (center of area) of the half‐span area. The MAC and the cav are not the same. If the actual wing was replaced by a rectangular wing having the same span and a chord equal to the MAC, the pitching moments of each would be identical.
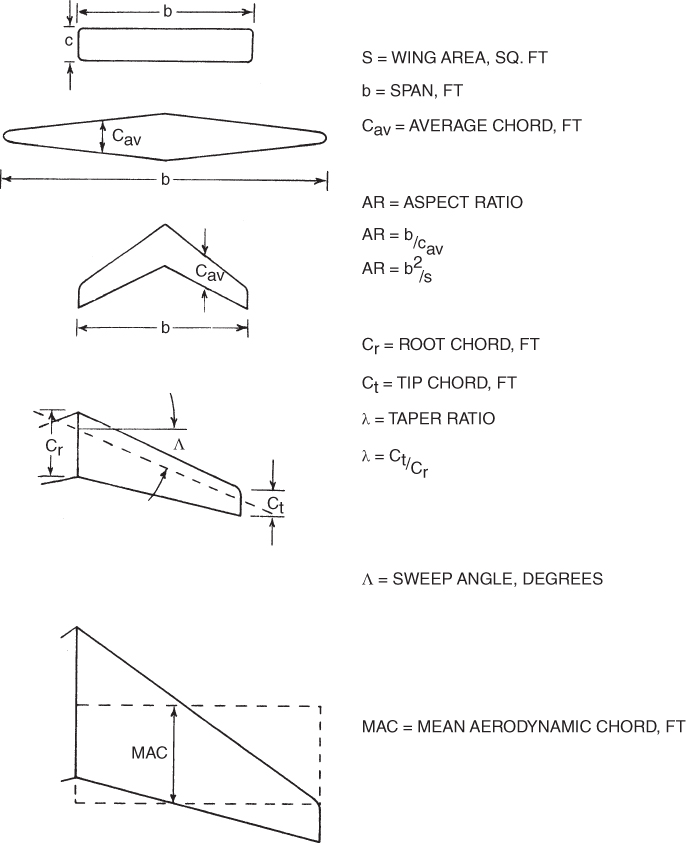
Figure 5.2 Wing planform terminology.
Wingtip Vortices
Wingtip vortices are circular patterns of rotating air trailing behind a wing as it moves through the air and generates lift. Each wingtip vortex trails from the tip of the wing and eventually descends and dissipates. Understanding the effect of these vortices on other aircraft that may be flying in the same area leads to the core concept of wake turbulence avoidance and will be discussed in a future chapter.
A wingtip vortex is formed when higher pressure air below a wing flows around the wingtips into the low‐pressure region on top of the wing that is developing lift. The vortices are strongest at the tips and become weaker toward the centerline of the aircraft (Fig. 5.3). Wingtip vortices are associated with induced drag as a consequence of downwash, and are a fundamental consequence of lift generation. When a wing generates lift, the air on the top surface has a lower pressure relative to the pressure on the bottom surface so pressure gradient force moves the air below the wing and out around the tip to the top of the wing in a circular fashion.
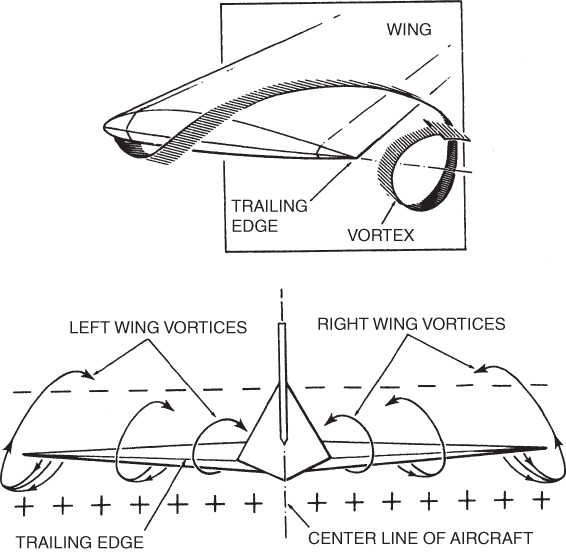
Figure 5.3 Wingtip vortices.
If viewed from the tail of the airplane looking forward in the direction of flight, there is one wingtip vortex trailing from the left wing circulating clockwise, and another one trailing from the right wing circulating anti‐clockwise.
Consider an aircraft with an infinitely long wing. This infinite wing has no wingtips and so it has no wingtip vortices. The absence of wingtip vortices means that the upwash in front of the wing and the downwash behind the wing cancel each other, so there is no net downwash behind the wing (Fig. 5.4). The relative wind (RW) ahead of this wing is horizontal, and the RW behind the wing is also horizontal. The RW at the aerodynamic center (AC) is the average of these two and also must be horizontal. Lift is 90° to the RW, so it acts vertically. The vertical components of the local RW for an infinite wing are plotted in Fig. 5.5. Note that the RW at the AC has no upward or downward velocity and is horizontal.
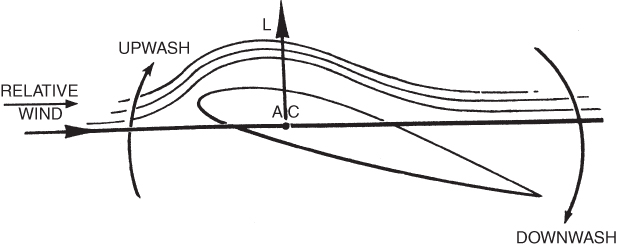
Figure 5.4 Airflow about an infinite wing.
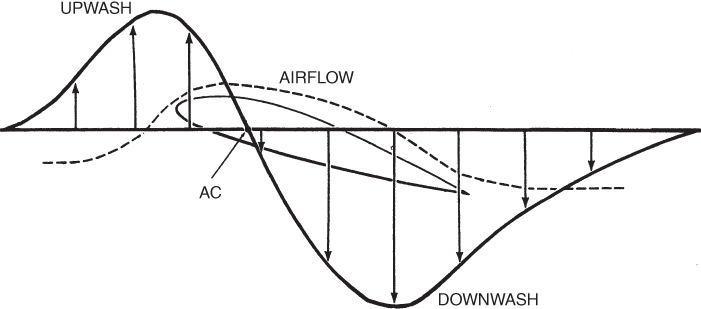
Figure 5.5 Vertical velocity vectors of an infinite wing.
A wing with wingtips is called a finite wing. A finite wing that is developing lift will have tip vortices, as described previously. These vortices force air down behind the wing. The vertical components of the local RW for a finite wing that is producing lift are shown in Fig. 5.6.
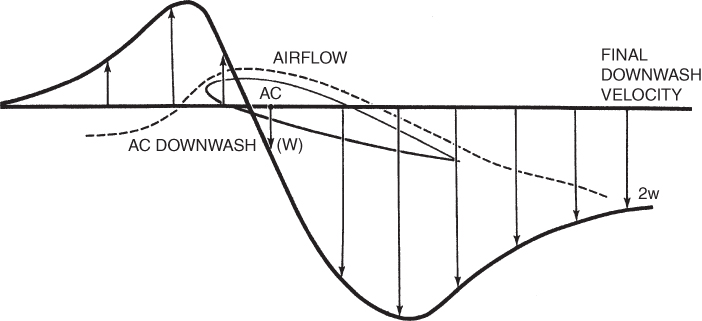
Figure 5.6 Vertical velocity vectors of a finite wing.
The local RW is the vector sum of the free stream RW and the vertical velocity vectors (Fig. 5.6). The RW far ahead of the aircraft is not disturbed by upwash, so for an aircraft flying horizontally it is also horizontal. The local RW behind the wing is depressed by the final downwash velocity. 2w. The angle that the RW leaving the wing makes with the free stream RW is called the downwash angle. It can be seen in Fig. 5.7.
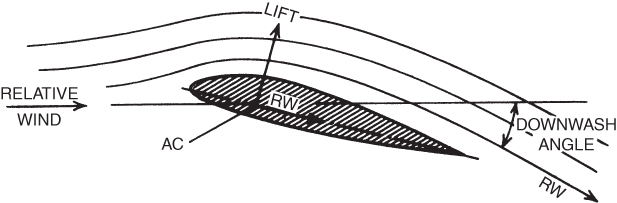
Figure 5.7 Airflow about a finite wing.
The local RW at the AC is the average of the approaching and departing relative winds. The downwash angle of the local RW at the AC is, therefore, one‐half of the trailing‐edge downwash angle. The lift vector at the AC, which is perpendicular to the local RW, is tilted back by the same angle. The angle that the lift vector is tilted back is called the induced angle of attack, αi.
The finite wing is operating at a lower AOA than the infinite wing due to the depressed RW at the AC. Thus, if the finite wing is to produce the same lift coefficient as the infinite wing, the AOA, with respect to the free stream RW, must be increased by αi. The AOA of the infinite wing is α0; the AOA of the finite wing is α:

This is shown vectorially in Fig. 5.8. The vertical vector, effective lift, is the lift vector of the infinite wing, and the tilted vector, total lift, is the lift vector of the finite wing. The component of the tilted lift vector that is parallel to the remote RW is the induced drag Di. Induced drag is influenced by lift coefficient and aspect ratio. It increases directly as the square of CL and inversely as the aspect ratio.
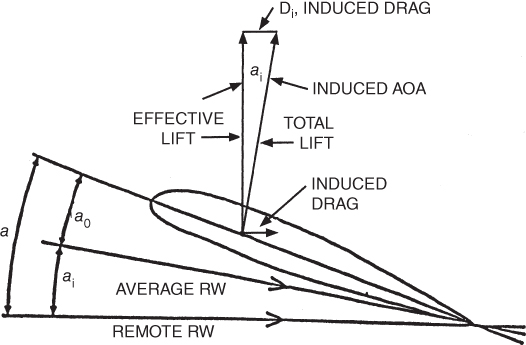
Figure 5.8 Relative wind and force vectors on a finite wing.
The most critical condition, where induced drag is greatest, is during low‐speed (high‐CL) flight with a low aspect ratio (short‐wingspan) aircraft. Equation 5.3 shows that induced drag varies inversely with the velocity squared (Fig. 5.9):

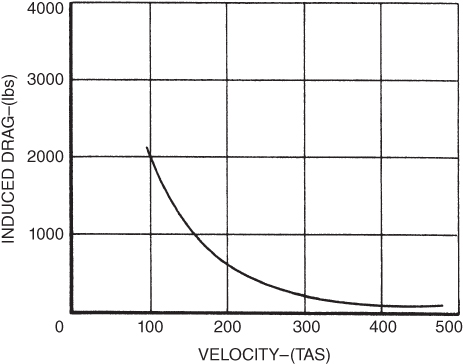
Figure 5.9 Induced drag versus velocity.
Induced Drag Summary
- Wingtip vortices are formed by higher pressure air beneath a wing moving into the lower pressure air above the wing.
- Wingtip vortices cause the airflow behind the wing to be pushed downward; this is called downwash.
- Downwash causes the RW behind the wing to be deflected downward at a downwash angle.
- The RW at the AC is influenced by the downwash, and it is deflected downward by one‐half of the downwash angle.
- The lift vector is tilted backward by the induced angle of attack, αi, which is numerically equal to one‐half of the downwash angle.
- The rearward component of the tilted lift vector is induced drag.
GROUND EFFECT
When an aircraft is approaching or departing the earth's surface, a phenomenon happens that changes the flying characteristics discussed thus far. Three effects can occur when an airplane is flown close to the runway or to a water surface; collectively they are called ground effect and they are noticeable when the aircraft is about one wingspan or less above the surface (Fig. 5.10). The closer the aircraft is to the surface, the greater the effects will be. As the ground interferes with the airflow around the aircraft, changes in pitch along with variations in throttle may be required. Many pilots have miscalculated the effects of ground effect, and have found themselves floating off the end of the runway, or sinking back toward the runway with terrain quickly approaching.
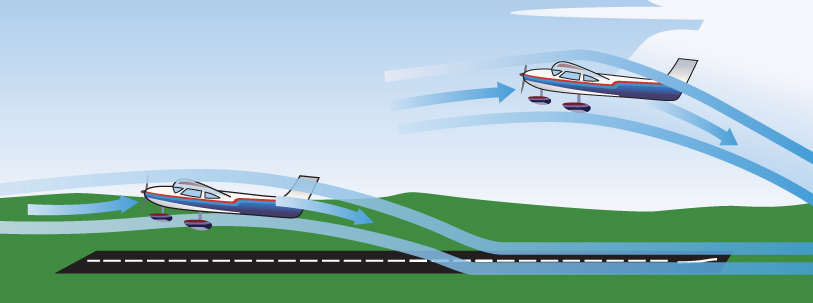
Figure 5.10 Airflow in ground effect.
U.S. Department of Transportation Federal Aviation Administration, Pilot's Handbook of Aeronautical Knowledge, 2008
Airflow Alteration around the Wing
The first and most noticeable effect is caused by the surface physically reducing the downwash, which reduces both the upwash and the wingtip vortices. Without so much downwash, the local relative wind at the AC is closer to the remote RW. The lift vector is closer to the infinite wing lift and the induced drag is reduced. The reduction in induced drag coefficient as a function of height, h, above the runway to the wingspan, b. Of course, since wingspan remains the same, this means when the wing's height above the runway decreases, the reduction in CD increases. Pilots transitioning from an aircraft with a low aspect ratio to an aircraft with a high aspect ratio may also experience significant improvement in aircraft performance when in ground effect, so careful monitoring of airspeed and pitch attitude is needed when entering ground effect upon landing.
Low‐winged aircraft are affected more by ground effect than high‐winged aircraft. This reduction of drag is clearly seen on light aircraft in their tendency to “float” during landings. To reduce this floating tendency, the aircraft approach should be made with some throttle on, instead of at idle, then the throttle should be closed as the aircraft is flared (held several feet above the runway until in a nose high attitude until at a safe speed for tricycle gear aircraft to touchdown with the main wheels first). The reduction of drag is compensated for by a reduction in thrust, and there is little or no floating action. Pilots who fail to compensate for the reduction in drag by reducing thrust greatly increase their landing distance, which may lead to additional undesirable consequences such as porpoising and ballooning, or possibly running out of runway.
Ground effect changes the CL vs. AOA curves and the thrust‐required curves (Fig. 5.11). According to the CL curve, the wing requires a lower AOA for the same CL when in ground effect versus outside ground effect. If a pilot maintains the same AOA in ground effect as they did before entering ground effect, a significant floating distance could occur. Since induced drag is the predominate drag (versus parasite drag) at slower speeds and higher angles of attack, reducing the induced drag at this point has a significant effect on total drag and will require a respectively similar decrease in thrust. The reduction of thrust required also results in a reduction in fuel flow. Though usually not a significant factor for the common training aircraft, this effect can be used in emergency flying over water or flat ground if the fuel available is critical. A word of caution to pilots of turbine engine aircraft: Fuel consumption is high for these aircraft at low altitude, so the benefits of ground effect may be nullified by poor fuel consumption.
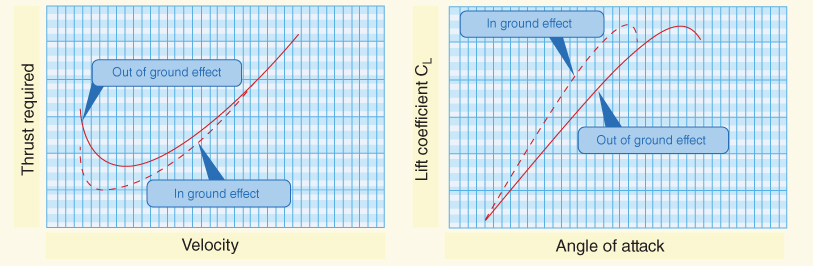
Figure 5.11 Tr and CL curves in ground effect.
U.S. Department of Transportation Federal Aviation Administration, Pilot's Handbook of Aeronautical Knowledge, 2008
Pitching Moments
The other effects from flying in ground effect are less well known but influence many aircraft. The second effect concerns pitching moments that develop when entering or departing from ground effect. A nose‐up pitching moment is required to rotate an aircraft for takeoff or to flare the aircraft during landing. This requires a download on the tail. To obtain this pitching moment the pilot applies back stick so that the horizontal tail is effectively operating at a negative AOA. The downwash from the wing accentuates this negative AOA.
When the aircraft enters ground effect, on landing, the downwash is decreased, the negative AOA is reduced, the downward lift on the tail is reduced, and the aircraft experiences a nose‐down pitching moment. The pilot should be aware of this pitching moment and prepare accordingly by maintaining back pressure on the stick. Hightailed aircraft will not experience this pitching moment if the tail is above the wing downwash and is not influenced by it.
During takeoff, as the aircraft leaves ground effect, the opposite pitching moment occurs. Here, the increased downwash hits the horizontal tail and causes a download on it and a nose‐up pitching moment results. Unless corrective action is taken, this will cause a sharp increase in drag that, when coupled with the increase in induced drag that results when an aircraft leaves ground effect, may prevent a successful takeoff. In situations involving a takeoff with a high density altitude, or in an overweight condition, the aircraft may become airborne within ground effect and then not be able to climb out of ground effect. As the nose pitches up when leaving ground effect the situation is exacerbated and the aircraft may stall.
Pitot‐Static Influence
The third effect of flying in ground effect occurs to aircraft that have static airspeed ports located below the wings. There is a small, but measurable, increase in static pressure below the wings as an aircraft enters ground effect. This creates a false reading from the airspeed indicator. It will read lower than the actual airspeed and altitude on entering ground effect. This goes unnoticed during takeoffs and landings as the pilot is usually monitoring the runway, but on long flights over water, pilots trying to take advantage of ground effect may be upset to see the airspeed decrease as the aircraft approaches the water.
Ground Effect Summary
Ground effect must always be considered when landing or taking off. The consequences of a high density altitude, overweight aircraft, CG out of limits, or poor pilot technique when combined with the effects of ground effect could lead to an unrecoverable situation. Figure 5.12 shows a summary of the effects of ground effect.
On entering ground effect:
- Induced drag is decreased, reduction in thrust is required.
- Nose‐down pitching moments occur.
- Decrease in AOA is required to maintain same CL.
- The airspeed indicator reads low.
On leaving ground effect:
- Induced drag is increased, additional thrust required.
- Nose‐up pitching moments occur, decrease in stability.
- Increase in AOA is required to maintain the same CL.
- The airspeed indicator will read higher (correctly).
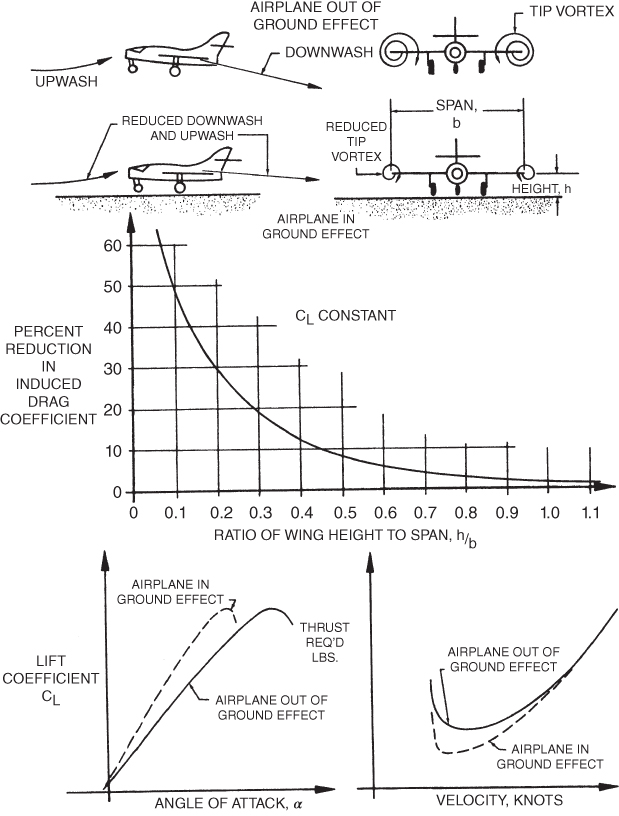
Figure 5.12 Ground effect.
LAMINAR FLOW AIRFOILS
In the late 1930s a radically new design of the airfoil was discovered, the laminar flow airfoil. In Fig. 5.13 the  curves are compared for two symmetrical airfoils, an NACA (National Advisory Committee for Aeronautics) “4‐digit series” and an NACA “6‐series” (laminar flow). The most obvious difference in these curves is the “drag bucket” that exists for the laminar flow airfoil. As long as this airfoil operates at low CL (low AOA), the airflow remains laminar much farther back from the leading edge than on the conventional airfoil. Laminar flow has much less skin friction drag than turbulent flow, and thus less CD. At higher CL values, the advantage of the laminar airfoil disappears. The sharper leading edge of the laminar airfoil causes early separation and a resulting increase in the drag coefficient.
The laminar flow airfoil was used on the B‐24 Liberator bombers in World War II. It was not an overwhelming success for several reasons:
- The airplanes were operating from muddy dirt airfields. Mud thrown on the leading edges of the wings by the prop wash of other planes disrupted the laminar flow.
- Shrapnel damage had a similar effect.
- Often enemy gunfire caused the loss of one or two engines. This required that the airplane fly at low airspeeds and high angles of attack. Thus, flight in the “drag bucket” was impossible.
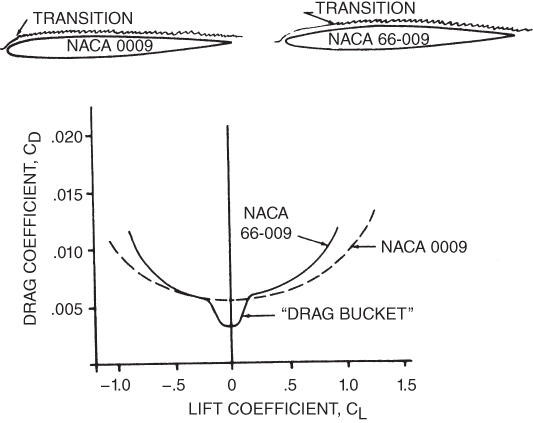
Figure 5.13 Comparison of drag characteristics of conventional and laminar flow airfoils.
As for civilian airplanes, the Piper Aircraft Company introduced the laminar flow wing with its line of PA‐28 “Cherokee” aircraft in the 1960s. In the Owner's Handbook for the Cherokee, the following paragraph told of the advantage of the laminar flow wing:
The wing airfoil section is a laminar flow type, NACA 652‐415 with the maximum thickness about 40% aft of the leading edge. This permits the main spar carry through structure to be located under the rear seat providing unobstructed cabin floor space ahead of the rear seat.
No mention was made of flying characteristics or aircraft performance for the laminar flow wing. In the section on stalls, the owner's manual relates how stalls are “conventional.” Cherokee pilots describe how stalls are docile. The aircraft does not exhibit a clean “break,” but rather “mushes” and will continue do so until back pressure is released, reducing AOA.
PARASITE DRAG
Parasite drag, Dp, is easily understood, but difficult to measure as it is the drag that is not associated with the production of lift. In flight we have seen that induced drag results from the need to maintain lift, and is greater at lower speeds when a high angle of attack is required to maintain level flight. As speed increases, the induced drag decreases, but parasite drag will increase because the “solid body” is moving through the “fluid” with greater force and thus experiences the force of drag in a greater capacity. There are five types of parasite drag we will discuss here, and the total parasite drag is not a simple addition of each component.
Skin Friction Drag
Skin friction drag is caused by the viscous friction within the boundary layer. Regardless of how smooth the surface of the aircraft appears to be, there are small imperfections within any aircraft skin that promote aerodynamic resistance. The total area of the aircraft skin that is exposed to the airstream will be affected by this type of drag. Skin smoothness also greatly affects this drag, hence the proliferation of composite structures and streamlining technology throughout aviation. As the air within the boundary layer moves over the aircraft skin, air molecules are slowed down by imperfections and structural components, increasing the drag on the aircraft. These influences may also affect the boundary layer's ability to stay attached to an airfoil and result in early separation and stall. Flush‐head rivets, waxed and polished surfaces, and removal of aluminum oxide help reduce skin friction drag.
Form Drag
Form drag is influenced by the shape or form of the aircraft (Fig. 5.14). Antennas located around the aircraft, engine nacelles, gear, and other items comprising the total shape of the aircraft make up the objects that influence the amount of form drag present. Similar to water moving around rocks in a stream, as the moving air separates and rejoins at some point after an object, a force is created that opposes thrust and must be overcome. The overall shape of the aircraft, the number of objects exposed to the air, and how aerodynamically shaped the components are designed all influence the magnitude of the form drag. Streamlining the fuselage, engine nacelles, pods, and external stores helps reduce form drag though it will never be completely eliminated.
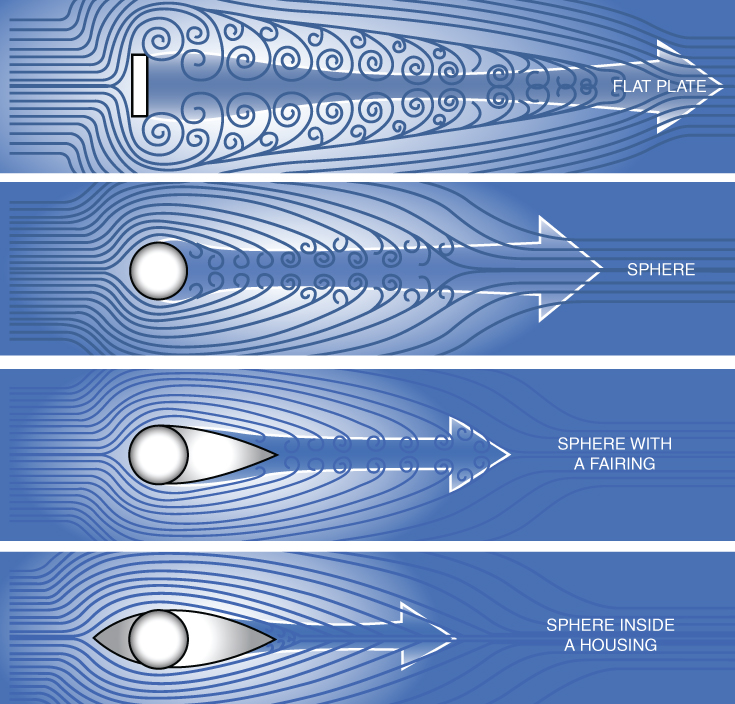
Figure 5.14 Form drag.
U.S. Department of Transportation Federal Aviation Administration, Pilot's Handbook of Aeronautical Knowledge, 2008
Interference Drag
Interference drag is caused by the interference of boundary layers from different parts of the airplane, as with the intersection of the wing and the fuselage at the wing root (Fig. 5.15). If the drag of two component parts of an airplane is measured individually and then the parts are assembled, the drag of the assembly will be greater than the drag of the parts because both parts when attached create their own interference drag. The impact of interference drag is most pronounced when two objects are joined at perpendicular angles, hence the desire to streamline the surface of two adjoining structures. Smooth fairings at surface junctions, greater use of composite structures to “soften” the angle where two surfaces meet, and computer designed aircraft components all help reduce this type of drag.
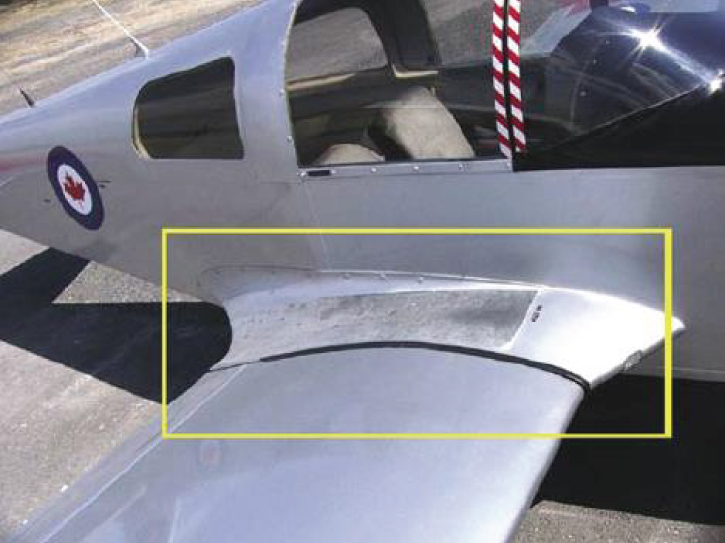
Figure 5.15 Interference drag at the wing root.
U.S. Department of Transportation Federal Aviation Administration, Pilot's Handbook of Aeronautical Knowledge, 2008
Leakage Drag
Leakage drag is caused by differential pressure inside and outside the aircraft. As we have discussed, air accelerating around the outside of the aircraft creates a lower relative pressure on the aircraft surface. Air inside the fuselage is at a higher pressure and desires to equalize with the pressure on the outside of the aircraft. Air flowing from a higher pressure inside the fuselage through a crack or door seal will create an airstream that impinges on the airflow in the boundary layer around the aircraft and creates drag. Door and window sills are sealed with masking tape before an air race to lessen this drag.
Profile Drag
Profile drag for our discussion is of particular interest to helicopter pilots, and is composed of skin friction drag and form drag. It is the drag of the moving rotors due to the frictional resistance of the blades passing through the air, and it develops anytime the rotors are in motion. This drag can exist even if the aircraft is not in motion or developing lift, but increases once the aircraft is in motion at higher speeds (Fig. 5.16).

Figure 5.16 Example total drag curve for a helicopter.
U.S. Department of Transportation Federal Aviation Administration, Helicopter Flying Handbook, 2012
Parasite Drag Calculations
Parasite drag is hard to measure, but there is a way of simplifying this measurement. Consider the basic drag formula (5.1) with subscript p added to indicate parasite.

At any AOA the value of  will be a constant and, of course, S is a constant. A new constant, called the equivalent parasite area, f, is now introduced.

Because  , is dimensionless, the dimensions of f are the same as S (ft2). The equivalent parasite area is often called the “barn door” area of the aircraft. This is not technically correct, but it may help you visualize the area as that seen by an observer of an approaching aircraft.
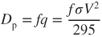
The value of f for an aircraft can be determined by placing a model in a wind tunnel and adjusting the AOA until zero lift is developed, then measuring the drag. With no lift, there is no induced drag, so all the drag will be parasite. Remember, parasite drag is all drag that is not associated with the production of lift. If the density ratio and tunnel velocity are known, then the equivalent parasite area can be found by

For low angles of attack, the value of f can be considered a constant, so
Parasite drag varies directly as the velocity squared:

Figure 5.17 shows a plot of parasite drag variation with airspeed.
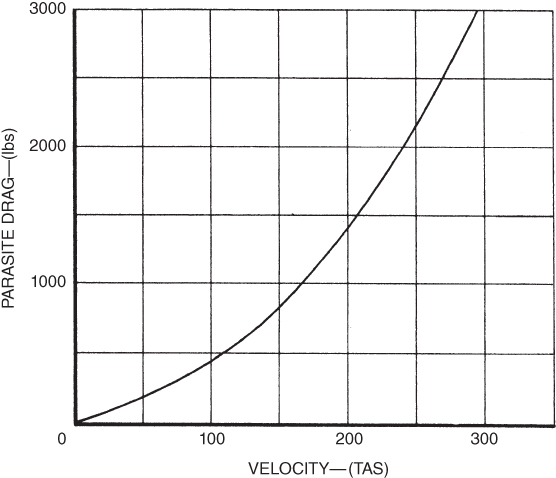
Figure 5.17 Parasite drag–airspeed curve.
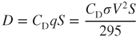
TOTAL DRAG
Total drag, DT, is the sum of the induced drag and the parasite drag:

As we mentioned earlier, the drag is the component of the aerodynamic force that is parallel to the free stream RW. It is made up of both the induced drag vector and the parasite drag vector (Fig. 5.18).
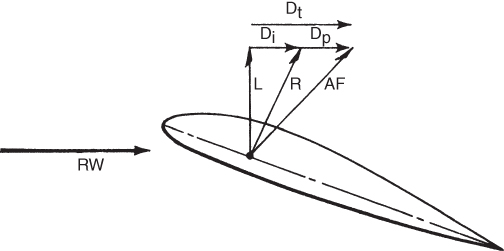
Figure 5.18 Drag vector diagram.
The total drag curve for an airplane with the induced drag curve in Fig. 5.9 and the parasite drag curve in Fig. 5.17 is shown in Fig. 5.19. Note that the minimum drag or ( )max point occurs where the induced drag and parasite drag curves intersect. Therefore, at this velocity,
  . An equation for calculating total drag can be derived by combining Eqs. 5.3 and 5.4.
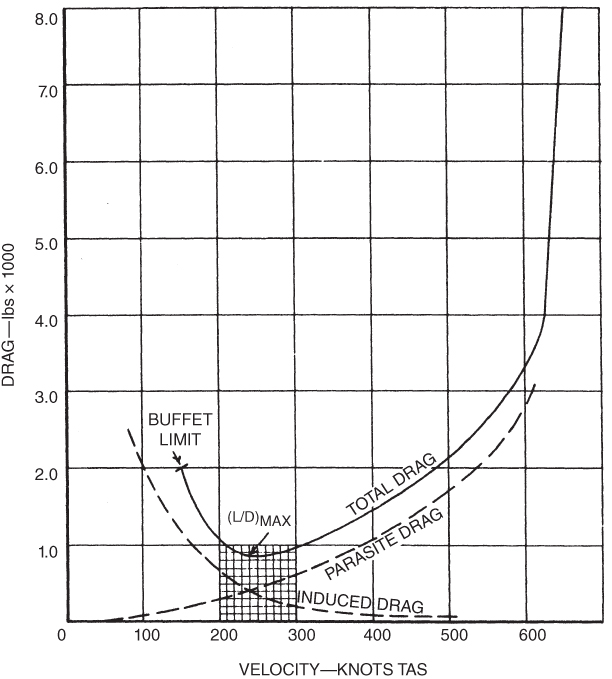
Figure 5.19 Total drag curve.
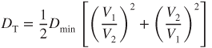
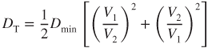
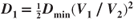
Let condition 1 be at  and condition 2 be any other point on the curve. Also remember that
 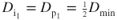 .
.
The limitations of this curve must be emphasized. In the low‐speed region, the high AOA required results in more “equivalent parasite area” than was calculated. The value of f is not constant. The value of parasite and total drag will be greater than the equation shows. In the high‐speed region, faster airplanes may encounter compressibility effects and resultant “wave drag.” This was not considered in Eq. 5.5. The total drag curves are not accurate at airspeeds below about 1.3Vs or above about 0.7 Mach.
LIFT TO DRAG RATIO
An aircraft's lift/drag ratio, L/D, is a measure of its efficiency. An aircraft with a high L/D is more efficient than one with a lower L/D, representing “high lift” to “low drag.” An aircraft with a more efficient L/D ratio can carry a heavier payload, for a longer time, over a longer distance. The L/D can be found by dividing the values of CL by those of CD at the same AOA. This can be seen if we divide Eq. 4.2 by Eq. 5.1:

All the factors cancel except L, D, and their coefficients. Typical L/D curves are shown in Fig. 5.20.
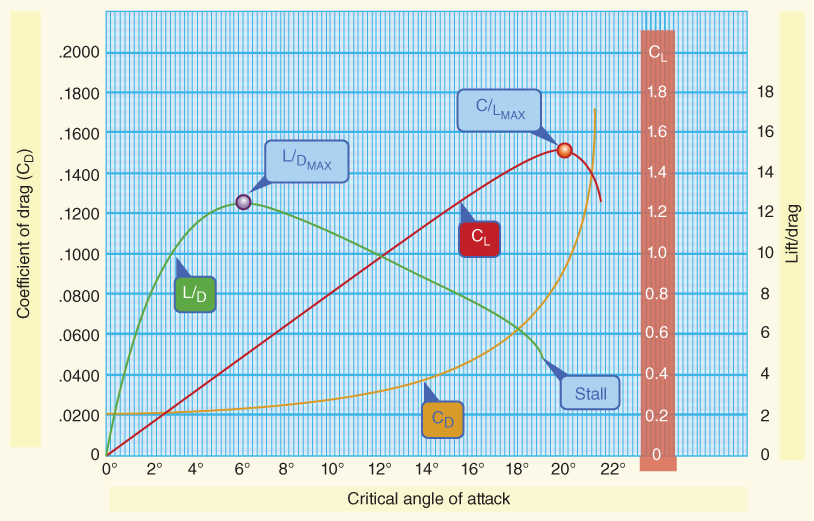
Figure 5.20 Typical lift‐to‐drag ratios.
U.S. Department of Transportation Federal Aviation Administration, Pilot's Handbook of Aeronautical Knowledge, 2008
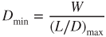
The highest point on the curve is important. It is called  and occurs at the most aerodynamic efficient AOA. Minimum drag occurs at
  . Under 1G flight, the lift of the aircraft equals the weight, so
  . If the value of W/D is a maximum, then drag must be a minimum. Minimum drag is then equal to the weight of the aircraft divided by the value of
  :
:
Several performance characteristics are present at  . For example, the best engine out glide ratio occurs here. Because lift is proportional to distance and drag is proportional to altitude, then L/D is proportional to glide ratio (distance/altitude). This means the numerical value of L/D equals the numerical value of the glide ratio.
Note that the value of (L/D)max and the angle of attack at which it occurs do not vary with aircraft weight or altitude. The airspeed for (L/D)max does vary with weight, as was shown in Eq. 4.3.
DRAG REDUCTION
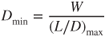
Most drag on modern turbofan airliners and other large jet aircraft is caused by skin friction drag and induced drag. These forms of drag are roughly 75% of the total drag and reducing them is a major factor in decreasing fuel consumption. In an earlier discussion of induced drag it was demonstrated that wingtip vortices cause much of the downwash and resultant backward tilting of the lift vector. Reducing the wing vortices has been a problem for some time. Earlier attempts to do this are shown in Fig. 5.21.
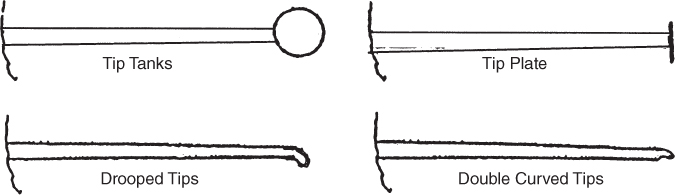
Figure 5.21 Wingtip vortex reduction methods.
Wingtip devices are usually intended to improve the efficiency of fixed‐wing aircraft though some types of older aircraft sacrificed the drag of these devices in order to increase fuel capacity. There are many types of drag‐reducing wingtip devices in use, and although they function in different manners, the intended effect is always to reduce the aircraft's induced drag thus improving thrust efficiency, thereby saving fuel. Wingtip devices can also improve aircraft handling characteristics and enhance safety. Such devices increase the effective aspect ratio of a wing without materially increasing the wingspan, though often a sacrifice of increased parasite drag is made along with higher manufacturing costs.
Winglets
Winglets were developed to solve the problem of the parasite drag caused by other types of vortex suppression needed to reduce induced drag. Of course, if total drag can be reduced then this savings can be translated into higher cruise speed or increased fuel savings. Without any such device the airflow around the tip is nearly circular. It flows outward toward the tip from beneath the wing, goes upward around the wingtip, and then back inward on the top surface. Although this rotation is reduced by placing the winglet in the path of the airflow, the winglets are usually placed some distance back from the leading edge. This is shown in the side view of Fig. 5.22.
Figure 5.22 Winglets.
Many modern aircraft utilize the benefits of winglets, essentially increasing the effect of increased aspect ratio without extending the actual length of the wing, a benefit when considering terminal gate space as well as the structural strength requirements required in longer wingspans. Older generation Airbus equipment can be seen with small upper and lower wingtip devices called a wingtip fence, while Boeing and newer‐generation Airbus aircraft use more of the conventional design. Many older aircraft have added structural modifications to retrofit aircraft with winglets due to the drag reduction and subsequent fuel savings. Of course, a balance must be calculated between the costs of retrofit and long‐term financial savings in fuel costs.
During the 1980s, several companies began research on blended winglets, which combine the benefits of a winglet without the interference drag and maintenance retrofit costs of a typical winglet. As with traditional winglets, the intent was to minimize induced drag, and now with a blended design the goal was to further reduce parasite drag. An added benefit to the introduction of blended winglets was an improvement in takeoff/landing performance of the aircraft, allowing for better obstacle clearance and the ability to derate the engine thrust. This ultimately helps with reducing engine maintenance costs and reduces noise when operating in areas requiring noise abatement procedures. Finally, blended winglets also increased the range and payload of the aircraft, an asset to any commercial aircraft.
The remaining circular flow creates an inward velocity, Vi, which can be vectorially added to the aircraft's relative velocity, Vac, to obtain the relative wind, RW, shown in the top view of Fig. 5.22. The aerodynamic force, drag, and lift vectors are also shown. The lift vector is tilted forward and by dropping a line from the arrow of the lift vector perpendicular to the winglet's chord line, we get a vector, −D. This is larger and opposite to the drag vector, showing that the winglet actually is not causing drag on the airplane.
Reduction of Skin Friction Drag
The major way that skin friction drag can be reduced is by maintaining the laminar airflow over the skin surfaces. Skin smoothness is one obvious method. Laminar flow airfoils is another method of delaying boundary layer transition from laminar to turbulent flow. A third method is the use of laminar flow control, LFC.
LFC requires removal of the thickening boundary layer by suction. Thin slots or holes are cut in the upper wing surfaces and suction is applied by mechanical means to remove the lower layers of the boundary layer and laminar flow is maintained. Full‐scale tests have been run and full wing laminar flow was achieved, but the results were not completely successful. The cost and complexity of cutting the tiny slots, controlling the suction amounts, the need for double skin surfaces, the added weight and complexity of the suction engines and ducting, and other problems have prevented commercial development to date.
SYMBOLS
| AR | Aspect ratio |
| b | Wing span (ft) |
| C | Chord (ft) |
| Cav | Average chord |
| Cr | Root chord |
| Ct | Tip chord |
| Di | Induced drag (lb) |
| Dp | Parasite drag |
| DT | Total drag |
| f | Equivalent parasite area (ft2) |
 |
Maximum lift/drag ratio |
| MAC | Mean aerodynamic chord (ft) |
| 2w | Downwash velocity (knots) |
| α0 | AOA of infinite wing |
| αi | Induced AOA of finite wing |
| λ (lambda) | Taper ratio |
| Λ (uppercase lambda) | Sweep angle (degrees) |
EQUATIONS
- 5.1
- 5.2

- 5.3

- 5.4

- 5.5
- 5.6

- 5.7
PROBLEMS
- The coefficient of drag can be defined as
- the ratio of lift forces to drag forces.
- a measure of the efficiency of the airplane.
- the ratio of drag forces to lift forces.
- the ratio of drag pressure to dynamic pressure.
- Laminar flow airfoils have less drag than conventional airfoils
- in the high‐CL region.
- in the high‐AOA region.
- in the high‐speed region.
- in the landing phase of flight.
- Laminar flow airfoils have less drag than conventional airfoils because
- the adverse pressure gradient starts farther back on the airfoil.
- the airfoil is thinner.
- more of the airflow is laminar.
- Both (a) and (c)
- Lift/drag ratio is
- a measure of the aircraft's efficiency.
- a maximum when the drag is a minimum.
- numerically equal to the glide ratio.
- All of the above
- An airplane flying at CL(max) will have
- more parasite drag than induced drag.
- more induced drag than parasite drag.
- equal amounts of parasite and induced drag.
- Not enough information is given to evaluate the drag.
- Induced drag is
- more important to low aspect ratio airplanes than to high aspect ratio airplanes.
- reduced when the airplane enters ground effect.
- reduced if the airplane has winglets.
- All of the above
- Induced drag results from the lift vector being tilted to the rear, because
- the tip vortices cause downwash behind the wing.
- the relative wind behind the wing is pushed downward.
- the local relative wind at the AC is depressed.
- All of the above
- An airplane with a heavy load _____ it can when lightly loaded.
- can glide farther than
- cannot glide as far as
- can glide the same distance as
- If an airplane has a symmetrical wing that has an angle of incidence of 0° during takeoff, all the drag is
- profile drag.
- parasite drag.
- wave drag.
- induced drag.
- A low‐tailed airplane with static ports beneath the wing leaves ground effect after takeoff. It will have:
- increased drag, nose‐up pitch, lowered IAS.
- increased drag, nose‐up pitch, higher IAS.
- decreased drag, nose‐down pitch, lowered IAS.
- decreased drag, nose‐up pitch, higher IAS.
- A 10,000‐lb aircraft has a (L/D)max value of 9.8; find its minimum drag.
- If the aircraft in Problem 11 has a wing area
 and the value of
  , find the sea level airspeed where Dmin occurs.
 - For the aircraft in Problem 11 find Di and Dp at (L/D)max.
- For the aircraft in Problem 11 complete the following table and plot Di, Dp, and DT on a sheet of graph paper.
V2 (V2/V1)2 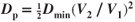


125 150 172 200 300 400