Chapter 10
Takeoff Performance
Takeoff performance involves accelerated motion. During takeoff, the aircraft starts from zero velocity, accelerates to takeoff velocity, and becomes airborne. The relationships among acceleration, velocity, takeoff distance, and time are not familiar to the average pilot and should be understood as well as experienced. This chapter discusses the factors involved in attaining takeoff velocity.
The following considerations are very important factors in evaluating takeoff performance for a given aircraft, location, mission, and pilot technique:
- Takeoff velocity, which could be a function of stall speed, minimum control speed, or the thrust (or power) available‐thrust (or power) required relationship
- The acceleration during takeoff (we will assume constant acceleration)
- The distance required to complete the takeoff
- Obstacle clearance after takeoff
- Regulatory guidance and/or company operation specifications
There are many factors that affect the calculation of takeoff performance:
- Aircraft gross weight
- Thrust on the aircraft
- Temperature
- Pressure altitude
- Wind direction and velocity
- Runway slope
- Runway surface
The manufacturer of the aircraft publishes operating specifications, as well as performance charts and tables for the pilot(s) to follow. As the seven factors above change, because one or more of them will on every flight, the pilot(s) must adjust accordingly to remain inside the operating envelope of the aircraft. Figure 10.1 is a typical takeoff distance graph used to calculate takeoff distance for a small, retractable gear aircraft.
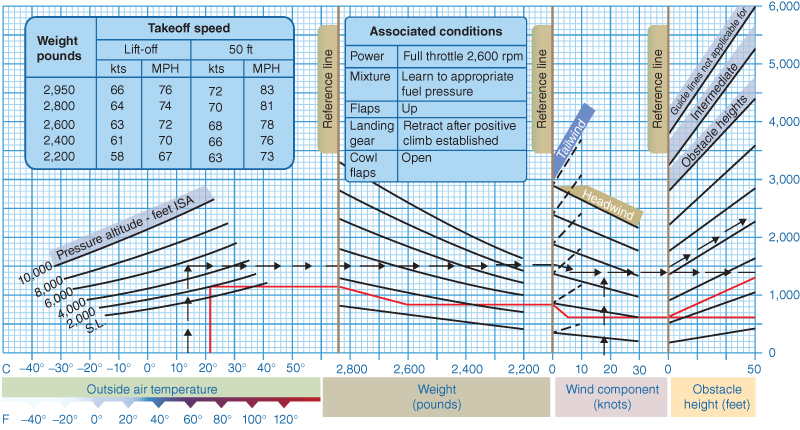
Figure 10.1 Takeoff distance graph.
U.S. Department of Transportation Federal Aviation Administration, Pilot's Handbook of Aeronautical Knowledge, 2008
DEFINITIONS IMPORTANT TO TAKEOFF PLANNING
There are many performance V‐speeds that are important to a pilot during takeoff to safely operate the aircraft as recommended by the manufacturer and while maintaining regulatory compliance. The definitions below are not a complete listing of all the speeds/definitions that may be encountered, but included are the more common terms used by both transport and nontransport aircraft.
- Accelerate‐go distance. The distance required to accelerate to V1 with all the engines at takeoff power, then experience an engine failure at V1 and continue the takeoff on the remaining engine(s).
- Accelerate‐stop distance. The distance required to accelerate to V1 with all the engines at takeoff power, then experience an engine failure at V1 and be able to bring the aircraft to a stop on the remaining runway with only braking action and spoilers (Fig. 10.2). Reverse thrust is not used during flight testing, thereby giving the flight crew an extra margin of safety.
- Balanced Field Length (BFL). The total length of runway required to accelerate on all engines to V1, experience an engine failure, and then continue to takeoff or stop (Fig. 10.3). For a safe takeoff the BFL must be no greater than the runway available.
- Best Angle of Climb – VX. As we saw previously, the speed at which the aircraft will obtain the highest altitude in a given distance.
- Best Rate of Climb – VY. As we saw previously, the speed at which the aircraft will obtain the highest altitude in a given time.
- Critical Engine Failure Speed – VEF. The speed at which the critical engine is assumed to fail during takeoff.
- Critical Field Length (CFL). The minimum runway length required for a specific takeoff weight, and may be the longer of the balanced field length or 115% of the all engine takeoff distance. The CFL should not be greater than the runway available.
- Flaps Extended Speed – VFE. Maximum speed at which the wing flaps can be in a given extended position due to air loads.
- In‐Flight Minimum Control Speed – VMCA. The minimum speed at which an engine can be lost and directional control maintained using full rudder deflection and not more than 5° of bank into the operating engine. VMCA does not apply to single‐engine aircraft.
- Gear Operating Speed – VLO. Maximum speed at which the landing gear should be extended or retracted.
- Ground Minimum Control Speed – VMCG. The minimum airspeed at which the airplane, while on the ground, can lose an outboard engine and maintain directional control. VMCG does not apply to single‐engine aircraft.
- Lift‐off – VLOF. The speed at which the aircraft first departs the runway.
- Maximum Braking Energy Speed – VMBE. The highest speed from which the airplane may be brought to a stop without exceeding the maximum energy absorption capacity of the brakes.
- Power‐off Stalling Speed – VS0. The speed at which the aircraft is controllable in the landing configuration, often used to calculate liftoff or initial climb speed.
- Refusal Speed. The maximum speed that the aircraft can obtain under normal acceleration and then stop in the available runway, sometimes written as VR or VREF.
- Rotation – VR. The speed at which the aircraft is rotated in order to initiate takeoff attitude, may coincide with VLOF, never less than V1.
- Takeoff Decision Speed – V1. The maximum speed in the takeoff at which the pilot must take the first action (e.g., apply brakes, reduce thrust, deploy speed brakes) to stop the airplane within the accelerate‐stop distance. V1 also means the minimum speed in the takeoff, following a failure of the critical engine at VEF, at which the pilot can continue the takeoff and achieve the required height above the takeoff surface within the takeoff distance.
- Takeoff Safety Speed – V2. The speed to which the airplane must be accelerated at or before reaching 35 ft above the end of the runway. Used primarily for transport category aircraft during instrument departures after experiencing failure of an engine during takeoff, and when a desired climb gradient must be met.
- Takeoff Distance. The distance required to complete an all‐engines operative takeoff to a 35 ft height, and must be at least 15% less than the distance required for a one‐engine inoperative takeoff distance.
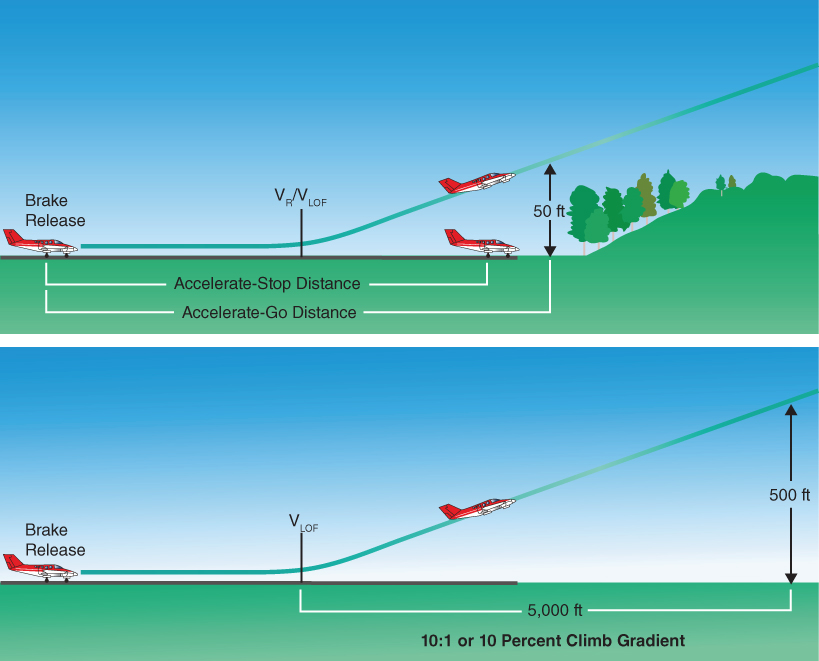
Figure 10.2 Accelerate‐stop distance, accelerate‐go distance, and climb gradient.
U.S. Department of Transportation Federal Aviation Administration, Airplane Flying Handbook, 2004
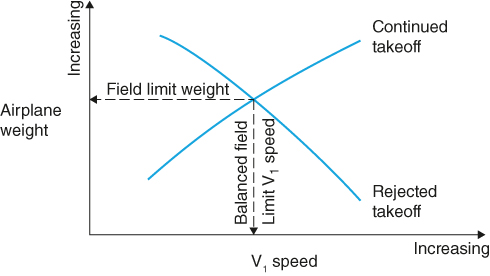
Figure 10.3 Balanced field length.
U.S. Department of Transportation Federal Aviation Administration, Takeoff Safety Training Aid, Advisory Circular No. 120‐62
Transport category aircraft fall under parts 25 and 29 of Title 14 of the Code of Federal Regulations (CFR), and must display high levels of performance with built‐in safety margins. In addition to adherence to many of the V‐speeds mentioned above, additional performance criteria have to be calculated and followed during all phases of flight. Figure 10.4 shows an example of the strict safety margins required of transport category aircraft during the climb segment breakdown with one engine inoperative.
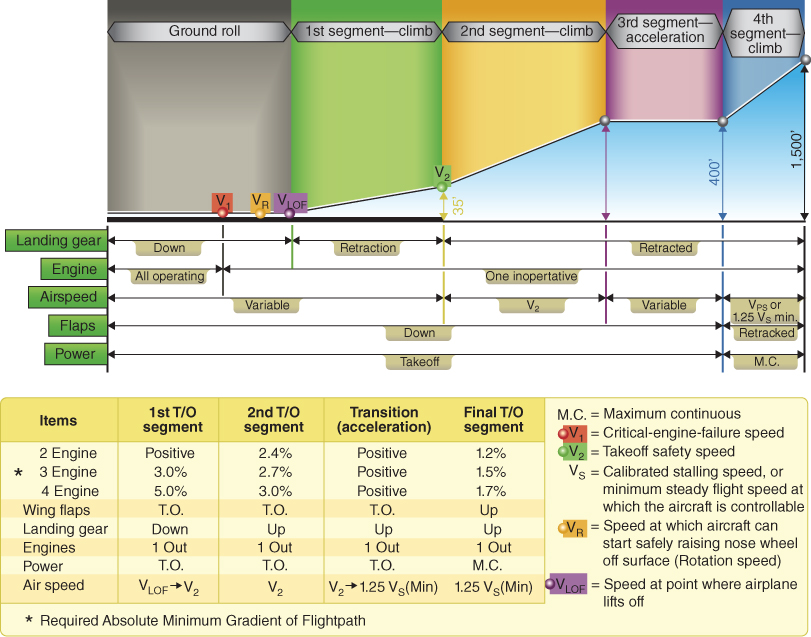
Figure 10.4 Segmented one‐engine climb graph.
U.S. Department of Transportation Federal Aviation Administration, Pilot's Handbook of Aeronautical Knowledge, 2008
ABORTED TAKEOFFS
A graphic representation of the refused takeoff situation is shown in Fig. 10.5. At the brakes release point the aircraft starts to accelerate, and the variation of velocity and distance is as shown on the takeoff acceleration profile. The deceleration profile shows the variation of velocity with distance as the airplane is brought to a stop at the end of the runway; this is referred to as the accelerate‐stop distance. The refusal speed is determined by the intersection of the acceleration and deceleration profiles. This speed is commonly called decision speed (V1). An allowance for pilot reaction time is included in the calculation of refusal speeds.
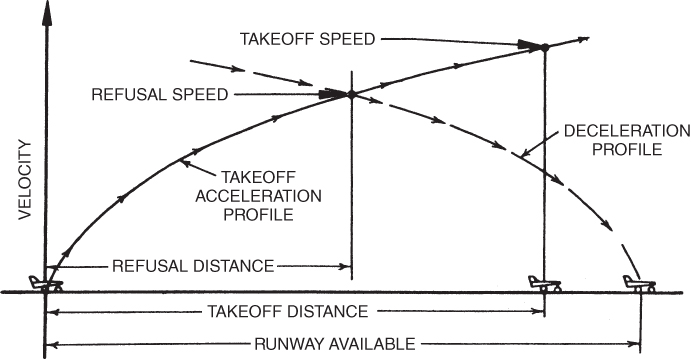
Figure 10.5 Single‐engine velocity–distance profiles.
Once the refusal speed is exceeded, the aircraft cannot be brought to a stop in the runway remaining. If a single‐engine airplane loses its engine above refusal speed it will end up in the overrun. A multi‐engine airplane should continue to make an engine‐out takeoff if an engine fails above this airspeed (Fig. 10.6). At or above V1 the pilot of the multi‐engine airplane must continue the takeoff after losing an engine. As can be seen in Fig. 10.6, acceleration will be less with the loss of an engine, but takeoff velocity, V2, will be the same. Thus, takeoff distance will be greater. In some cases, the remaining runway may not be long enough to allow the airplane to accelerate to V2. Thus, balanced field length becomes important since it assures that this will not happen. Figure 10.6 shows the condition where actual field length is exactly equal to balanced field length and V2 is reached at the exact end of the runway.
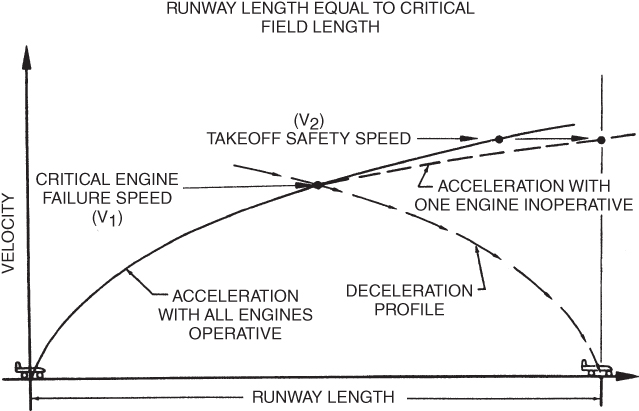
Figure 10.6 Multi‐engine velocity–distance profiles.
LINEAR MOTION
Takeoff and landing distance computation is a complex subject, and the takeoff charts in the pilot's handbook should be closely studied. This book makes no effort to analyze the problems in detail but simply explains how changes in weight, altitude, runway slope, headwind/tailwind, and other factors influence the aircraft's performance. The problem is simplified if we assume that the aircraft's acceleration is a constant during the takeoff roll.
Jet transport aircraft have been found to normally accelerate at about 6 knots per second. This makes it particularly important to make the stop or takeoff (Go/No‐Go) decision at V1. The V1 speed allows a one‐second delay for the line pilot to react (i.e., initiate the stop, or continue the takeoff). Any further delay defaults to the takeoff decision. If the crew attempts to stop, departure from the runway at 80 knots or greater will most likely be the result.
Newton's laws of motion express relationships among force, mass, and acceleration, but they stop short of discussing velocity, time, and distance. These are covered here and will be a partial review of Chapter 1. The formulas that are derived here are valid only for constant acceleration.
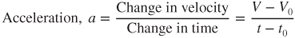
where
| V | = | velocity at time t |
| V0 | = | velocity at time t0 |
If we start at time  and rearrange the above equation we get

The distance, s, traveled in a certain time is

The average velocity, Vav, is
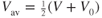
So

Solving Eqs. 10.1 and 10.2 simultaneously and eliminating t, we can derive a third equation:

In applying these equations to the takeoff problem where the aircraft starts from a “brakes locked” position on the runway, V0 is zero. The equations are then simplified and Eq. 10.3 becomes

where
| s | = | distance (ft) |
| V | = | takeoff velocity (fps) |
| a | = | acceleration (fps2) |
The acceleration of an aircraft during takeoff is determined by applying Newton's second law:  . The force that provides the acceleration for takeoff is the unbalanced force acting on the aircraft during the takeoff roll. This is called the net accelerating force and is illustrated in Fig. 10.7.
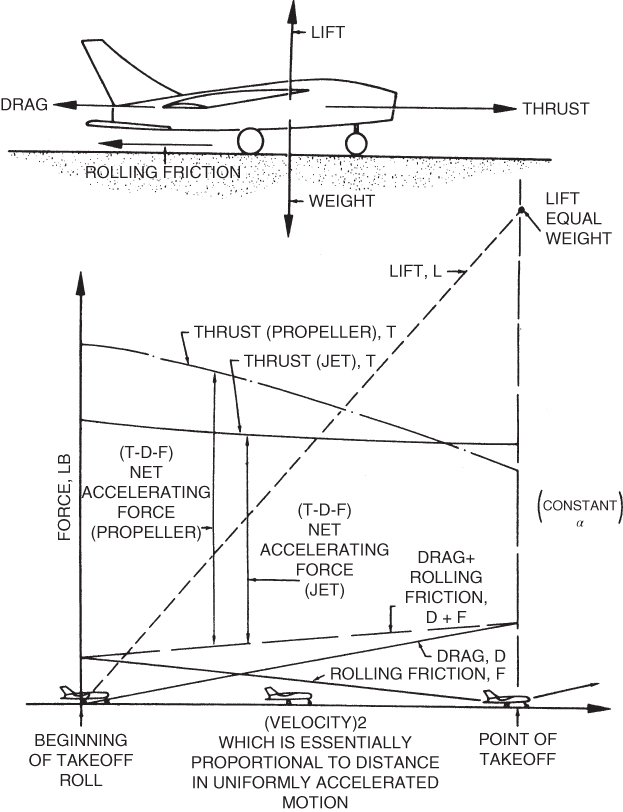
Figure 10.7 Forces on an airplane during takeoff.
Two assumptions are made in constructing Fig. 10.7. The first is that no lift is being developed as the aircraft gathers speed. This is true for many of the higher‐performance aircraft that have the wing positioned on the aircraft at an angle of incidence that produces the least drag rather than one that produces lift. These aircraft must “rotate” at takeoff speed to develop lift. Most transport aircraft and military aircraft fit into this category. If no lift is developed during the takeoff run, rolling friction remains constant until rotation. The second assumption is that the thrust increases during acceleration and that net accelerating force is constant throughout the takeoff run and thus Eq. 10.4 is valid.
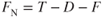
Figure 10.7 shows that the net accelerating force on the aircraft, FN, equals the thrust T, minus the drag, D, minus the rolling friction, F:
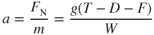
By substituting in Newton's second law equation and rewriting we obtain
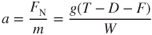
where
| a | = | acceleration (fps2) |
| FN | = | net accelerating force (lb) |
| W | = | weight (lb) |
| g | = | gravitational acceleration (= 32 fps2) |
| m | = | mass (slugs) (= W/g) |
Equation 10.5 shows that the acceleration of the aircraft is affected by the thrust, the drag, the rolling friction, and the weight of the aircraft.
FACTORS AFFECTING TAKEOFF PERFORMANCE
We saw at the beginning of this chapter that multiple factors affected takeoff performance. To see how these factors affect takeoff distance (s), we use Eq. 10.4 to make a ratio. A subscript 1 denotes a known set of conditions, and a subscript 2 applies to a new set of conditions:
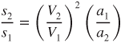
The effects of weight change, altitude change, and wind conditions on takeoff distance can be found by applying Eq. 10.6.
Weight Change
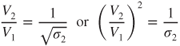
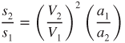
Increasing the gross weight of an aircraft has a threefold effect on takeoff performance: (1) takeoff velocity is increased, (2) there is more mass to accelerate, and (3) there is more rolling friction. Takeoff velocity means the liftoff speed will have to be higher to compensate for the increase in weight; this results in a longer takeoff distance. In general, a 10% increase in takeoff gross weight may result in a 21% or higher increase in takeoff distance. Takeoff velocity varies as the square of the weight. This was discussed in Chapter 4 and shown in Eq. 4.3:

Squaring this equation gives

The effect of increasing weight on an aircraft's acceleration is twofold: There is more mass to be accelerated and there is more rolling friction. For a dry concrete runway, the coefficient of rolling friction is about 0.02, so an increase in weight of 1000 lb means a loss in accelerating force of 20 lb. This change is small, so the principal effect on acceleration is due to the change in the mass of the aircraft.
Acceleration is inversely proportional to the mass (or weight) of the aircraft. Therefore, if the rolling friction increase is ignored, the acceleration term is

If we substitute values from these last two equations into Eq. 10.6, the effect of a weight change on takeoff distance is

Altitude
Pressure altitude corrected for runway temperature results in runway density altitude. This may be considerably higher than the field density altitude, because runway temperatures can be higher than the official field temperature. An increase in density altitude has a twofold effect on takeoff performance: (1) A higher takeoff velocity (TAS) is required, and (2) for nonturbocharged reciprocating engines and for turbine engines, less thrust is available and reduced net accelerating force.
To produce lift equal to the weight of the aircraft at a given AOA, the dynamic pressure must be the same, regardless of the altitude. Thus, the airplane will take off at the same equivalent airspeed (EAS) at altitude as at sea level. Because of the reduced density of the air, however, the true airspeed (TAS) will be greater at altitude.
From basic aerodynamics, we learned that the relationship between true and equivalent airspeed was expressed by Eq. 2.12:

Thus, the velocity for takeoff at an airfield with a density altitude above sea level (V2), as compared to the velocity required at sea level on a standard day, (V1) is
For nonturbocharged reciprocating engines and turbine engines, the power or thrust available decreases approximately as the air density (or density ratio). As thrust is decreased, acceleration (a2) is also decreased, as follows

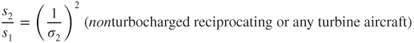
Substituting values from these last two equations into Eq. 10.6 gives us the effect of altitude on takeoff distance for nonturbocharged reciprocating or turbine engine aircraft:

Turbocharged reciprocating engines can deliver sea level power up to their critical altitude, so no decrease in thrust or acceleration occurs below that altitude. Thus,

where
| s1 | = | standard sea level takeoff distance |
| s2 | = | altitude takeoff distance |
| σ2 | = | altitude density ratio |
Wind
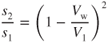
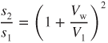
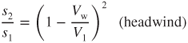
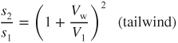
Takeoff into a headwind is preferred, and allows the aircraft to reach takeoff velocity at a lower groundspeed than for a no‐wind condition. A headwind that is 10% of the takeoff airspeed will reduce takeoff distance by approximately 20%, while taking off with a tailwind that is 10% of the takeoff airspeed will increase the takeoff distance by close to the same amount (Fig. 10.8). The takeoff velocity, V2, with a headwind, in terms of the no‐wind takeoff velocity, V1, and the velocity of the headwind Vw, is

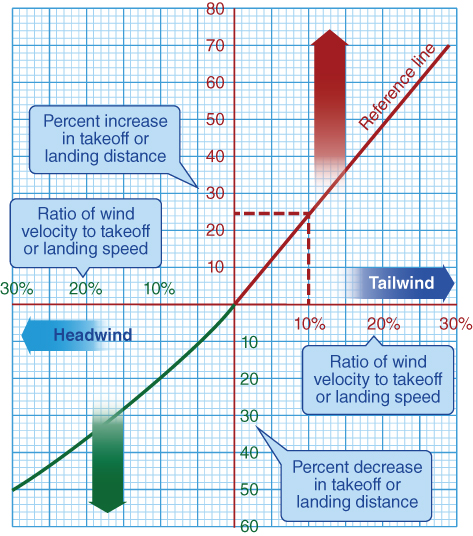
Figure 10.8 Effect of wind on takeoff.
U.S. Department of Transportation Federal Aviation Administration, Pilot's Handbook of Aeronautical Knowledge, 2008
Dividing both sides of this equation by V1 and squaring gives
Although the acceleration over the ground is reduced by a headwind, the acceleration through the air mass is not affected. Therefore,
Substituting the values of these last two equations into Eq. 10.6, we find that the effect of a headwind on the takeoff distance is
Takeoff with a tailwind simply means that the groundspeed must be increased over the no‐wind groundspeed by the amount of the tailwind:
Runway Surface and Slope
Most performance charts are for a paved, smooth, level, and dry runway surface; of course, that is not always possible. Any surface contamination will often decrease acceleration, delay takeoff velocity, and extend the takeoff distance required. These “abnormal” conditions will also affect performance speeds and change the value of the balanced field length. Always consider the warnings, notes, and conditions published on the performance charts or in other operating limitations.
If the runway has a slope (or gradient) to it, the component of the weight that is parallel to the runway surface will reduce the net accelerating force, in case of an upslope, or increase the accelerating force, in case of a downslope:

This results in an increase in takeoff distance if attempting to take off uphill, and a decrease in takeoff distance if taking off downhill. The takeoff distance charts in the pilot's handbook usually include runway slope calculations. A rule of thumb is five percent increase in takeoff distance for each percent of uphill slope. Figure 10.9 shows an example of a common source of runway surface and slope information for planning a flight.
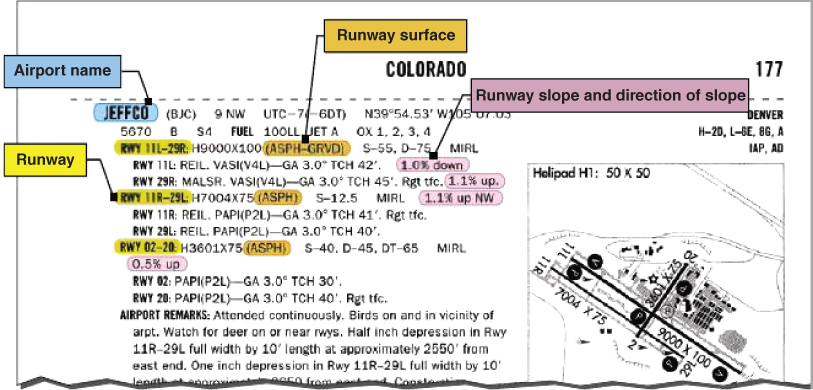
Figure 10.9 U.S. Chart Supplement information.
U.S. Department of Transportation Federal Aviation Administration, Pilot's Handbook of Aeronautical Knowledge, 2008
IMPROPER LIFTOFF
Proper takeoff roll and liftoff is paramount to achieving the performance numbers calculated before departure. With experience, a pilot develops a smooth, coordinated takeoff, on airspeed, and following the manufacturer's prescribed procedures. Unfortunately many pilots have not practiced this technique and are unfamiliar with many of the aerodynamic principles discussed thus far. Not understanding the effects of a crosswind and the aircraft's tendency to weathervane into the wind can lead to departure from centerline or structural damage to the aircraft. Forcing the aircraft into premature liftoff before the airplane is ready to fly outside of ground effect can lead to longer takeoff distances and climb gradients that cannot be met. As we saw during our discussion on drag, high pitch angles lead to increased rates of induced drag, and when combined with the effect of increased pitch angle when climbing out of ground effect the consequences can be deadly.
Crosswind Takeoff
Though a direct headwind is always preferred for takeoff, a headwind component without a crosswind component is rarely experienced. During training in single‐engine propeller aircraft, pilots should practice takeoffs with varying wind velocities and crosswind components to better understand wind effect on the aircraft during takeoff roll. Once the takeoff roll begins, the pilot should apply control pressure toward the upwind aileron. A downward force is created on the upwind wing, keeping the wing from lifting due to the effect of the crosswind. Directional control should be maintained with rudder so the longitudinal axis of the aircraft is aligned with the runway centerline. Depending on the aircraft type and rpm setting, the pilot may have to correct for the left‐turning tendency of the aircraft, which will require additional rudder to produce a larger angle of attack and resulting side force on the left side of the vertical stabilizer.
As the aircraft increases speed, more aerodynamic forces will be moving over the surfaces of the ailerons, allowing them to be more effective. Aileron pressure should be gradually reduced as their effectiveness increases. Depending on the velocity of the wind and speed of the aircraft, partial pressure of the aileron may need to be continued throughout the takeoff roll and liftoff to in order to keep the upwind wing from rising too far. If the pilot fails to maintain proper crosswind technique, and the controls are neutralized, the aircraft may begin “skipping” toward the downwind wing off the centerline (Fig. 10.10). Not only is this poor technique, but depending on the severity, the aircraft could exit the side of the runway or experience structural damage to the landing gear from the sideward force.
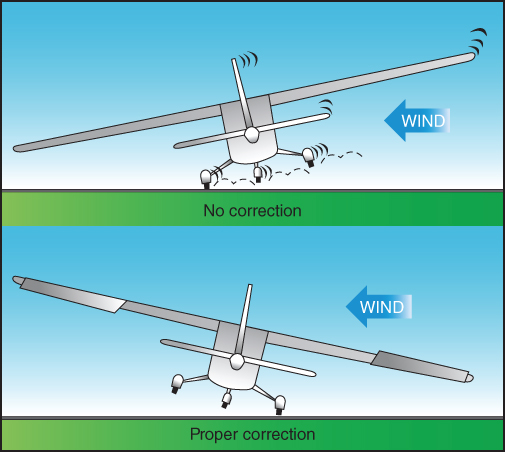
Figure 10.10 Crosswind takeoff.
U.S. Department of Transportation Federal Aviation Administration, Airplane Flying Handbook, 2004
Proper crosswind takeoff technique involves a coordinated effort by the pilot to maintain runway centerline by proper use of rudder pressure along with varying aileron pressure from takeoff roll through liftoff in order to keep the upwind wing down. Immediately after liftoff, the pilot transitions to a crab to counteract the crosswind. If aileron is kept into the wind, and opposite rudder applied to keep the fuselage aligned with runway, the pilot would be flying in a side slip. Sideslips are normally used for crosswind landings in small aircraft.
Premature Liftoff
In Chapter 5 we discussed the effects of ground effect on landing and takeoff, and then characteristics that the aircraft exhibited when entering and departing ground effect. Ground effect will also allow an aircraft to depart the runway and remain in the air before “normal” flying speed has been reached due to the reduction in induced drag, as long as the aircraft remains within one wingspan or less above the ground. If the pilot continues to pitch up with an increasing angle of attack, drag is increased and the aircraft may settle back to the runway, greatly increasing takeoff distance and jeopardizing stopping distance within the remaining runway (Fig. 10.11). Training maneuvers like soft‐field takeoff procedures maximize the benefit of ground effect while allowing the pilot to gain the feel of an aircraft at minimum flying speed within one wingspan of the ground.
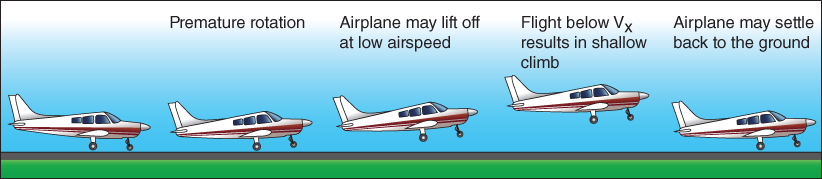
Figure 10.11 Premature takeoff.
U.S. Department of Transportation Federal Aviation Administration, Airplane Flying Handbook, 2004
Dangers of Overrotation
The dangers of overrotation during takeoff are twofold. First, high AOA results in high induced drag and possible loss of lift (if CL(max) is exceeded). Second, once the aircraft is airborne, it may be impossible to climb the aircraft out of ground effect. When the aircraft departs the vicinity of the runway, the downwash is unhampered by the ground and is noticeably increased and a large increase in induced drag occurs. The increased downwash may envelop the horizontal tail and cause pitch‐up moments, which add to the high AOA condition.
The most photographed aircraft accident in history occurred when an F‐100 fighter attempted an emergency landing. This accident has been nicknamed the “Sabre Dance.” It is a classic example of the danger of overrotation. The aircraft had a misaligned nose wheel and the pilot was attempting an emergency landing. The runway was partially foamed to lessen the chance of fire. The pilot thought he was overrunning the foamed portion and decided to go around for another approach. To prevent the damaged nose wheel from contacting the runway, the pilot purposely held the nose high as he added throttle for the go‐around. The airplane remained airborne but could not accelerate or fly away from the runway (out of ground effect) because of the high induced drag. Several thousand feet down the runway the aircraft lost directional control and crashed at about 90° heading to the runway.
SYMBOLS
| F | Rolling friction force (lb) |
| FN | Net accelerating force |
| V1 | Takeoff decision speed (knots) |
| V2 | Takeoff speed (knots) |
| VEF | Critical engine failure speed (knots) |
| VFE | Flaps extended speed (knots) |
| VLO | Gear operating speed (knots) |
| VLOF | Lift‐off (knots) |
| VMBE | Maximum braking speed (knots) |
| VMCA | In‐flight minimum control speed (knots) |
| VMCG | Ground minimum control speed (knots) |
| VR | Rotation (knots) |
| VS0 | Power‐off stalling speed (knots) |
| VREF | Refusal speed (knots) |
| VX | Best angle of climb (knots) |
| VY | Best rate of climb (knots) |
| VW | Wind speed (knots) |
EQUATIONS
- 10.1

- 10.2

- 10.3

- 10.4

- 10.5
- 10.6
- 10.7

- 10.8
- 10.9

- 10.10
- 10.11
PROBLEMS
- Takeoff velocity for a multi‐engine airplane is a function of:
- stall speed.
- minimum control speed.
- low‐speed region where
 .
. - The highest of the above
- Takeoff distance is a function of
- takeoff velocity.
- acceleration.
- Both (a) and (b)
- Takeoff distance is
- directly proportional to the acceleration.
- inversely proportional to the velocity squared.
- inversely proportional to the acceleration.
- directly proportional to the velocity squared.
- Both (c) and (d)
- As weight increases the takeoff distance increases because
- there is less thrust and thus less acceleration.
- there is more mass and thus less acceleration.
- the takeoff velocity is higher.
- Both (b) and (c)
- As weight (W2) increases the takeoff distance increases
- directly as the square of W2/W1.
- directly as W2/W1.
- inversely as the square of W2/W1.
- inversely as W2/W1.
- For jet aircraft, takeoff distance at altitude is greater than at sea level because
- the thrust available is less.
- the EAS for takeoff is greater.
- the TAS for takeoff is higher.
- Both (a) and (c)
- Which of the aircraft below will pay the greatest penalty in high‐altitude takeoff distance?
- One with a turbocharged reciprocating engine
- One with a turbine engine
- One with an nonturbocharged reciprocating engine
- Both (b) and (c)
- Takeoff acceleration through the air mass is not reduced by a headwind.
- True
- False
- Takeoff with a tailwind requires that the takeoff groundspeed be _____ by the amount of the tailwind.
- increased
- decreased
- not affected
- Thrust available during takeoff = 3000 lb
- Turbojet engines
- Combined average drag and rolling friction = 500 lb
- Gross weight = 10,000 lb
- Takeoff speed = 120 knots (203 fps)
- Sea level standard conditions
- Calculate the airplane's acceleration.
- What should the airspeed be at the 1000‐ft runway marker?
- Calculate the no‐wind takeoff distance.
- If the weight is increased to 15,000 lb, calculate the no‐wind takeoff distance.
- Calculate the takeoff distance for the 10,000‐lb airplane if there is a 12‐knot headwind.
- Calculate the no‐wind takeoff distance for the 10,000 lb airplane operating from an airfield where the density ratio is 0.8.