As speed of change accelerates, it becomes increasingly difficult to predict changes with sufficient accuracy and reliability to permit a timely full-scale response. This chapter, based on a paper published in 1975, anticipated the current interest in weak signals which permit a firm to respond to poorly predictable events.
Why Weak Signals?
Strategic issue management , discussed in the last chapter, enhances the timeliness of the organization’s response in three ways: (1) It detects surprising changes in real time as they become evident; (2) it responds in real time without waiting for the annual planning exercise; and (3) it uses a cross-organizational task force approach which expedites the resolution of issues.
Real-time detection of strategic issues increases the time available for response. But, recalling the discussion of Chapter 2, as the speed of surprising changes increases, the predictability drops. This means that by the time information about the change becomes sufficient to permit a well-considered response, the time remaining may be inadequate to complete the response before the threat strikes, or an opportunity is missed.
Thus, there is a paradox: If the firm waits until information is adequate for a decisive response it will be increasingly surprised by crises; if it accepts vague information, the content will not be specific enough for a thorough analysis and a well-considered response to the issue.
A solution to this paradox is to change the approach for using strategic information. Instead of waiting for sufficient information to accumulate, an organization can determine what immediate steps in planning and action are feasible now. As clearer strategic information becomes available in the course of the evolution of a threat or opportunity, additional, more decisive steps can be taken.
Early in the life of a threat, when the information is vague and the organization’s future course is unclear, the responses will be correspondingly unfocussed, aimed at increasing the strategic flexibility of the firm. As information becomes more precise, so will the firm’s response, eventually terminating in a direct action to counter the threat or exploit the opportunity. But the prior buildup of flexibility will allow this action to occur sooner; the action will be better planned and executed.
This approach is called the graduated response through amplification and response to weak signals . In this section, a practical method for graduated response will be proposed. The first task is to explore the range of weak signals that can be typically expected from a strategic discontinuity.
States of Knowledge
In strategic planning, the information required for evaluating the impact of threats and opportunities (T/Os) seems to be imperfect because of the uncertainties in both their occurrence and probable course. A closer look shows that while uncertainty exists, the information is very content-rich: The threat has to be well-enough understood to compute the possible profit consequences and the responses well-enough developed to estimate both their costs and their mitigating effects on the threat.
It is reasonable to expect this knowledge from a T/O which arises from a familiar, prior experience. This will be the case when a competitor introduces a new marketing approach, a new product, or a new pricing strategy. But when the T/O is discontinuous (such as the impact of laser technology on land surveying or of large-scale integration on electronic components), in the early stages the nature, impact, and possible responses are unclear. Frequently it is not even clear whether the discontinuity will develop into a threat or an opportunity.
Thus, when a threat or opportunity first appears on the horizon, the organization must be prepared to deal with very vague information, which will eventually develop and improve with time.
States of knowledge under discontinuity
States of Knowledge Information content | (1) Sense of threat/opportunity | (2) Source of threat/opportunity | (3) T/O defined | (4) Response defined | (5) Outcome |
|---|---|---|---|---|---|
Conviction that discontinuities are impending | Yes | Yes | Yes | Yes | Yes |
Area of organization is identified which is the source of discontinuity | No | Yes | Yes | Yes | Yes |
Characteristics of threat, nature of impact, general gravity of impact, timing of impact | No | No | Yes | Yes | Yes |
Response identified: TIMING, action programs, budgets | No | No | No | Yes | Yes |
Profit impact and consequences of response are computable | No | No | No | No | Yes |
At the other extreme, level 1 is the highest state of ignorance that can be of use to management. All that is known is that some threats and opportunities will undoubtedly arise, but their shape, nature, and source are not yet known. In today’s political and economic fog of uncertainty, many firms find themselves in this state of ignorance. Having experienced shocks of change in the recent past, managers are convinced that new ones are coming, but they cannot identify the source. State of knowledge on level 2 improves matters somewhat. For example, in the 1980s, it was generally recognized that small ‘desktop’ computers had great potential for the electronics industry. But the invention of the specific discontinuities, such as portable laptop computers, the integration of computers with wireless communication, high computing power in small mobile devices, and the explosion of software applications, was still several years off. The source of the T/O was clear (state 2), but not the T/O itself. As various technologies reached the prototype stage, the knowledge was raised to level 3, but at the outset the ramifications of the technological tidal wave were unclear, as were the defensive and aggressive responses that different firms were eventually to make.
When the firms developed and made their initial responses and knowledge was raised to level 4, the eventual investments and profits were not yet visible. Pioneering firms were investing boldly in the new technology with little experience to guide them, in high hopes that their entrepreneurial risks would pay off. Level 5 was not reached until knowledge of computer processing, telecommunications, software design, and the Internet were sufficient to make reasonable predictions of the ultimate technology and its profitability. But by then, the leaders were entrenched, and those who originally held back had to pay a high cost of entry into the industry.
Strong and Weak Signals
In Table 20.1, as the number of ‘Yes’ entries in each row grows, ignorance is reduced and information is increased as a T/O evolves from level l to level 5. A variable of crucial importance is the time remaining at level 5 before the full impact of a T/O will be felt by the organization. For a threat, this is the time remaining before maximum loss of profit has occurred; for an opportunity, it is the time before competitive responses by other firms will have progressed to a point at which an attempt by a new competitor to join the market is doomed to be unsuccessful and unprofitable. The time remaining must be compared with the response time required by the organization to avert the threat or capture the opportunity.
If the time remaining at knowledge level 5 is insufficient, then the organization can try to start its response at a lower knowledge level. However, below level 5 there is not enough information to make reliable estimates of the impact and of the effectiveness of response to permit a commitment to an irreversible, unambiguous response. Instead of making a definite commitment to a course of action, management must choose steps which prepare the organization for the ultimate response and, at the same time, keep the options open.
The situation in which knowledge level 5 is reached and the time remaining to act is sufficient for a calculated response is known as a strong signal problem . In contrast, the situation case when the time to act is insufficient when knowledge level 5 is reached is the weak signal problem .
The strategic issue management procedure developed in the preceding chapter was based on strong signals. In this chapter, we discuss the modifications in the procedure necessary to make it applicable to the weak signal problem .
Gaining Acceptance for Weak Signal Management
Perhaps the most important step is to convert senior managers, who must manage the system, to acceptance of the weak signal approach. Strategic and creative managers would have little difficulty with the concept because, as we discussed in Chapter 9, theirs is essentially a ‘weak signal mentality’ (see section ‘Strategic and Creative Mentalities’). Therefore, strategic and creative managers must be ‘sold’ not so much on the weak signal concept as on the idea that a systematic management of weak signals is desirable.
The argument to be used is that in the modern turbulent world, weak signals are numerous and frequently novel, and that it will be dangerous to continue handling them in an ad hoc manner.
Managers with mentalities other than strategic or creative will have difficulty in accepting the very concept of weak signals, because their experience (and that of several generations of their teachers and mentors) is based on strong signals. Therefore, selling the concept to them will encounter strong resistance. In Part V, we offer suggestions for overcoming this resistance and changing the mentality of such managers.
Detection of Weak Signals
Use of weak signals means that individuals responsible for identifying issues must begin to listen for early warning of threats and opportunities . For example, in the list of Table 19.1, item 29 (strategic surprises ) must be expanded into more specific descriptions.
In recent years, potential surprise sources would include: global terrorism, globalization and integration of production of markets, the explosive rise of economies in Asia (especially China), chronic unemployment, relations between the ‘have’ (developed) and ‘have not’ (developing) nations, consequences of stagnant growth, new methods of energy production, etc. In addition to these global trends, every industry on a high turbulence level would have its own portentous weak signals. For example, the automation of financial institutions and the impact of global integrated production in the automotive industry are weak signals.
Detection of weak signals requires sensitivity as well as expertise on the part of the observers. This means that the detection net must be cast wide, and numerous people involved in addition to the corporate staff charged with managing issues. One source of the detectors are sociopolitical, economic, and technological experts who are outside the firm. Many large firms already have advisory groups which provide weak signal inputs on a systematic basis.
Another source of external weak signals are the individuals (both managers and workers) who serve in the interface functions such as marketing, purchasing, legal, public relations, or R&D. A source of internal weak signals are staff individuals who have broad contacts inside the firm: personnel and management developers, organizational and strategic planners , etc.
*Estimating Impact
The procedure for estimating the impact of threats and opportunities using strong signals was discussed developed in Chapter 19. This approach will be enlarged to accommodate weak signals. It will be recalled from Table 19.4 that when using strong signals, the impact of a trend on the organization can usually be estimated. In the weak signal case, it becomes desirable to estimate the impact SBA by SBA.
The methodology must first recognize the state of knowledge about a trend or event. Then the approach is to provide some latitude in the accuracy of the estimates. On lower levels of knowledge when less is known, trusted judgment or expert opinion techniques such as Delphi can be used. On higher levels of knowledge when more is known, quantitative forecasting and modeling techniques become feasible.
Threat/opportunity weak signal analysis
State of knowledge → | (1) Sense | (2) Source | (3) T/O defined | (4) Response defined | (5) Outcome defined |
|---|---|---|---|---|---|
SBA | % of Profit | ||||
SBA1 | 50 | Threat 1–3 years 0.15–0.40 | |||
SBA2 | 30 | T/O 10–15 years + 0.30 to −0.30 | |||
SBA3 | 15 | Opportunity 1–2 years 0.35–0.40 | |||
SBA4 | 5 | Opportunity 3–7 years 0.08–0.18 | |||
- 1.
Whether it is a threat, opportunity, or both.
- 2.
The time remaining , ranging from high probable estimate to low probable estimate (meaning, in statistical language, a 2-sigma range).
- 3.
The range of impact on profits presently derived from the SBA (again ranging from high probable to low probable). The entries represent the fractions by which the profit will be increased or decreased.
The range of timing and profit impact estimates becomes wider as ignorance increases. Thus, the impact on SBA2 which is ten to fifteen years off may turn either into a threat or an opportunity, but it is clear that the impact is likely to be very serious. Clearly, this discontinuity needs watching closely. On the other hand, the profit estimates for the opportunity in SBA3 can be estimated within a narrow range of both occurrence and impact.
Alternative Response Strategies
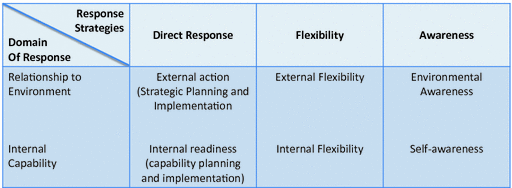
Alternative response strategies
The strongest external action strategy directly acts to counter threats or exploit opportunities. It includes selection of the type of action, preparation of programs and budgets, and implementation. The end result is a threat averted or an opportunity captured in the form of an enhanced potential for future profits.
As discussed in Part III, external direct strategic action must be supported by development of the appropriate internal readiness shown in the lower box under the direct response heading.
The earliest response to a threat or opportunity is offered by the pair of awareness strategies, shown in the right-hand column of the figure. In most firms, a degree of environmental awareness is provided through economic forecasting, sales forecasting, and analysis of competitive behavior. But all of these measures are frequently extrapolative, based on a smooth extension of the past into the future, and do not provide information about strategic discontinuities.
To broaden the awareness to include discontinuities, the firm must add special types of environment analysis, such as environmental monitoring, technological forecasting, sociopolitical forecasting, and SWOT analysis (see Chapter 10).
Starting the awareness activities in the firm does not require concrete information about threats and opportunities . The highest state of ignorance (a sense of threat) is adequate to justify a program for enhancing the firm’s environment awareness. A sense of threat is also adequate for starting many of the self-awareness measures, such as capacity audits, strength/weakness assessments, and financial modeling of the firm.
The flexibility strategy shown in the middle column of Fig. 20.1 differs from the direct action strategies in that its end product is an enhanced responsiveness, rather than tangible changes in profits and growth. The external flexibility sub-strategy is concerned with diversifying the firm in the environment in a way which puts the firm in a position to participate in major opportunities which may arise in turbulent SBAs but also minimizes the impact of catastrophic reversals which may occur in an SBA.
Formulation of the external flexibility strategy is part of the strategic flexibility planning process, where it is usually assumed to require level 5 information input. But measures such as balance of technological, business, and political-geographical risks can be planned and implemented if the state of knowledge is no better than level 2—long before the nature of the threat becomes concrete.
Finally, Internal flexibility is concerned with configuring the resources and capabilities of the firm to permit quick and efficient repositioning to new products and new markets, whenever the need arises. One important element is the flexibility of the managers, including awareness of the environment, psychological readiness to face unpleasant and unfamiliar events, ability to solve unfamiliar problems, and creativity. Another element is the flexibility of the managerial systems and structure to permit quick and efficient response to change. A third element is the flexibility of logistic resources and systems such as resource liquidity, diversification of work skills, modular capacities, and so forth.
Unlike external flexibility, internal flexibility has received relatively little attention from strategic planners . But it can be a crucial ingredient in strategic preparedness. In the area of managerial flexibility, the preparation of managers for strategic thinking and action is now recognized as essential and vital if the firm is to anticipate and deal with the growing turbulence of the environment.
Flexibility of the logistic resources has received even less attention than managerial flexibility. As strategic change accelerates, logistic flexibility will become increasingly important. As with external flexibility, the mere knowledge of the sources of threats and opportunities is sufficient to start a rigorous program of logistic preparedness.
Feasible Responses
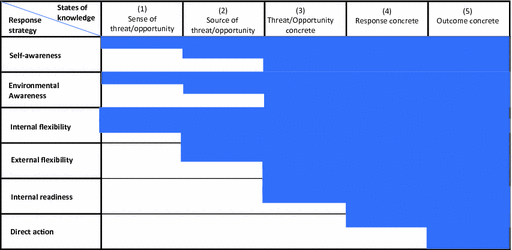
Feasible ranges of response strategies (shaded areas)
As Fig. 20.2 shows, for direct response strategy (bottom rows), it is necessary to have a good idea of the threat or opportunity. But even a sufficiently clear idea of the origin and shape of a threat or opportunity is sufficient to launch a substantial program of internal readiness measures, including acquisition of necessary technological, production, and marketing skills, new product development and development of sources of supply.
Even direct external action need not await information that makes possible reliable cash and profit flow calculations. This is where entrepreneurial risk-takers become differentiated from cautious followers. Adventurous firms will typically launch their entry into a new industry at knowledge level 4, before the technology, market, and competition are well-enough defined to permit such calculations. More conservative firms will prefer to wait on the sidelines until the situation is better defined.
Dynamics of Response
Each of the six response strategies makes a contribution to the organization’s ability to handle strategic discontinuities. Each requires a different length of time for implementation. The total length of time for responding to a specific threat or opportunity depends on the prior preparedness of the firm, the vigor with which the firm responds, and the sequence in which the programs of action are put in place.
Conventional strategic planning proceeds from direct response, to flexibility, to awareness. Figure 20.2 and the preceding discussion suggest the reverse sequence: awareness, to flexibility, to direct response which enables the firm to start response much earlier, and finish earlier, utilizing weak signals.
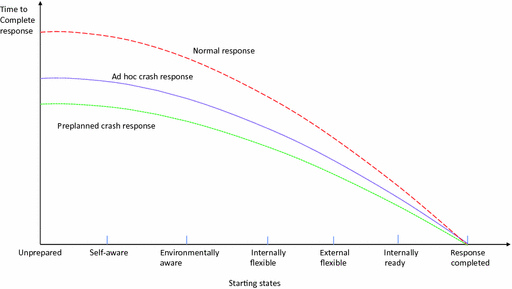
Internal dynamics of response
The upper curve of Fig. 20.3 traces the normal response in which the threat or opportunity is treated routinely by existing processes, structures, systems, and procedures. The lower solid curve, the ad hoc crash response , shows the time savings that can be gained when everything possible is done to speed up the response—normal rules and procedures are suspended, other priorities are pushed into the background, organizational lines are crossed, activities are duplicated, overtime is incurred, and so forth.
The mere ‘pulling out of stops’ is not the only emergency procedure open to the organization. In spite of best efforts to anticipate threats and opportunities , an organization may still expect to be confronted with sudden, fast-developing threats. In this case, investment in a program of training in crisis management is worthwhile. The result will be to lower the response time to the level labeled pre-planned crisis response (see Chapter 2).
The envelope of response times defined by the three curves in Fig. 20.3 will differ among organizations and differ from one threat or opportunity to another. Size, complexity , and rigidity of organization structure will lengthen the response times while the nature of the threat or opportunity will be equally influential. Important factors will be the size of the discontinuity as well as its degree of unfamiliarity. Both of these factors determine the magnitude of the response effort. Next, a procedure is proposed that will translate the theoretical curves of Fig. 20.3 into practical application.
*Preparedness Diagnosis
Table 20.2 indicated that at a given time, the state of knowledge will differ from SBA to SBA. Consequently, the range of possible responses will also differ. Therefore, first step is to determine the feasible responses for each SBA and its threat or opportunity.
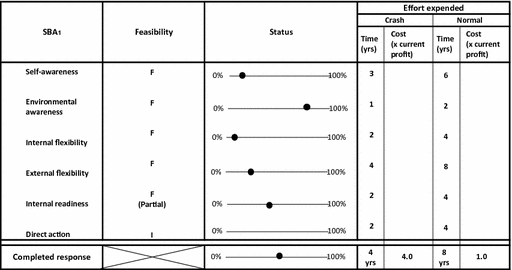
Preparedness diagnosis
The next step is to diagnose the firm’s current state of readiness in each of the feasible strategies. The result is shown in column three of Fig. 20.4. Letting 100% represent the maximum that can be done to respond to the threat or opportunity in the current level of knowledge, the entry is an estimate of the current readiness in each of the categories.
The 15% entry for self-awareness suggests that, while the threat is concrete enough, the organization has done relatively little to determine the usefulness of its own capability for dealing with the threat. On the other hand, the organization appears to be well advanced in understanding the market, the potential competition, and the future.
To continue with the example, the low rating on internal flexibility shows that the firm’s resources and facilities are highly specialized while the slightly higher status for external flexibility indicates that the organization’s profits are largely dependent on current technology and that it is highly threatened by new technology.
The next and critical step in the procedure is to estimate the time the firm will need to move the state of readiness to the 100% level for each of the preparedness categories. The estimate is made for each category for both normal and crash responses. In the last row of Fig. 20.4 a summary estimate is made, looking at four to eight years to achieve a completed response. In our example, this might have meant divesting from the SBA in the old technology, possibly narrowing the firm’s scope to a market in which the old technology will continue to be competitive, or making a successful entry into the new technology line of business.
The final step in readiness diagnosis is to estimate the cost-effectiveness of the total response. The cost of the response is shown in the last row of the figure as a fraction of the percentage of current profits contributed by the SBA. If, as shown in Fig. 20.4, a crash program will cost four times the current profits, and if the response will prevent a loss of 0.15–0.40 of this profit annually (see Table 20.2), the investment will amortize itself in 10–27 years. The cost-effectiveness is low, which suggests that the threat should be written off and allowed to run its course. On the other hand, the normal response (if it turns out to be timely enough) costing 1.0 times current profits will be much more cost-effective, because the amortization period will be only 2.5–7 years.
*Opportunity-Vulnerability Profile
The preceding discussion suggests two conclusions. First, the decision to respond should not be based on response costs alone, nor on the amount of profit loss or gain that is at stake. Rather, it should be based on the return on the costs incurred. We used the simple but useful payback measure of this return. With better data (particularly in the advanced states of knowledge ), other measures can be employed. By doing this, ill-advised spending is avoided, especially when the threat looms large and the temptation is to respond directly, no matter what the costs.
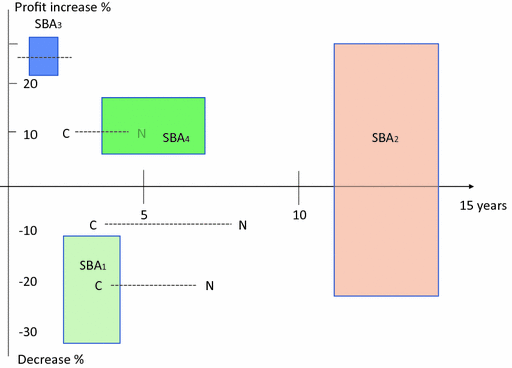
Opportunity/vulnerability profile
The shaded rectangles enclose the regions of probable impact on each SBA. Rectangles below the horizontal axis will result in losses in profitability due to threats; those above the line indicate gains offered by opportunities. The height of the rectangle spans the probable range of gain or loss. The base spans the probable times when impact of the discontinuity will reach critical level. Both dimensions are obtained from the threat and opportunity analysis presented earlier in Table 20.2.
The horizontal, dotted lines in Fig. 20.5 were obtained from the readiness diagnosis (Fig. 20.4). They span the time of probable completion of successful response. Thus, the normal response for SBA3 would be late, but the firm can assure itself of capturing the opportunity through a crash program. SBA2 is safe—normal response will capture the threat or opportunity, provided the firm continues to monitor the development of the contingency. SBA1 is in trouble because even a crash response may be late; it looks like a surprise in the making.
These examples show that timing of the threat does not by itself determine the priority of the respective responses. The priorities are determined in part by the urgency (the difference between the timing of the threat and the time needed for response). In our example, both SBA1 and SBA4 are expected to reach critical impact at about the same time. But because of the longer response time needed, SBA1 must be handled on an all-out crisis response basis, while a moderately urgent response will suffice for SBA4. The priorities are also determined by the potential cost-effectiveness of the responses determined in the manner discussed in the preceding section.
The opportunity profile provides an overall perspective on significant strategic changes in the firm’s future. The firm needs to check the impact of SBA1 because if unchecked, a minimum of 15% and a maximum of 40% of the profit will be lost. Since timely response to this threat will be difficult, either the crash response must be used, or the firm should start a withdrawal from the SBA. The firm must use a crash response to capture the opportunity in SBA3, as an offsetting insurance against possible loss in SBA1. Further, if the firm wishes to capture the attractive opportunity in SBA4, it needs to start right away to avoid a crash response later. Only SBA2 seems to call for no immediate aggressive action. But its potential impact is so great that a vigorous monitoring program should be spotlighted on the development of this trend.
Decision Options
Previously in Fig. 20.5, we saw that priority assignment in strong signal management divides the issues into four categories: no action, continued monitoring, delayed action until the next periodic planning cycle, and immediate action through priority projects.
Weak signal management adds another important option, which we have already explored in Chapters 11 and 14. This is the strategic learning or gradual commitment option under which the firm responds, step-by-step, as the issue progresses to higher states of knowledge .
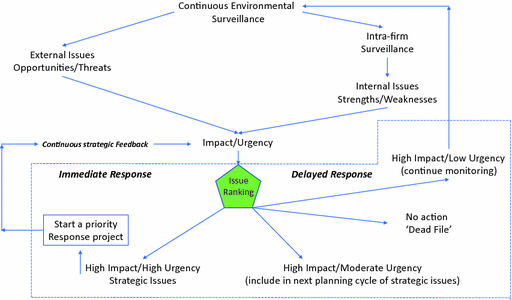
Priority assignment in weak signal SIM
The reader may recall, the process of strategic learning (stepwise response) was covered in more detail in Chapter 5.
*Choice Among Periodic Planning, Strong Signal and Weak Signal Management
As discussed in conjunction with Fig. 20.3, short of a crisis response , there are two modes in which a firm can respond to the environment: the normal response in which the established periodic planning and implementation systems are used, and the ad hoc crash response which crosses established lines and uses ad hoc task forces to produce a rapid response. The time periods required to complete a response in these modes are called normal response time (T) and issue management response time (T1).
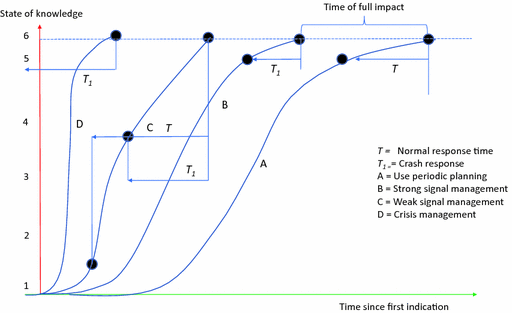
Choosing the system
The horizontal scale is the time which elapses since level 1 awareness has been reached about a threat or opportunity. The figure shows four threats or opportunities which develop at different speeds. Event A is the slowest and event D is the fastest. The arrival of each curve at level 6 is its time of full impact.
The figure shows that the slow curve A arrives at level 5 in time to permit the normal response. In this case, there is no need for an issue management system and the threat or opportunity can be handled by the periodic planning and implementation system.
In the case of curve B, the threat or opportunity arrives at level 5 too late to permit the firm to use the periodic planning system. But the response will be timely if strong signal issue management is used.
Curve C arrives at level 5 too late for strong signal issue management . As the figure shows, the normal response would have to be started between knowledge levels 1 and 2 and issue response at knowledge level 3.5. In this case, a weak signal detection system must be used.
Curve D is a threat or opportunity which is an unavoidable surprise , because even the issue response would have to be started before the sense of impending threat or opportunity (knowledge level l) is perceivable in the environment.
If analysis of future turbulence indicates that significant threats or opportunities are likely to occur which will be faster than the speed of the issue response by the firm, management should give serious consideration to developing a crisis management system.
For mathematically inclined readers, the preceding remarks can be summarized as follows. If we label the time remaining from knowledge level 5 to full impact (level 6) δ, and the time from the inception of threat to full impact F:
If T < δ, use only periodic planning.
If T > δ and T1 < δ, use strong signal issue management .
If T1> δ < F, use weak signal issue management .
If Tl > F, use crisis management.
Summary
When environmental turbulence rises above level 4 (see Chapter 6) important threats and opportunities develop so very fast. If the organization waits until the impact and consequences can be accurately estimated, it will be too late to launch a timely response. In such cases, it becomes necessary to start the response while information is still incomplete. Such partial information is referred to as ‘weak signals.’
Knowledge about each threat or opportunity will progress through several stages: First there is a sense of turbulence in the environment, and then the probable source of the threat or opportunity is identified. At some point, specific threat or opportunity becomes concrete enough to describe, but not sufficiently defined to estimate the full consequences for the organization. At the next stage of knowledge, it becomes possible to develop responses to the threat or opportunity, even though information is still unavailable to estimate the profit consequences. Profit consequences can be estimated at the final stage, but the estimates are still uncertain, which means that a probability must be assigned. Eventually certainty is reached, when the impact of the threat or opportunity has been reflected in the firm’s performance.
Managing by weak signals requires that the individuals involved in detecting signals are sensitized and trained to be open to a wide range of incoming data. In addition, the detected signals must be classified according to their state of knowledge, and best possible estimates made of their probable impact and timing. The lower the level of knowledge, the wider will be the range of impact and timing estimates.
At each stage of knowledge, weak signal responses are possible which progressively prepare the organization to deal with the threat or opportunity. The advantage of taking early action is that it permits the organization to make timely responses which would be missed if the firm were to wait for them to become fully developed.
In addition to starting early, the organization can improve its timeliness by using special task forces.
The choice of whether and how to respond should be determined by comparing the timing of the threat or opportunity versus the time required for the response. Also, the gain to the firm by responding should be compared to the cost of making the response.
Weak signal management is one of three alternatives for dealing with threats and opportunities . The others are strong signal management and periodic planning. The choice of the systems to be used is determined by speed of threats and opportunities , as compared to the speed of response of each system. When the threat or opportunity speed becomes too high for periodic planning , strong signal issue management should be added. When strong signal issue management becomes too slow, it should be replaced by weak signal issue management .
Exercises
- 1.
You are a member of the corporate planning staff in a large diversified pharmaceutical company. The V.P. of Planning says to you: ‘As a result of the Tylenol crisis, I am convinced that we should introduce weak signal issue management . But this cannot be done unless the top management committee is sufficiently convinced of its possible advantages to devote its time to managing the system. Will you please prepare a 30-minute briefing to be presented to the management committee which will explain in clear terms what weak signal issue management is, why should it be used in our firm, how should it be used, what benefits will it bring about?’ Your assignment is to prepare a series of briefing charts and a text which will accompany them.
- 2.
Your briefing has been well accepted, and the management committee now wants to know how the system is to be put in place, who should be involved, how it will run, what it will cost, what problems are likely to be encountered, how long it will take to put in place. Your assignment is to prepare a plan for introducing the system into the firm which will answer all of these questions.
- 3.
Develop a list of the five most important weak signals which should be considered by the firms in the following industries:
Pharmaceuticals
Steel
Banking
Health
Education
Information Systems.
- 4.
For each of the chosen industries, prepare an opportunity/vulnerability profile , using the format of Fig. 20.5.