• • • •
Making either/or decisions about things is a hallmark of organisms on our planet. Some scientists believe that this dichotomous way organisms have of making important decisions is a result of natural selection. If you do not categorize something as dangerous, you get eaten; if you do not categorize something as food, you starve; if you do not categorize something as a potential mate, you do not reproduce. While this is clearly an oversimplification, we do have to admit that our human view of the world is a very dichotomous one. Understanding the structure of populations is no exception; and indeed, as we saw in chapter 3, one of the classic ways of thinking about the way organisms are organized on our planet is through the branching diagrams we call phylogenetic trees. When you make any decision such as “if a group of things isn’t this, then it has to be that,” you are simply creating a dichotomous branch in a phylogenetic tree.
At the species level this procedure is called “phylogeography.” Among other things, phylogeographic studies often test the hypothesis that individuals from different geographic regions, or individuals grouped according to some other criterion, have a common ancestor to the exclusion of all other individuals being considered. This phenomenon is called “reciprocal monophyly,” and the assumption is that the reciprocally monophyletic groups are separated in some biologically meaningful way. On the face of it, this approach is very objective and operational; all you need is a lot of information from large numbers of individuals in the putative groups you want to test. The tree generated from the data then supplies the proof of the pudding. But nothing is ever that easy.
The first DNA-based data sets used to examine the genetic or biological basis of human races came from single linkage groups, such as mtDNA and the Y chromosome. But while trees constructed from these clonal markers are interesting in that they trace maternal and paternal lineages and are quite well resolved, as we pointed out in chapter 3 the bigger picture still needs to be kept in mind. Because while there will always be some general similarities between the maternal and paternal patterns of divergence within a species, they will also be at odds or incongruent with each other in many respects. This incongruence is difficult to reconcile; and indeed, there is no reason in principle to expect the patterns of divergence from the two linkage systems to agree. As we showed with Darwin’s paternal phylogeny and maternal phylogeny in chapter 7, each has its own independent history.
The addition of whole genome–level information to the study of human genetics introduces additional massive complications, because now every linkage group in the human genome will have its own evolutionary history. How best to deal with this problem is controversial; but we will show in this chapter that any of the tree-based ways that are normally used will always result in unresolved trees, or in trees that make little sense with respect to any presupposed racial boundaries. To deliver the punch line right at the start, using reciprocal monophyly as a criterion for testing hypotheses about human races is a dead end.
The fact that different genes, chromosomes, and genomes have distinct evolutionary mechanisms and histories (are incongruent) is one of the reasons why tree-based analyses do not agree with methods that use a reticulate model. Two trees are incongruent when they do not agree in the phylogenetic inferences they yield, and there may be differing degrees of incongruence. Several tests have thus been proposed to determine the statistical significance of any incongruence observed between two trees and have showed just how pervasive incongruence is. One review of incongruence among alternative trees for diploid eukaryotic organisms revealed that between 22 percent and 50 percent of the single genes in a genome were incongruent with the taxonomically accepted topology for the species concerned. In one study of (very closely related) subspecies in the mouse species Mus musculus, only 33.3 percent of the genes analyzed agreed in their topology with the accepted genealogy for the subspecies. A further 33.3 percent agreed with a second topology, and the final 33.3 percent agreed with a third one. Effectively, this data set gave a random inference with respect to the accepted relationships.
The most obvious example of incongruence we have discussed so far involves the clonally inherited genes of mtDNA and the Y chromosome, which evolve without recombination. Because they do not recombine in each generation, the inferences made in the literature using these markers give well-resolved trees that are interpretable individually as histories of the markers involved. On the other hand, trees can be generated for each of the twenty thousand or so individual genes in the human genome, and some of them would also be resolved. But because of recombination and the lack of clonality of the individual genes, such trees will merely represent the history of each gene—recombination and all. If enough genomes are included as terminals in separate phylogenetic analysis of all the genes in the human genome (and the 1000 Genomes Project has sequenced more than two thousand of them), the probability that any two genes out of our twenty thousand or so genes would yield the same tree is extremely small, if not zero. This incongruence does not mean that gene trees, or the information from discrete gene regions, cannot be used to generate species trees; but at the infraspecies level the procedure would clearly be uninformative at best.
The problem of incongruence among gene trees is largely related to coalescent theory. Coalescent theory suggests that, even if there is a strong and irrefutable species tree, individual gene trees have a high likelihood of being incompatible. This observation suggests two very important things about gene trees and species trees. First, there is a basic theoretical and functional difference between a gene tree and a species tree. Second, the problem of unraveling the history of population divergence becomes one of inferring population or species trees from gene trees. One solution to the resulting problem of inference is just to ignore it and treat all the data as a single linkage group, concatenating the data to produce the phylogenetic tree. This strategy has a theoretical basis that hinges on hidden information in unlinked chunks of DNA. The idea is that two different chunks of DNA may give different trees, but there will be information in one that supports the other, and vice versa. So how do you know which is the better tree? The solution is to combine all the data and allow the overall signal in the data to emerge. It often turns out that neither tree is part of the best solution, so yet another tree is generated by this concatenated approach. An alternative solution uses coalescent analysis of multiple gene trees to come to a phylogenetic hypothesis, since it has been suggested that coalescent methods can extract the patterns supported by certain genes to give an overall phylogenetic hypothesis for a data set. But these approaches, too, have often been criticized as inaccurate indicators of the overall phylogenetic signals of organisms.
It has been our experience that, whatever approach you use for the human genome data, the trees generated are terribly unresolved. What is more, they never reflect preconceived “racial” or established geographical boundaries. Purely for the sake of argument, we will discuss the results using the concatenation approach. In a recent study one of us used phase 2 data from the 1000 Genomes Project for more than five hundred human males, employing mtDNA, Y-chromosome DNA, X-chromosome DNA, and chromosome 20 DNA. The reason males were used is that only males have Y chromosomes, so we could be sure that every individual in the study had been sequenced for all of the markers. Figure 11.1 (top) shows the phylogenetic trees obtained for the two clonal markers.
While there is some interesting structure to these trees, that structure basically mirrors what we have already shown for mtDNA and Y-chromosome DNA. The African lineages shown in black in the figure (see plate 9) are generally at the base of each tree, indicating that all human Y chromosomes and mtDNA diverged after humans left Africa. Close examination of the two trees indicates that there are no instances of reciprocal monophyly. One geographic group that does border on reciprocal monophyly is the Asian Y chromosomes; but this can be explained by a specific problem that phase 2 of the 1000 Genomes Project had with samples from people of Asian ancestry. This resided in the fact that the Asian lineages used are all very closely related to one another, whereas the African, European, and Amerindian lineages are more deeply divergent.
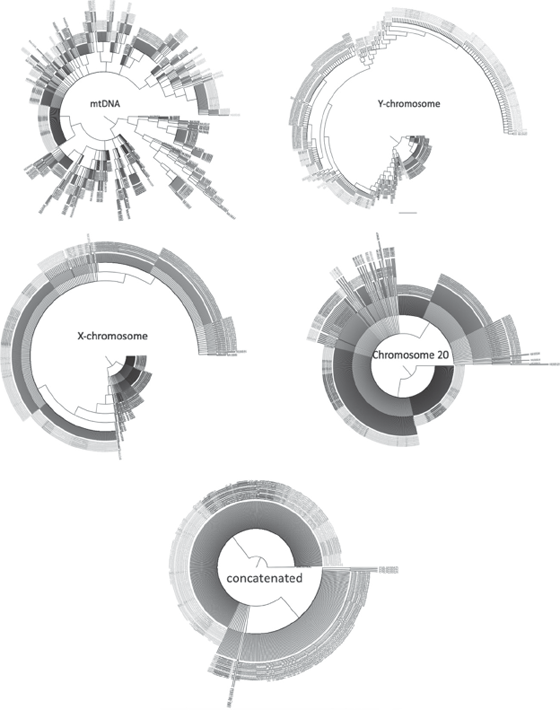
Figure 11.1 Phylogenetic trees generated from the single linkage group clonal DNA (top), recombining genetic blocks (middle), and concatenated data (bottom), all rooted with chimpanzee. The colors represent different geographic origins for the men in the analysis. Blue, Africa; red, Asia; green, Europe; orange, Amerindian. See plate 9.
If you think clonal genes are messy, then prepare yourself for an even bigger mess with recombining genetic blocks like chromosome 20 and the X chromosome (figure 11.1, middle). Reciprocal monophyly is nonexistent in these two trees (again, except for men of Asian descent) for recombining genomic elements. When all the data are concatenated, the tree in figure 11.1 (bottom) is obtained. Again, the only reciprocally monophyletic assemblage is the Asian one; but given the close affinity of the individuals from this geographic region, it is not surprising that they form a monophyletic group.
It should be clear that using the criterion of reciprocal monophyly produces no clear delineation of human males into groups and that the one exception is a sampling artifact in the data set from phase 2 of the 1000 Genomes Project. We would also predict that the picture will get even messier as more individuals are added to the analysis; it is a general characteristic of phylogenetic analyses that as the number of terminals added to a data set increases, the messier the structure of the tree will become. The addition of more and more variable genomes with different signals inevitably leads to decreasing resolution. Fair enough. But what if we simply reduce the amount of DNA in the analysis? Well, as we pointed out with ascertainment bias, trimming the data set will probably lead to better resolution in the tree; but while trimming can lead to cleaner groupings, it will also produce an unnatural answer to the initial problem.
By way of illustration, take the data set we presented in figure 8.3, and use only those SNPs that agree with the geographic grouping of the data. This is an extreme form of ascertainment bias that is directly related to the search for the ancestral informative markers (AIMs) we discussed in chapter 8 in the context of an example involving European populations. To recap, here is how AIMs are selected: sequences from people whom you think belong to different groups or “races” are lined up, and then scanned to find positions that are fixed and different in the various groups; that is, they diagnose those groups. Figure 8.3 shows this process and points to the determination of four AIMs, one diagnostic for each of the four groups. These AIMs are “pure” diagnostics, as there is complete fixation and differentiation of the AIM from one group to the next. In the real world, an AIM might not be completely fixed—although to be informative in any way it would have to be very close to fixation.
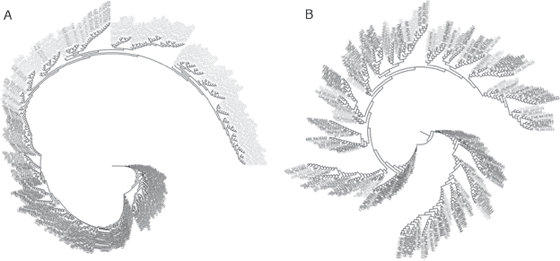
Figure 11.2 Phylogenetic analysis of AIMs (A) and anti-AIMs (B). See plate 10.
If we take AIMs as thus determined, and use only those SNPs to construct an evolutionary tree, we get an unsurprising result. When all the SNPs are concatenated together, a tree that looks as if it has monophyletic groups will be obtained (figure 11.2, left). But we have actually tricked ourselves into thinking this is a valid conclusion. For if we take the SNPs in the data set that are the least like AIMs and use them to make a phylogenetic tree, we will get the tree shown on the right side in figure 11.2—from which it is evident that the extreme ascertainment strategy used in AIMs is misleading. To put it bluntly, it is based on circular reasoning. If you select markers that are fixed and different for a phylogenetic analysis, you will get the tree you want, because you have selected the data to fit your hypothesis. And as we will see in the next chapter, when other approaches such as clustering are used to analyze genome-level data for humans, similar problems arise.
Quite apart from the lack of resolution in these trees, and their inability to recover monophyletic groups that represent geographic races, there are strong theoretical reasons why building trees is not a valid approach for testing hypotheses about race. Early in the development of phylogenetic tree-building methods, Willi Hennig famously challenged the notion that trees could be used indiscriminately, using a figure that pinpointed the problems inherent in using tree-based approaches to describe biological systems (like species) that reticulate. (“Reticulation” is a word applied to branching diagrams in which there is connection among the lineages. In biological terms, it refers to interbreeding.) The level of biological organization that Hennig was concerned about in connection with reticulation is the level at which species form. In Hennig’s view (and in line with the biological species concept, for that matter), before speciation, organisms of two populations will successfully interbreed with each other; afterward, they will not. Once there is a cessation of genetic contact, proxies for lack of interbreeding can be used to characterize the populations. But not before. It is difficult to deny that members of our species reticulate, which is of course what makes Hennig’s ruminations so relevant here.
Systematics and population genetics both rely on distinct but equally entrenched ontologies and thus are completely different scientific “animals.” In population genetics, the established laws of heredity are used to make evolutionary inferences from observations of populations. This is a deterministic approach that relies on the continuity of the evolutionary process, and its goal is to explain and detail the origin and subsequent maintenance of genetic diversity at the population level. Systematics, on the other hand, attempts to discover and describe the intricacies evident in the hierarchical pattern of life on this planet. This discipline is not a deterministic endeavor, but is rather a purely historical one. As Andrew Brower and colleagues suggest, “Systematics seeks to document hierarchical patterns among disjunct entities and needs to postulate little except that a tree-like hierarchy exists and is recoverable by studying attributes of individual organisms.” This view has led to the suggestion that a “line of death” exists at this level of biological analysis. And indeed, the results of the phylogenetic analysis of SNP data in this chapter demonstrate some aspects of this line of death. One of the results of this unique boundary between population genetics and systematics, and of analyzing that slice in time when that boundary—speciation—occurs, is “Woodger’s paradox.”
John Woodger was a biologist who suggested in the mid-twentieth century that isolation as a criterion for speciation posed a paradox. Specifically, he claimed that, at the point during the speciation process at which divergence happens, a mother would have to be placed in species X, while her daughters would be in species Y. And the nature of species is such that a parent belonging to species X cannot give rise to offspring belonging to species Y. But there is, of course, a huge problem with Woodger’s paradox. It makes two assumptions, each of which is fine in and of itself, but which in combination are lethal. The first assumption is that an individual cannot belong to two species; and the second is that the placement of an individual into a specific species is immutable with time. This led Woodger to view speciation—the emergence of new species that is an essential component in the diversification of life—as the drawing of a line between two successive generations and the result of some radical biological event. This leads to a view of speciation as a virtually instantaneous phenomenon, and one that is immutable with respect to time. Yet whatever it may consist of in any specific instance, speciation—a woefully poorly understood process or set of processes—clearly does not work like this. Time is an essential ingredient in speciation, and the emergence of reproductive incompatibility between two physically separated but nonetheless closely related populations can take quite a while—as evidenced, for example, by that putative hybridization between Neanderthals and modern humans. Accordingly, Woodger’s basic assumptions about speciation were not optimal. His problem was that he attempted to understand speciation from one single perspective: that of population genetics. But when you hit that line of death, population genetics no longer works, and Woodger’s conclusion is hugely problematic.
If we accept the argument about interbreeding populations, then we should eliminate trees as a valid way of representing reticulating individuals within a population. So although this does not necessarily mean that trees won’t be useful at this level for other endeavors, we have to reject trees in the context of trying to understand human races. Unfortunately, however, even when researchers recognize this important limitation of trees in principle, they often continue to use them anyway. Why is this? The statistician J. C. Gower had a good answer in 1972: ‘‘the human mind distinguishes between different groups because there are correlated characters within the postulated groups’’. The underlying correlation of data that Gower mentions, and that so much beguiles us, brings us to clustering methodologies and to how researchers have used this approach to address biological race.