2.4 What Shifts Demand Curves?
So far, we’ve analyzed how the quantity demanded varies with the price of a good, holding other things constant. We’ve used three of the four core principles—the opportunity cost principle, the cost-benefit principle, and the marginal principle—to uncover some powerful ideas about demand, such as the Rational Rule for Buyers.
But what happens when factors other than the price change? For that, we’re going to need to bring in the fourth principle.
The Interdependence Principle and Shifting Demand Curves
The interdependence principle reminds you that a buyer’s best choice also depends on many other factors beyond price, and when these other factors change, so might their demand decisions. For instance, the quantity of gas you’ll buy (at any given price) might change when you get a pay raise, the amount of traffic increases, or the price of alternatives such as catching the bus falls. When you’re no longer holding these other things constant, the demand curve may shift. When the demand curve itself moves, we refer to it as a shift in the demand curve. Because your demand curve is also your marginal benefit curve, any factor that changes your marginal benefits will shift your demand curve.
As Figure 8 illustrates, a rightward shift is an increase in demand, because at each and every price, the quantity demanded is higher. A leftward shift is a decrease in demand, because the quantity demanded is lower at each and every price.
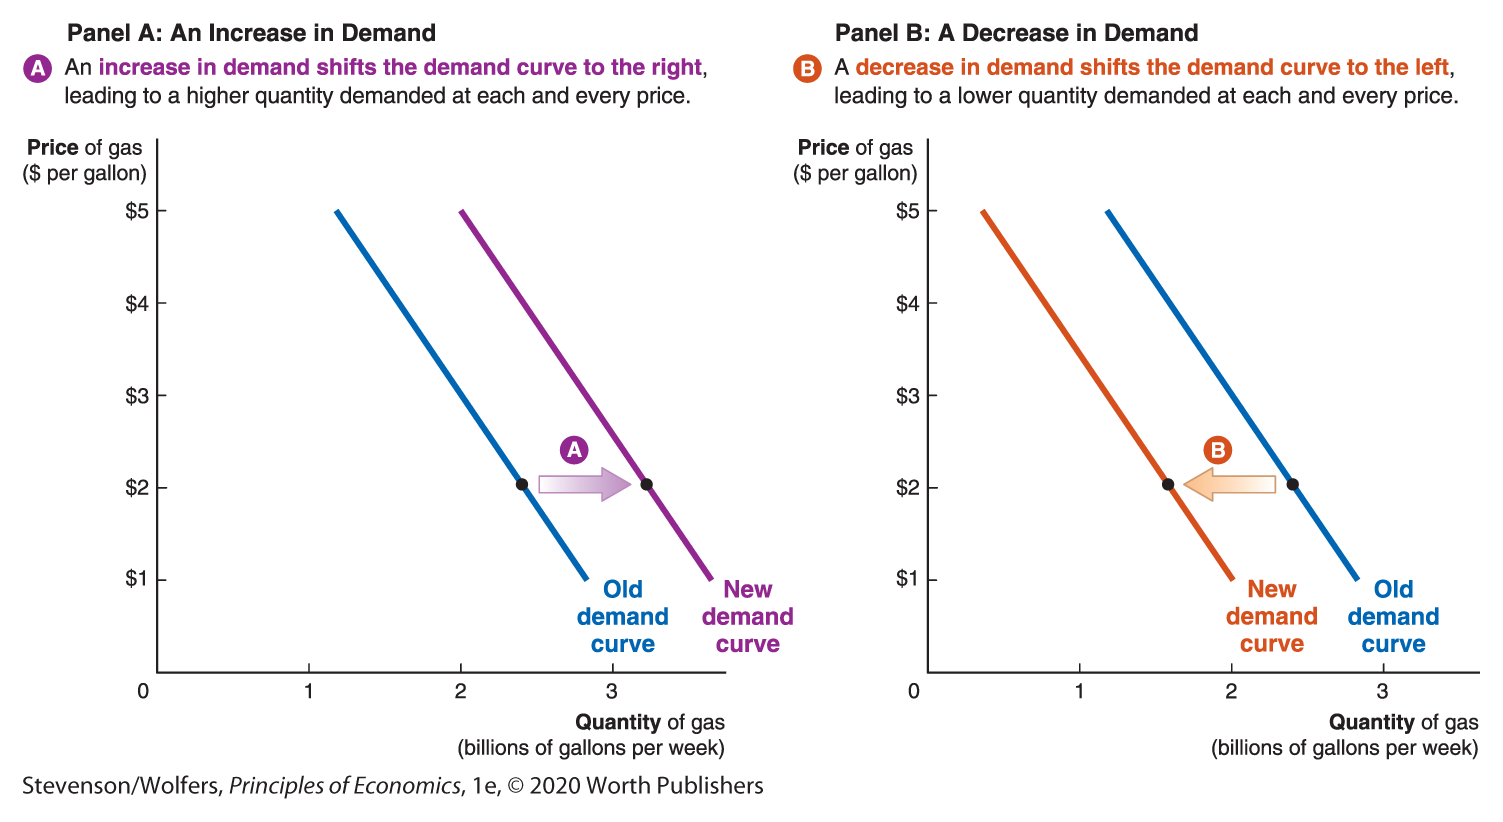
Figure 8 | Shifts in the Demand Curve
Six Factors Shifting the Demand Curve
The interdependence principle reminds you that buying choices depend on many other factors, and when those other factors shift, so will people’s buying plans, thereby shifting the demand curve. But what are these other factors? They are:
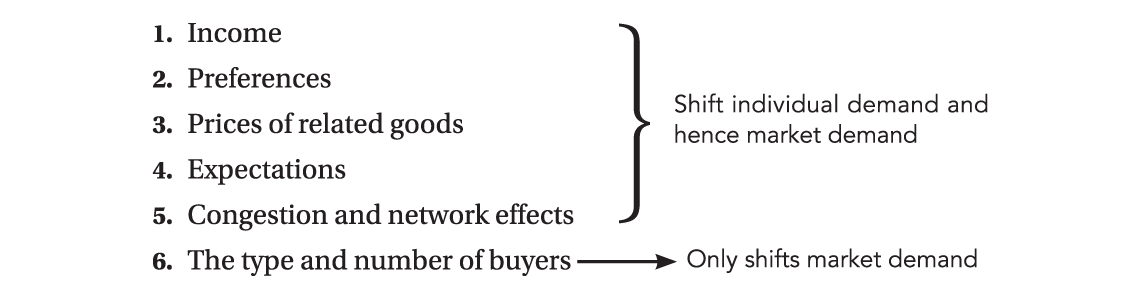
Changes in any of the first five of these factors shift individual demand curves, and because the market demand curve is built up from individual demand curves, they shift the market demand curve. The final factor—the type and number of buyers—only shifts market demand curves.
Let’s now evaluate how each of these six factors can lead to a shift in demand.
Demand shifter one: Income.
All of your individual choices are interdependent, since you only have a limited amount of income to spend. Money you spend on gas is money that you can’t spend on clothes. But when your income is higher, you can afford to buy a larger quantity of both. Thus, at each and every price level, you can buy a larger quantity of gas (and clothes), causing your demand curve to shift to the right—which we call an increase in demand. If your income were to fall, then you would probably choose to buy less gas at each and every price, shifting your demand curve to the left—and that’s called a decrease in demand.
If your demand for a good increases when your income is higher, we call it a normal good. Most goods are normal goods. But there are also exceptions, called inferior goods, where demand decreases when income rises. “Inferior” goods aren’t bad; they’re simply those goods you buy less of when your income is higher. For instance, when you’re in college and struggling with a limited income, you might take the bus a lot, but when you get your first full-time job, you might buy your own car. Since the higher income in your first job reduced your demand for bus rides, we conclude that bus rides are an inferior good. Typically, inferior goods are those where you’re “making do,” and when your income rises, you’ll switch to a higher-quality but more expensive alternative, instead.

An inferior good that provides superior comfort.
Can you think of other examples of normal and inferior goods? One simple trick is to think about how your buying patterns will change when you start earning a lot more money. Try it; it’s fun! Personally, I’ve noticed that as my income has risen, I eat more restaurant meals but less fast food; I take more vacations using airplanes and fewer vacations using my car; and leather jackets have replaced hoodies in my wardrobe. Hence, for me restaurant meals, air travel, and leather jackets are normal goods, but fast food, driving vacations, and hoodies are inferior.
Interpreting the DATA
Which retailers do well in a recession?
The distinction between normal and inferior goods can be pretty useful in practice. For instance, economists studying retail stores have found that rising income led to more purchases at Target and fewer at Walmart. Somewhat cheekily (but entirely accurately) they concluded that “shopping at Target is perfectly normal, but shopping at Walmart is not.”
The fact that Walmart sells inferior goods (in the economist’s sense) is not necessarily bad news for Walmart: During the 2008–2009 recession, average income fell. This boosted demand for goods from Walmart because Walmart sells a lot of inferior goods. Meanwhile, Target, which sells mainly normal goods, experienced a decrease in demand. Figure 9 shows that the recession, which increased the demand for Walmart’s goods, led its stock price to rise, while the decrease in demand for Target’s goods led the value of its stock to fall by about 40%.

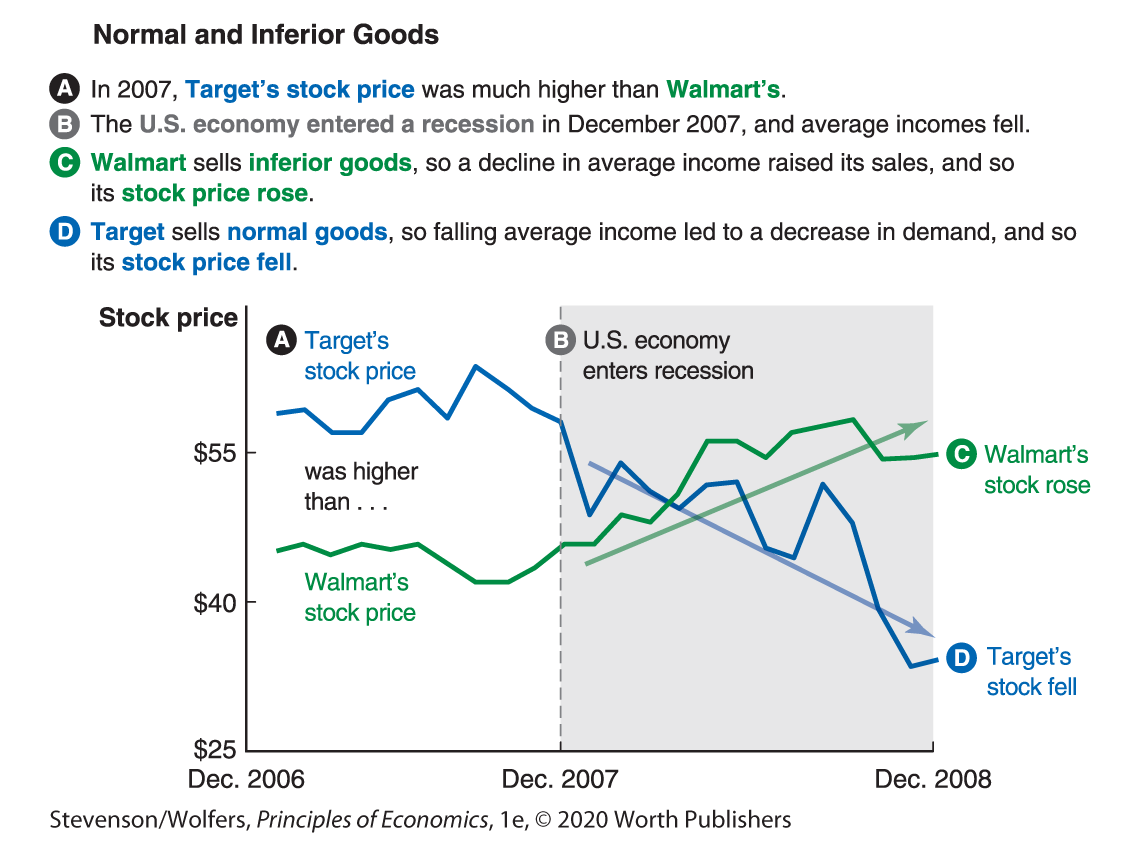
Figure 9 | Normal and Inferior Goods
Demand shifter two: Your preferences.
Changes in your preferences can shift your demand curve. What if Darren had a baby? His entire consumption bundle might change as he considered his new needs. Would he want to drive to work more so that he could rush home if the baby got sick? Or would he take the bus more so that he could enjoy a few minutes of rest? In fact, there are large numbers of marketers trying to figure out how to take advantage of the changes in people’s demand due to life events like getting married or having a baby.

New phone? You’re probably going to buy a new case, too.
Companies spend billions of dollars each year attempting to influence our preferences through advertising. If Pepsi somehow convinces you that it’s better than Coke, this will increase your demand for Pepsi and decrease your demand for Coke. Social pressure can also shift your demand curve. For instance, rising environmental awareness has decreased demand for gas-guzzlers (farewell, Hummer), shifting the demand curve to the left. Preferences are also affected by fashion cycles, such as the fads that increased demand for Ugg boots and Crocs in the early 2000s, thereby shifting demand curves to the right. Of course when people came to their senses and these fads ended, demand fell, and the curve shifted to the left!
Demand shifter three: Prices of related goods.
Your choices are also interdependent across different goods. For instance, your demand for hot dogs is closely related to your demand for hot dog buns. If the price of hot dog buns rises, you’ll buy fewer hot dog buns and fewer hot dogs. Consequently, the higher cost of hot dog buns causes a decrease in your demand for hot dogs, shifting your demand curve for hot dogs to the left. When the higher price of one good decreases your demand for another good, we call them complementary goods. Typically, complementary goods “go well together.” That is, a hot dog bun is a complement to a hot dog, just like a new case is a complement to your new smartphone. Similarly, cars are a complement to gas because you need both gas and a car to drive, and so cheaper cars lead more people to drive, and this increases the demand for gas, shifting the demand curve to the right.
In contrast, substitute goods replace each other. Walking, cycling, ride-sharing, or catching the bus are all substitutes for driving. If the price of bus tickets doubles, you might start driving to work instead of catching the bus, increasing your demand for gas. Your demand for any good will increase if the price of its substitutes rises. (And your demand will decrease if the price of substitutes falls.)
EVERYDAY Economics
How you can have an influence—indirectly
If you think about substitutes and complements, you sometimes can influence things that are otherwise out of your direct control. For instance, your parents might want you to spend more time studying, but feel powerless to make you do this. However, crafty parents encourage studying by encouraging complements to studying and discouraging substitutes. And so parents often help their kids pay for textbooks, laptops, and desk chairs (complements to studying), but not parties or video games (which are substitutes for study).
Likewise, employers want their workers to focus at work, so they strategically provide free coffee, which is a complement to focused work, and they often block access to Facebook, which is a substitute.
Or think about gifts between significant others on Valentine’s Day. Fancy dinners are a common gift, but a membership to an online dating site is less common. Think you can explain this in terms of complements and substitutes?
Demand shifter four: Expectations.
As a consumer, you get to choose not only what to buy, but also when to buy it. Your choices are linked through time. This simple insight can help you save money, and along the way, shift your demand curves. Think about your reaction when you drive past a gas station charging exorbitantly high prices. If you believe that this high price is only temporary, you might put off filling your tank for a few days, decreasing today’s demand for gas. Conversely, if you believe gas prices are going to rise further, you should probably fill up right away, increasing today’s demand. That is, your expectations about future gas prices can shift your demand curve to the left or to the right.
This insight is really an example of the logic of substitutes: Gas purchased tomorrow is a substitute for gas purchased today, and a higher price for this substitute increases demand for gas purchased today, while a lower price decreases it.
EVERYDAY Economics
How thinking about the future saves you money
Uber’s surge-pricing feature generates a lot of controversy. It automatically boosts the price of a ride so that it’ll be two or three times higher during peak hours, as an incentive to get more drivers on the road. Some riders work around this and save some money by planning their day a bit more carefully. Instead of calling for a ride during a peak period—say, straight after a concert gets out—you could hang out with your friends for a bit and get a ride home an hour later, when the rush is over and the price has returned to normal.
Notice what’s happening here: Your expectations about a lower price later tonight leads to a decline in your demand for Ubers right now. That’s because a ride home later tonight is a substitute for a ride home right now, and a lower price of the substitute decreases your demand. It’s an example of a more general idea: You can save a few bucks by making sure you think about future prices before you buy.
Demand shifter five: Congestion and network effects.
The usefulness of some products—and hence your demand for them—is also shaped by the choices that other people make. Think about social-networking websites. Many American college students use Facebook, Instagram, or Snapchat, but in China, WeChat is the most popular social media platform. This is an example of a network effect—where a product or service becomes more useful to you as more people use it. If a product is more useful, it yields greater marginal benefits, increasing your demand. Network effects have important business implications: Signing up a few early adopters makes your product more valuable to other customers, increasing the demand for your product, leading more customers to adopt the product, and making it even more valuable again. In these markets, winning the early rounds of competition is critical to your business’s long-run success.

Love it or hate it? Depends on who else is using it.
By contrast, some products become less valuable when more people use them, and this reverse case is called a congestion effect. For example, your demand for driving on a particular road declines if many others are also using that road, since more cars create congestion and traffic. Likewise, your demand for a particular formal dress might decrease if someone else is wearing it.
EVERYDAY Economics
What determines the language we speak, the computer programs we use, and the cars we drive?
Network and congestion effects are everywhere. For instance, while you have probably complained about Microsoft Word, many college students still use it, mainly to ensure that they can share files with others. Or think about the demand for learning languages. Most American schools teach English rather than Portuguese. This isn’t because English is the more beautiful language; it is simply the most useful language, given that most people in the United States speak English. In Brazil, the reverse occurs.
The types of cars that people buy are also interdependent. City-dwellers sometimes buy SUVs, but not because they plan to go off-road driving. Instead, they worry that because there are so many other large cars on the road, they now need to drive a large car to stand a reasonable chance of surviving an accident. Thus, the choices made by other people in the United States increase your demand for Facebook, Microsoft Word, large cars, and learning English, but decrease your demand for WeChat, Open Office, learning Portuguese, and compact cars.
Demand shifter six: Type and number of buyers.
So far, we have analyzed the five factors that shift individual demand curves. Because market demand is the sum of individual demand, each of the factors that shift individual demand also shift market demand. In addition, if the composition of the market changes through demographic composition or type of buyers in the market, then market demand will also change. For instance, the baby boom that followed World War II initially led to an increase in the demand for baby clothes. As this cohort progressed through their lives, there was an increase in the demand for schoolbooks, then for college education, and subsequently for houses, cars, and child care. Over the next decade, these aging Baby Boomers will cause demand for health care and nursing homes to rise. But there’s also another sizable cohort—the “Millennials” who are in their 20s and 30s and just starting their careers and their preferences and life stages will shape market demand in the United States.
Additionally, market demand is shaped by the number of buyers. If the number of potential buyers rises then there are more individual demand curves to add up when calculating market demand. Thus, an increase in the number of potential buyers shifts the market demand curve to the right. Over short periods of time, increases in population are relatively unimportant, as the U.S. population grows by only about 1% each year. But over longer periods, this can add up. The U.S. population has more than doubled since 1950, and this alone has doubled the quantity demanded in most markets. The U.S. population is expected to increase by nearly a third between 2016 and 2060. The dependence of demand curves on market size partly explains why many business owners are in favor of increased immigration: More people means increased demand for their firm’s products.
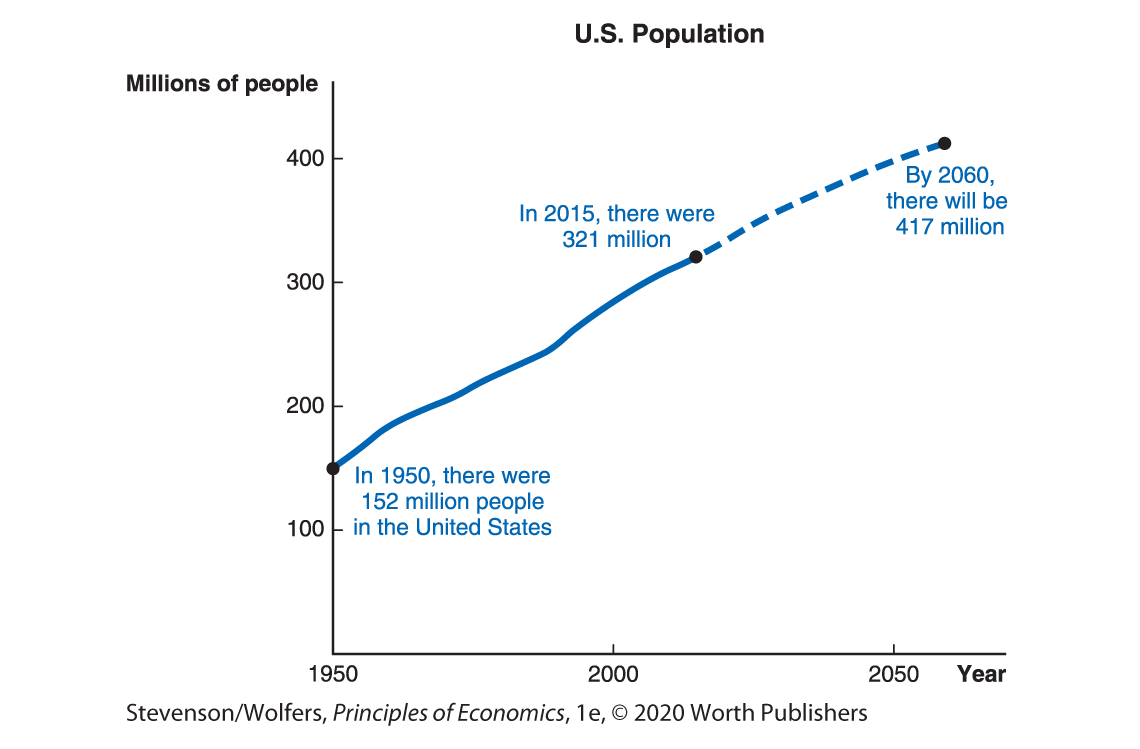
Data from: U.S. Census Bureau.
Another critical factor increasing market size is international trade and the opening of new foreign markets. For instance, the opening of the Chinese economy means that there are now more than one billion Chinese consumers for exporters to serve, which potentially represents an enormous shift in demand.
Recap: When things other than price change, your demand curve may shift.
To recap, changes in market conditions affect your demand decisions. These changes reflect the interdependence principle at work: Your best choices depend on many factors, and when these factors change, so will your best buying decisions. The five factors that shift individual demand curves—your income, your preferences, the prices of other goods, your expectations, and network and congestion effects—are all factors that can change your marginal benefit. Because your marginal benefit curve is your demand curve, shifts in these factors can shift your demand curve. Keep these factors in mind as we now turn to reviewing the distinction between movements along the demand curve versus shifts of the demand curve.