Key Concepts
Discussion and Review Questions
Learning Objective 6.1 Assess how taxes shape supply, demand, and equilibrium outcomes.
You are planning a summer vacation and are about to book a hotel room online for $149 a night. However, when you get to the reservation screen, you are informed that you will be charged an additional $30 a night in various taxes that you have to pay to the hotel. Between you and the hotel, who do you think is carrying the larger share of the economic burden of the taxes? What ultimately determines whether you or the hotel bear the majority of the economic burden?
Learning Objective 6.2 Evaluate the full set of consequences of price ceilings and price floors.
Provide a real-world example of a price ceiling. How could the price ceiling result in a shortage?
Provide a real-world example of a price floor. How could the price floor result in a surplus?
Learning Objective 6.3 Analyze the consequences of quantity regulations.
Provide a real-world example of a quantity regulation. Under what circumstances will it impact market outcomes?
Study Problems
Learning Objective 6.1 Assess how taxes shape supply, demand, and equilibrium outcomes.
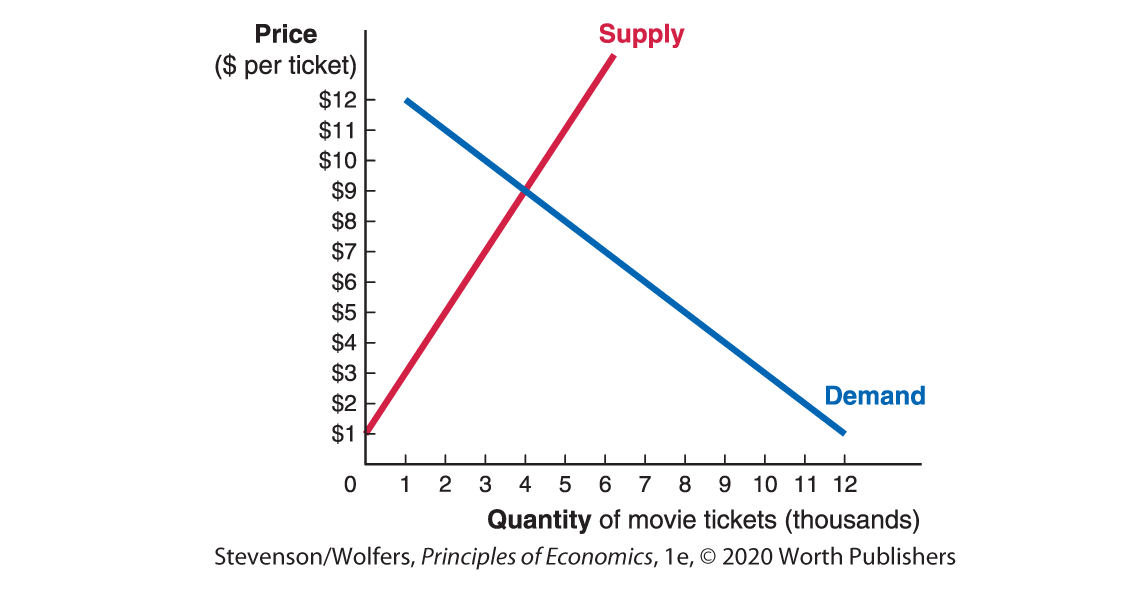
Consider the market for movie theater tickets shown in the accompanying graph. What is the equilibrium price and quantity? Illustrate graphically what happens to the supply curve if the government imposes a $2 per ticket tax on movie theaters. Identify the amount consumers now pay for a ticket and the amount movie theaters get to keep. How is the economic burden shared?
Show on the graph what happens if instead the government imposes a $2 per ticket tax on movie goers. Identify the amount consumers now pay for a ticket and the amount movie theaters get to keep. How is the economic burden shared? Compare your answer from when the statutory burden was on movie theaters. What impact does the statutory burden of a tax have on the tax incidence? Who bears the economic burden and why?
The U.S. government provides subsidies for a variety of agricultural products.
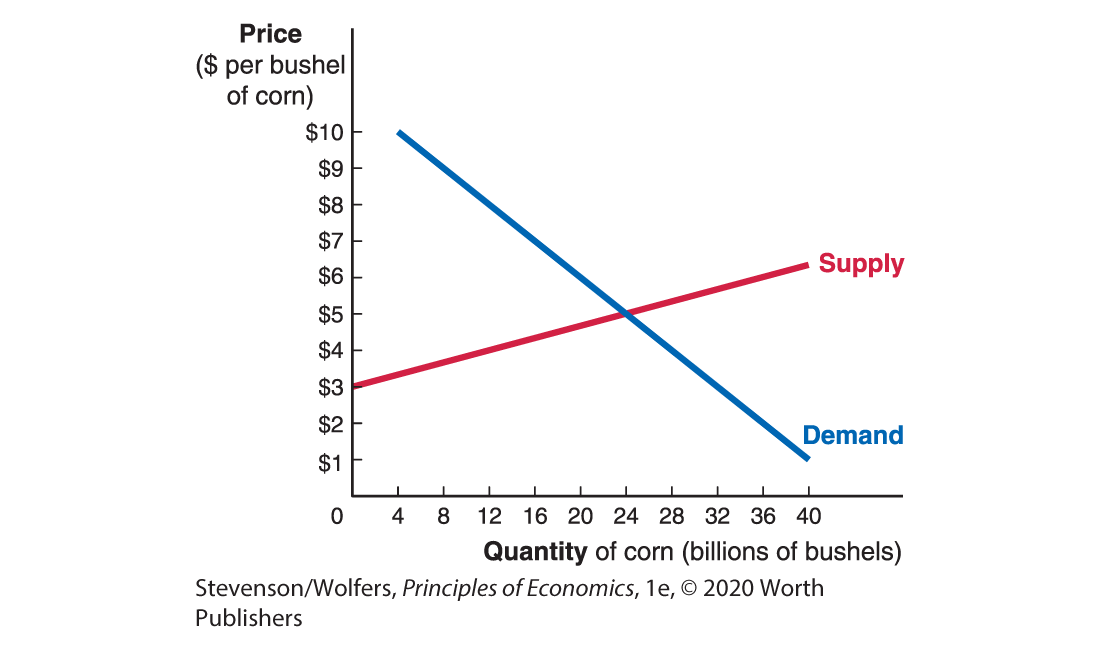
In the absence of a government involvement, what is the equilibrium price and quantity in the market for corn if the demand and supply for corn is as given in the accompanying graph. If the government offers a $2 per unit subsidy to the suppliers of corn, what happens to the price consumers pay inclusive of the subsidy? What price will suppliers receive, inclusive of the subsidy? Use a graph to illustrate the effect of this subsidy.
Learning Objective 6.2 Evaluate the full set of consequences of price ceilings and price floors.
Data on the market demand and market supply of rental apartments in a small college town is provided in the accompanying table.
Rent Quantity demanded Quantity supplied $2,000 5,000 13,000 $1,800 8,000 12,000 $1,600 11,000 11,000 $1,400 14,000 10,000 $1,200 17,000 9,000 Suppose that in order to assist tenants, the local government imposed a price ceiling (rent control) on apartments at $1,200 per unit. Would this create a shortage or a surplus? Of how many units? With the price ceiling in place, what would we expect to happen to the quality of rental apartments that are available?
The accompanying graph depicts a market for labor.
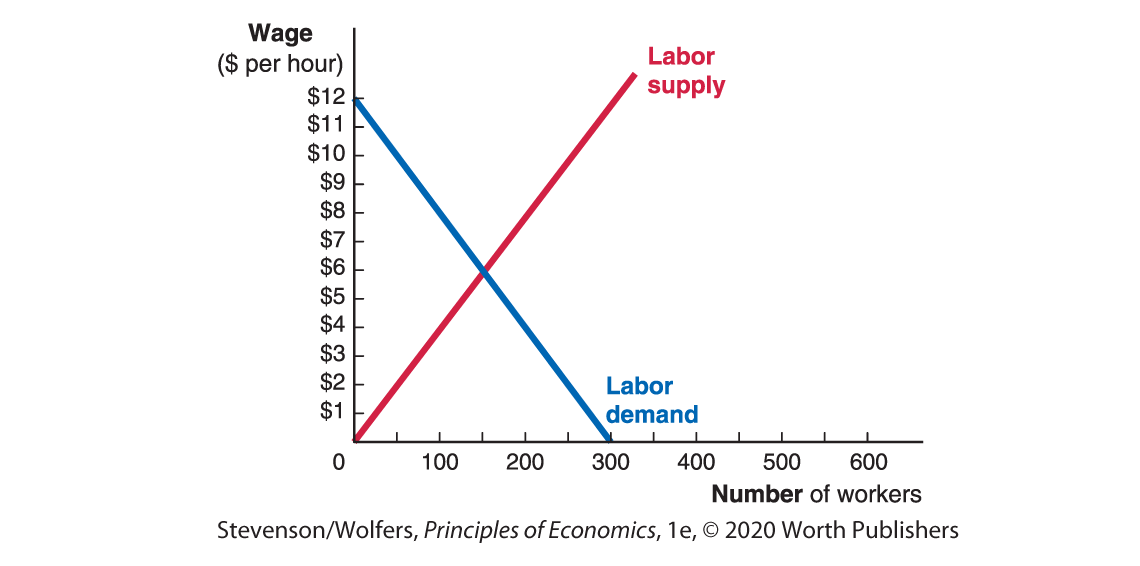
What is the equilibrium wage and equilibrium quantity of workers that will be hired in this particular labor market? Suppose the government imposes a minimum wage in this market at $4 per hour. What would happen in this market as a result of the new minimum wage? Suppose that the government decides to increase the minimum wage to $10 (a $6 increase). What would happen in this market as a result of the increase in the minimum wage?
Learning Objective 6.3 Analyze the consequences of quantity regulations.
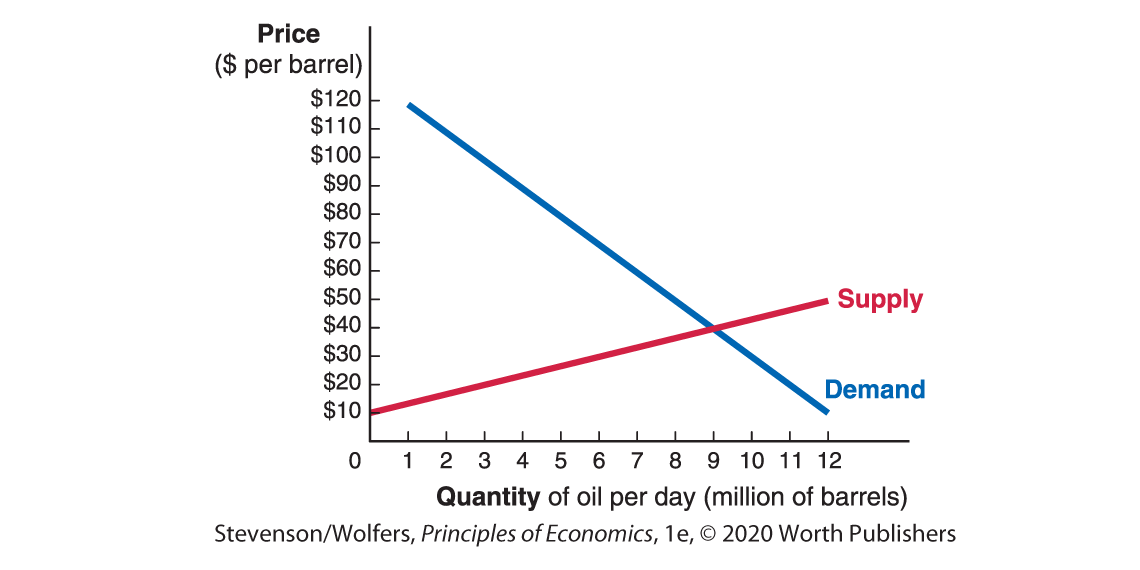
The United States produced a little more than nine million barrels of oil a day in 2017. If market supply and demand for oil is as given in the accompanying graph show what happens if the government imposes a maximum quota of 6 million barrels per day. What will happen to the price of oil in this market?
Suppose that electric cars become significantly more prevalent in the market. As a result, what would happen to the demand curve for oil? Is it possible that the quantity restriction imposed by the government will no longer become relevant in this market?
The Centers for Disease Control and Prevention (CDC) estimates that cigarette smoking causes more than 480,000 deaths each year in the United States. Cigarette smoking also carries a significant financial burden with an estimated $170 billion of direct medical expenses and another $156 billion resulting from lost productivity from workers annually. If market demand and supply for cigarettes in the United States is as shown in the accompanying graph, consider the government’s options if it wants to reduce cigarettes consumption to 200 billion packs per year.
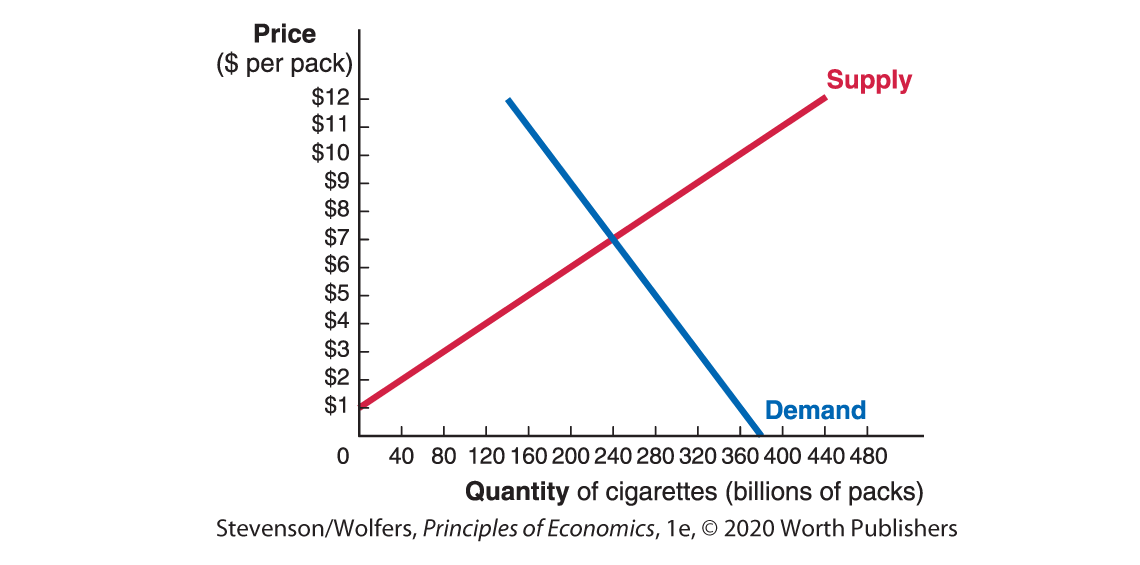
Taxes: What per-unit tax on cigarettes would accomplish their goal?
Price regulation: What price should the government set to achieve its goal using a price floor?
Quantity regulation: If the government simply sets a maximum quantity of 200 billion packs that can be sold, what price will consumers end up paying per pack?
Which policy do you think consumers will prefer? Which policy do you think cigarette sellers will prefer? Why?