Key Concepts
- consumer surplus
- deadweight loss
- distributional consequences
- economic efficiency
- economic surplus
- efficient allocation
- efficient outcome
- efficient production
- efficient quantity
- equity
- government failure
- market failure
- normative analysis
- positive analysis
- producer surplus
- Rational Rule for Markets
- voluntary exchange
Discussion and Review Questions
Learning Objective 7.1 Learn how to evaluate welfare and economic efficiency.
Think of an important policy issue and provide an example of both a positive economic statement and a normative economic statement related to that policy.
If an outcome is economically efficient, does this mean that everybody involved benefits? Provide an example to briefly explain your reasoning.
Learning Objective 7.2 Measure the economic surplus generated in a market.
Think of something you’ve purchased in the last few days. How much consumer surplus did you get from the purchase? Use the Rational Rule for Buyers to explain why you purchased that quantity. How much producer surplus do you think the seller got and what is total economic surplus? Use the Rational Rule for Sellers to explain why the seller sold the item to you.
Learning Objective 7.3 Assess the efficiency of markets.
There are dozens of laptop manufacturers around the world. Does the idea of efficient production mean that there should only be one laptop manufacturer making laptops at the lowest marginal cost?
Use the Rational Rule for Markets to explain why the equilibrium quantity in a market maximizes the market’s total economic surplus.
Learning Objective 7.4 Measure the costs of market failure.
Why do markets sometimes fail to generate efficient outcomes?
Can you think of any examples of markets that fail? Explain why that market failure does not mean that government control will necessarily lead to a better outcome.
Study Problems
Learning Objective 7.1 Learn how to evaluate welfare and economic efficiency.
Identify each of the following statements as either a positive statement or a normative statement:
Raising taxes on pollution emissions will result in some factories closing.
The federal government should tax pollution to address climate change.
An increase in the gasoline tax will reduce the amount that people drive and therefore cause a reduction in air pollution.
If the federal income tax is increased, workers will decide to increase the number of hours they work each year.
Sean is a community college student and has been saving his tips from his job waiting tables at a restaurant for months to see Hamilton. He is willing to pay $705 for a ticket. Anca has seen Hamilton five times already, but wants to see it again before heading to Europe for a month. She is willing to pay $1,250 for a ticket. There is one ticket left, and the seller is charging $700. Does Sean or Anca buying the ticket lead to a more economically efficient outcome?
Learning Objective 7.2 Measure the economic surplus generated in a market.
You are planning a move across town. Doing your research you find that the average rate of a moving company is $250 per hour for two movers (moving truck included). The marginal benefit you receive from each hour of the two movers’ time (and truck) is listed in the accompanying table.
Hours of movers’ time Marginal benefit 1 hour $850 2 hours $620 3 hours $500 4 hours $250 5 hours $150 6 hours $100 7 hours $0 For how many hours should you hire the movers? How much consumer surplus do you receive?
Now suppose that instead of paying per hour, a moving company offers a flat rate of $1,500 for two movers plus a truck for an eight-hour day. Would you hire the movers? How has your consumer surplus changed?
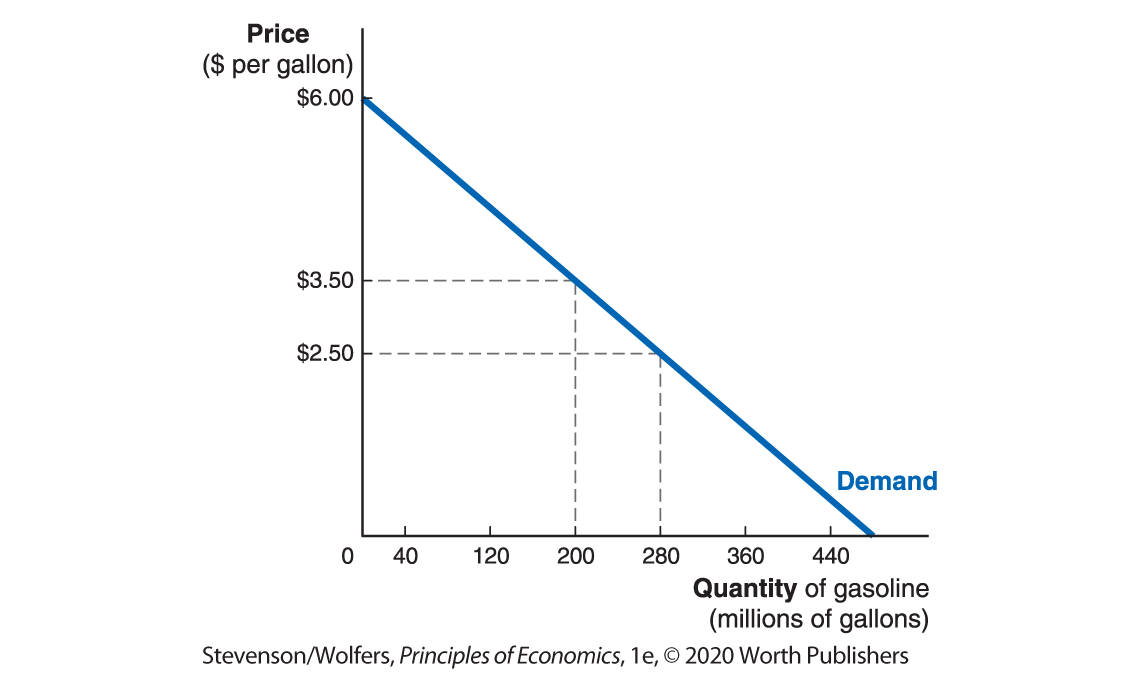
If the daily demand curve for gasoline is as provided in the following graph, then how much consumer surplus would consumers receive if the market price for gasoline was $3.50 per gallon? What about for a price of $2.50 per gallon?
Last year the average price for an airline ticket was $400, but the average price dropped to $350 this year due to a decrease in the demand for airplane travel. The accompanying table contains information on the supply of air travel.
Airfare (price per ticket) Quantity supplied (millions of seats) $0 0 $175 350 $350 700 $400 800 $575 1,150 $750 1,500 Draw the supply curve and use it to calculate producer surplus last year and producer surplus this year. How did producer surplus change?
Learning Objective 7.3 Assess the efficiency of markets.
Consider the market for tilapia. Ripple Rock Fish Farms, a small family fish farm in Ohio, and The Fishin’ Company, a large corporate supplier, are both producers of tilapia. The marginal cost curves for both firms are shown in the accompanying graph.
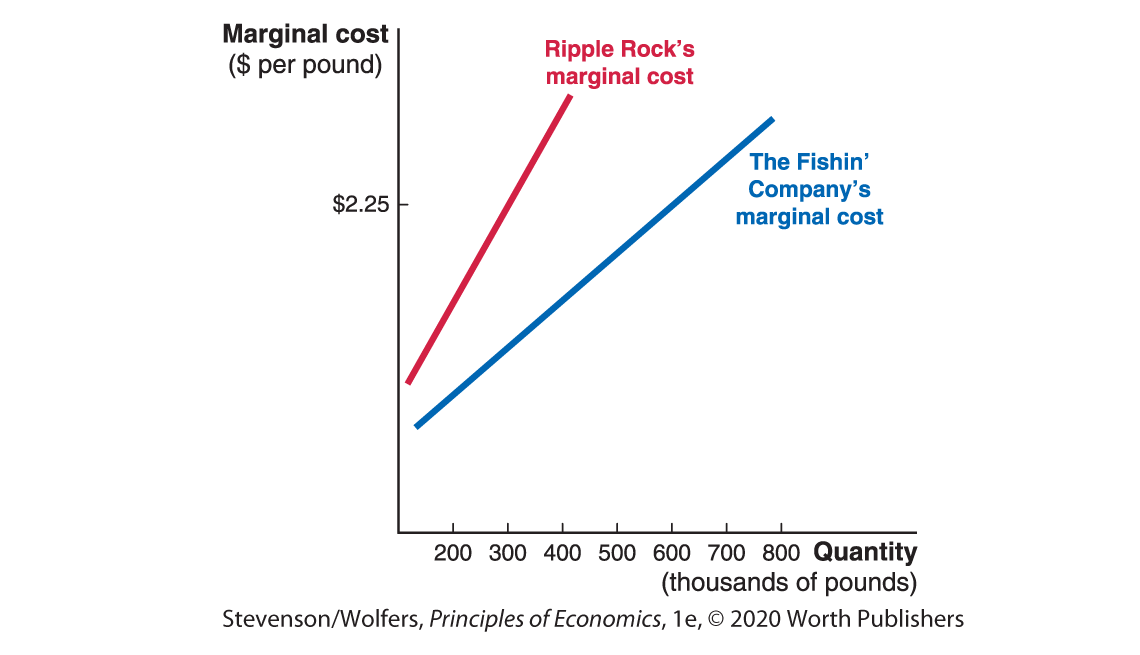
If the market price is $2.25 pound of tilapia, how many pounds of tilapia would Ripple Rock supply? What about The Fishin’ Company? How many total pounds would they collectively supply? Is this allocation the most productively efficient way to produce this quantity of tilapia?
Now, consider two people in the market for tilapia, Reagan and Cheryl. The marginal benefit curves for both individuals are shown in the accompanying graph.
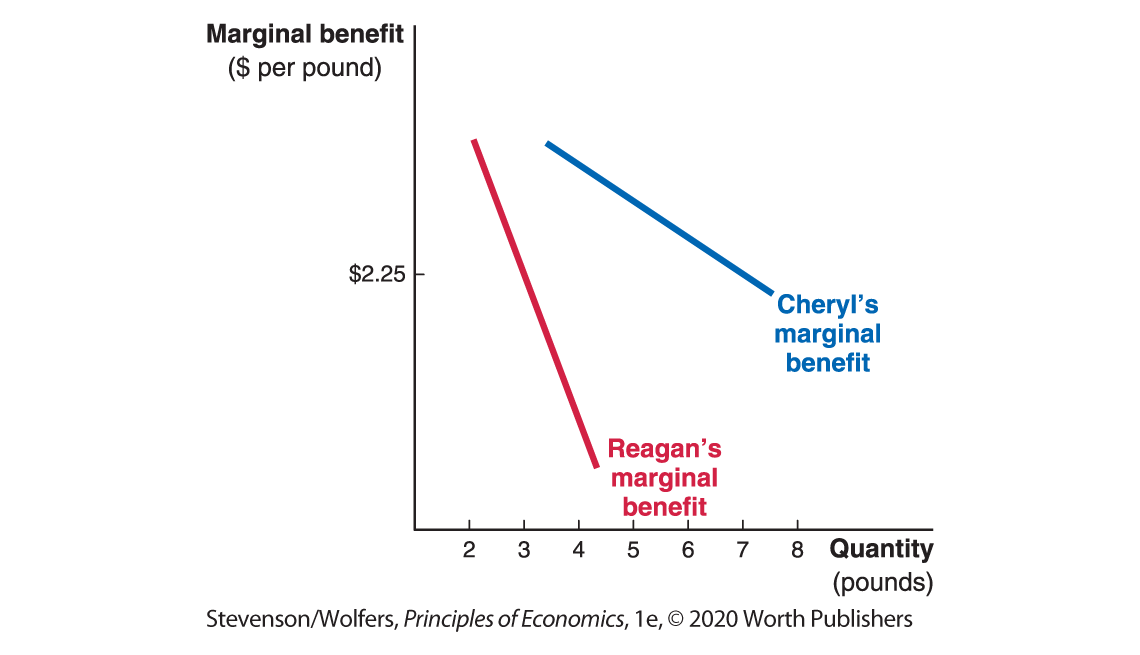
If the market price is $2.25 per pound of tilapia. How many pounds would Reagan purchase? How many pounds would Cheryl? How many total pounds will they collectively purchase? Is this allocation the most allocatively efficient way to distribute this quantity of tilapia?
Fei, Morgan, and Lakesha are all in the market for new Levi’s jeans. The marginal benefit for each pair of jeans per year for each of them is provided in the following table:
Quantity Fei Morgan Lakesha 1 $85 $40 $90 2 $60 $32 $75 3 $32 $24 $55 4 $20 $16 $32 5 $15 $8 $25 If the price of a pair of Levi’s jeans is $32, how many pairs of jeans will each person purchase? How much consumer surplus does each of them receive from the last pair of jeans purchased? How much consumer surplus will each of them receive for each of the pairs they buy at a price of $32? How much do they receive collectively?
Learning Objective 7.4 Measure the costs of market failure.
A study done by University of Minnesota economist, Joel Waldfogel, estimated the difference in the actual monetary value of gifts received and how much the recipient would have been willing to pay to buy them on their own. The results suggested that the average receiver’s valuation was approximately 90% of the actual purchase price.
In 2017, it was estimated that the average amount spent on winter holiday gifts in the United States was $906. Based on the estimate from the Waldfogel study, how much of this would be considered a deadweight loss?
In 2017, there were approximately 250 million people in the United States above the age of 18. Assuming that each individual purchased $906 worth of gifts, what is the size of the total deadweight loss associated with gift giving in the United States?
Consider the national market for in-home child care in the accompanying graph.
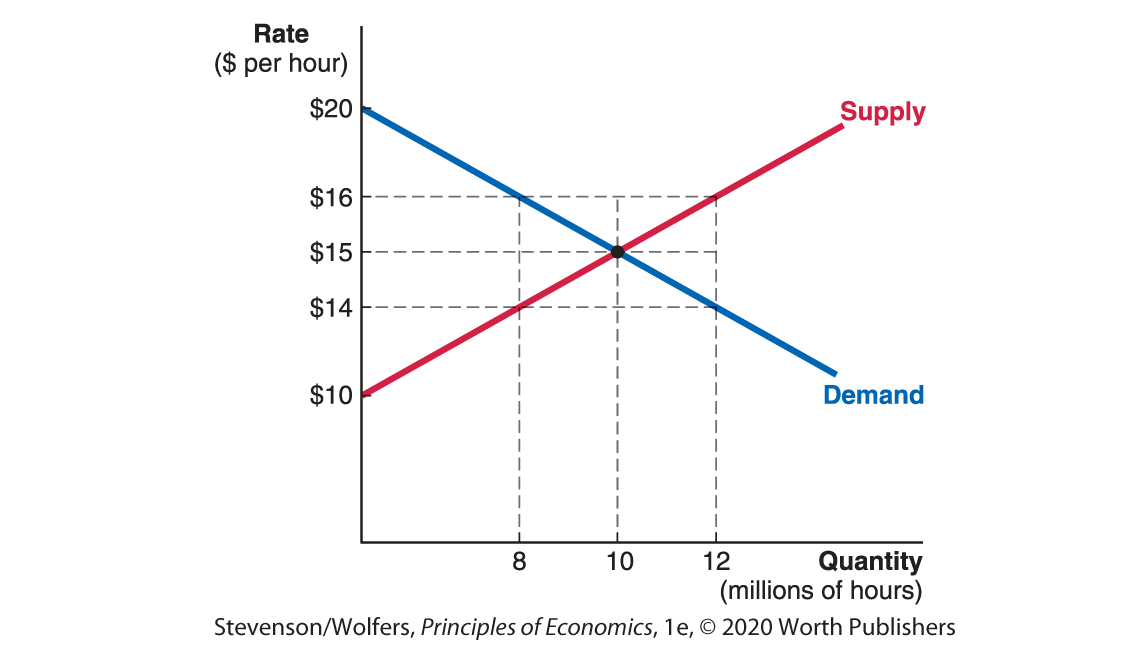
At 10 million hours, what is the size of total economic surplus in this market? Label the area representing total economic surplus on the graph.
At 8 million hours, what is the size of total economic surplus in this market? Label the area representing total economic surplus on the graph.
Is total economic surplus at 8 million hours larger or smaller than at 10 million hours? Label the area on the graph representing the difference in economic surplus. What is this area called?
Between 8 million hours and 10 million hours, which of the following is true? The marginal benefit to households exceeds the marginal cost to child-care providers or the marginal cost to child-care providers exceeds the marginal benefit to households.
Repeat parts b–d for 12 million hours instead of 8 million hours.
What is the efficient quantity of hours in this market?