21.1 GDP and the Macroeconomy
You’ve reached the point at which we’ll shift our attention from microeconomics—studying individual decisions in specific markets—toward macroeconomics, which is the study of the economy as a whole.
From Microeconomics to Macroeconomics
While this marks an important turning point, don’t draw too sharp of a distinction. The macroeconomy—that is, the economy as a whole—is simply the result of a whole bunch of individual decisions and interactions. Don’t think about micro- and macroeconomics as distinct halves of economics. Rather, think about macroeconomics as being built upon your understanding of microeconomics. This means that the tools you’ve developed so far—the core principles of economics, a framework for analyzing supply, demand, and equilibrium, and an awareness of market failure—will continue to be useful as you study macroeconomics.
What really shifts is our focus, from individual income, output, or spending decisions and the implications for individual markets, to the total amount of income, output, or spending across all the households, businesses, and levels of government that collectively make up the economy, as shown in Figure 1. Thus, rather than focusing on your individual income, we’ll analyze total income in the whole country. And rather than focusing on the output your business produces, we’ll analyze total output across all businesses in the country. Lastly, instead of focusing on an individuals’ spending, we’ll analyze total spending across all consumers, businesses, and the government.
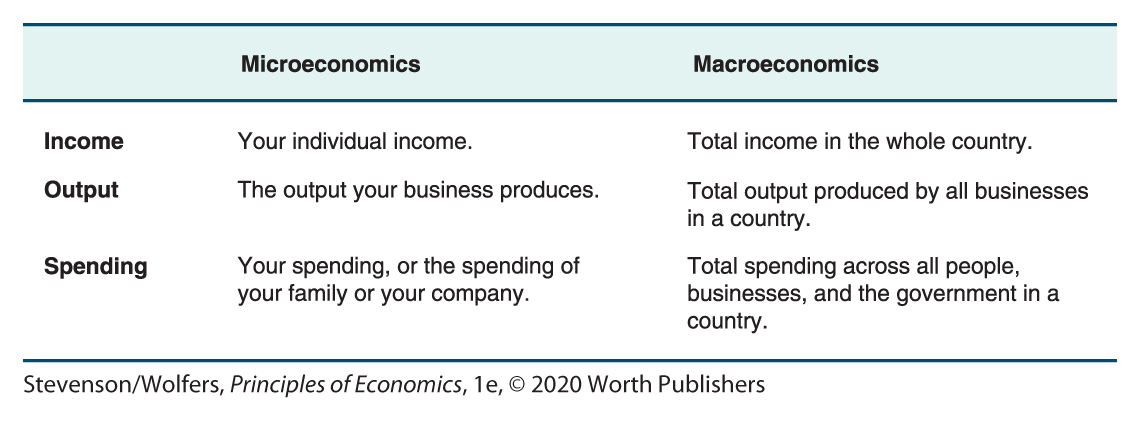
Figure 1 | Shifting from a Microeconomic to a Macroeconomic Perspective
Our task in this chapter is to figure out how to measure total income, total output, and total spending within a country. Each of these paths of inquiry lead to the same destination: gross domestic product, or GDP. I’ll tell you more about what GDP is in just a moment. But first, we’re going to need to dig a bit deeper to see how this one key statistic can answer three different questions.

A microeconomic decision …
… with macroeconomic consequences.
The Circular Flow
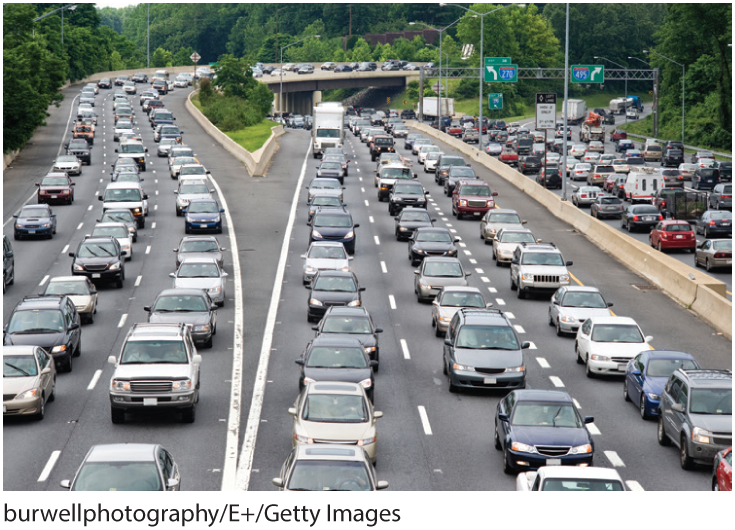
The interdependence principle is central to macroeconomics because across an entire economy, there are many important connections linking individual decisions, people, markets, and time periods. In this sense, macroeconomics is a lot like traffic. A driver who slows down to gawk at something interesting might think they’ve merely slowed their journey by a few seconds, but they’ll also cause the car behind them to brake, causing the car behind that one to slow as well, and so on. The effects of that one brief slowdown ripples backward because effects can cascade in an interdependent system.
The circular flow illustrates interdependence in the macroeconomy.
In macroeconomics, as in traffic, your choices depend on what others do, and what others do depends on what people like you do—you should recognize the interdependence principle at work. Your household income depends on how many people businesses hire, which depends on how much output they want to produce, which depends on how much households want to spend, which depends, in turn, on how much income households earn. While your income might seem like an output of the system, it’s also an input in an interdependent cycle, both impacting and impacted by macroeconomic conditions.
The circular flow diagram provides a conceptual framework for analyzing macroeconomic interdependence. This diagram, shown in Figure 2, illustrates the flow of money and resources through the economy, highlighting the linkages between households—like yours!—and businesses. (To keep things manageable, for now we’ll omit the government, the financial sector, and the rest of the world.)

Figure 2 | The Circular Flow of Income and Resources
Businesses and households interact in the markets for both inputs and outputs.
The circular flow diagram highlights two types of interactions. The top of the diagram shows the market for outputs, where consumers like you demand food, cars, haircuts, and other finished products, and businesses supply them. Your spending pays for this output. The bottom of the diagram shows the market for inputs, where businesses demand labor and capital, and households provide them in return for wages and profits.
All flows of resources are matched by a flow of money.
The circular flow shows that there are two ways to track what’s going on in the economy. First, the green arrows show the flow of real resources—the flow of actual inputs like the labor that households sell to businesses, and the flow of actual outputs like the goods and services that businesses sell to households. Second, the purple arrows represent the flow of money exchanged for resources, and so show us the market value of these resource flows. Each flow of real resources is matched by an equal and opposite flow of money.
Total income, total output, and total spending are all equal.
The flow of money is a measure of the market value of the resources that are bought, sold, produced, and earned. This reveals that:
- All output that’s produced gets sold at some market price, and so the market value of total output must be equal to total spending.
- Every dollar that someone spends is a dollar of income for someone else, and so total spending must be equal to total income.
It follows that total output, total spending, and total income in an economy all have the same value. That value is an economy’s GDP.
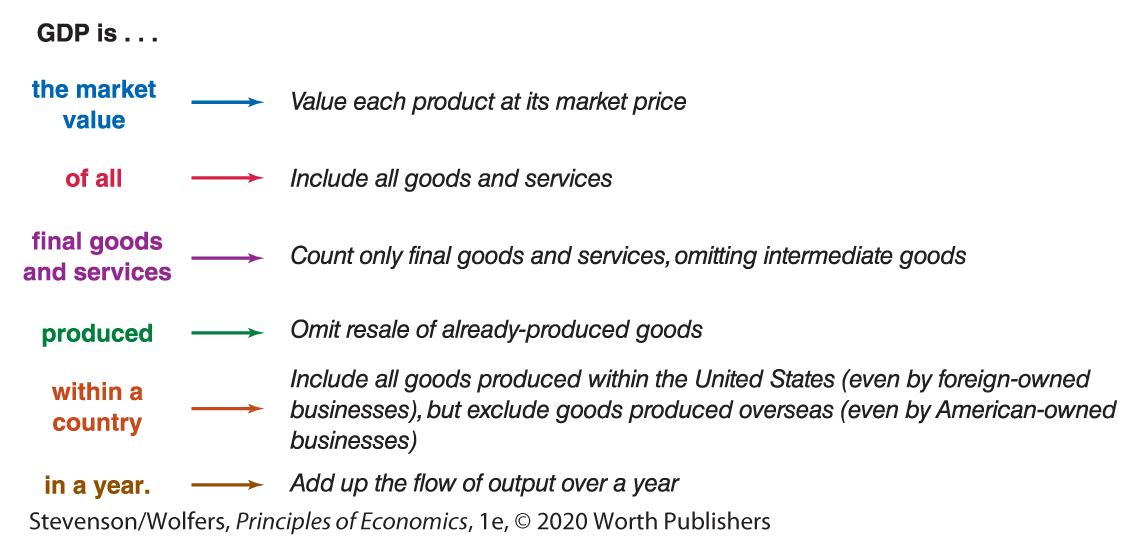
Digging into the Definition of GDP
GDP, which stands for gross domestic product (GDP), is a key measure of economic activity. Specifically, it’s the market value of all final goods and services produced within a country in a year. Conceptually, you can think about all the things that people get paid to do in a year in the United States. If you tally up the value of all the goods and services they produce, you’ll know what our collective output is. Add up all the apples, oranges, haircuts, hot dogs, Hollywood movies, education, housing, cars, shoes, and everything else that was produced, and in 2018, it came to a grand total of $20.5 trillion.
A number this big can be hard to wrap your mind around, so it’s often more intuitive to analyze GDP on a per-person basis. Per-person numbers are also more useful when comparing GDP over time or across countries. That’s why we’ll focus on GDP per person (sometimes called GDP per capita), which is total GDP divided by the population. Dividing $20.5 trillion per year by 327.4 million people reveals that GDP per person was $62,600 in 2018. This means that:
- average income per person was $62,600;
- average output per person was $62,600; and
- average spending per person was $62,600.
Okay, that’s the big picture. It’s time to get a bit more precise. The definition of GDP is: The market value of all final goods and services produced within a country in a year. That’s a bit of a mouthful, so let’s unpack it, piece by colored piece.
“The market value …”
The grand total of $20.5 trillion is the market value of everything that was produced in 2018. Getting to this grand total requires adding up the value of everything that was produced, from thousands of armchairs to millions of zippers.
If this sounds a bit like comparing apples and oranges, realize that the old expression is wrong: In fact you can compare apples and oranges—and armchairs and zippers, too—as long as you find a common unit. And for GDP—as with many measures in economics—that common unit is the dollar. GDP adds the total dollars spent on armchairs to the total dollars spent on zippers, and everything in between. This means that GDP values each good according to its market price—valuing each $300 armchair as if it’s one hundred times as valuable as a $3 zipper. In a competitive market, the price of a product is equal to its marginal benefit, so valuing goods at their market prices effectively values them the same way consumers do.
“… of all …”
GDP aims to be as comprehensive a measure as possible, and thus attempts to include everything that’s produced and sold in markets. This includes both goods, such as armchairs, and services, such as zoo visits. It’s not just the stuff that you buy for yourself, but also the things that the government purchases for you, such as public education and national defense.
As much as GDP tries to be comprehensive, it doesn’t include economic activity that occurs outside of markets. This means that the vacuum that you purchased at Walmart is part of GDP, but the cleaning services you provide your household when you use it are not. Paradoxically, when you hire someone to use your vacuum to clean your floors, their work is counted as GDP, but when you do it yourself, your work isn’t.
“… final goods and services …”
GDP only counts final goods and services, which are finished goods or services.
When you buy a couch from Crate & Barrel, it’s considered a final product because you’re the final user, so the $1,500 price of the couch gets added to GDP. That $1,500 price includes the value of all the contributions that created your couch, from the tree that’s now your couch frame, the lumberjack who felled that tree, the manufacturer who assembled the couch, the driver who trucked it to the store, and the salesperson who sold it to you. Because the price of a final good incorporates all the contributions of the prior stages of production, it’s sufficient to just count the final goods produced.

Intermediate Good: Wood waiting to be used to build a couch.

Final Good: The couch on the showroom floor, waiting for you to buy it.
Importantly, this means that GDP doesn’t separately include intermediate goods and services, which are those goods and services used as inputs in the production of other products. If you were to count both the value of the couch and the value of the wood that went into it, you’re effectively counting the cost of the wood twice. That’s why when you’re trying to figure out how much is produced in the economy, you should focus on final goods and services, such as the couch you might buy at Crate & Barrel.
“… produced …”
Because GDP measures production, it doesn’t count resale of existing finished goods. If you buy a new couch from Crate & Barrel, that sale adds to GDP, because that couch was just produced. But when you buy a second-hand couch from Craigslist or eBay, your purchase won’t add to GDP, because it doesn’t involve any new production. Second-hand sales merely change the ownership of goods that have already been produced and were previously counted in GDP.
“… within a country …”
GDP measures what we’re collectively producing domestically, meaning within the United States. It includes everything produced in workplaces in the United States—even if they’re made by a foreign-owned business, and even if the goods are sold to people outside the United States. It also excludes anything produced in other countries, so doesn’t count goods produced in American-owned factories in other countries, or goods produced overseas that’ll be shipped to American consumers.
“… in a year.”
When you measure GDP, you add up all the activity that’s occurred during a given time period. Most countries add up all the activity that occurs within a year. In order to stay up-to-date, we typically take four measurements a year—one every three months, called a quarter. We add up the production over the four quarters to find out what was produced during the full year. (And when the government reports GDP for just one quarter, it usually multiplies it by four, so that it’s reporting GDP at an annual rate.)
Notice that GDP is a flow, measuring the new output that’s produced within a year. Alternatively phrased, it’s the new spending you do this year, or the new income you earn this year. Make sure not to confuse the flow of income with wealth, which is the stock of assets—everything you own—measured at a specific point in time.
Recap: GDP is the market value of the final goods and services that are produced within a country in a year.
GDP simultaneously measures total spending, total output, and total income. That’s why economists often use these terms interchangeably. So when you hear folks discuss total spending, output, or income, realize that they’re all referring to GDP. Okay, it’s time to put the pieces back together. Remember: