21.5 Millions, Billions, and Trillions
If you’ve seen the movie Austin Powers: International Man of Mystery, you’ll know one of my favorite lines. Austin Powers’ nemesis, Dr. Evil, wakes up from a 30-year sleep with a dastardly plan—he wants to steal a nuclear warhead and “hold the world to ransom for… ONE MILLION DOLLARS.” The joke is that what sounds like a lot to Dr. Evil is a pittance in the grand scheme of things. It’s less than the U.S. military spends per minute.
The Problem of Big Numbers

Holding the world for ransom … for one million dollars.
It turns out that Dr. Evil is in good company. I have worked with many policy makers, and it’s stunning how often they confuse millions, billions, and trillions, even though they’re tasked with voting on legislation costing millions, billions, and trillions of dollars! The problem is that everyday life gives our brains plenty of practice at making sense of small numbers. But we have very little experience with much larger numbers, so it can be hard to wrap your mind around them. It’s no surprise, then, that psychologists have found that people often have faulty intuitions about large numbers, noting that once numbers get beyond a certain point, they start to lose meaning to people. That’s why people sometimes just give up and say, “a gazillion.” So we’ll spend some time now making sure that you think clearly about these differences, since they’re critically important for understanding the macroeconomy.
Start by visualizing the difference.
One simple trick is to visualize amounts you’re analyzing. Start by closing your eyes and picturing a single $100 bill. It is thin, small, and can easily fit in your pocket. $10,000 is a tidy bundle of Benjamin Franklins. Figure 11 shows that 100 of those stacks—which adds up to a million dollars—fills a briefcase. Next, realize $1 billion is 1,000 of these briefcases of cash. You can probably jam 1,000 briefcases of cash into a school bus (but only just), and so a billion dollars is roughly a busload of $100 bills. In order to get to a trillion dollars, you’ll need to get 1,000 busloads of cash together, and you can probably fit this into a football field if you double-stack them. So a trillion dollars is a football field stacked with $100 bills to a bit above your head.
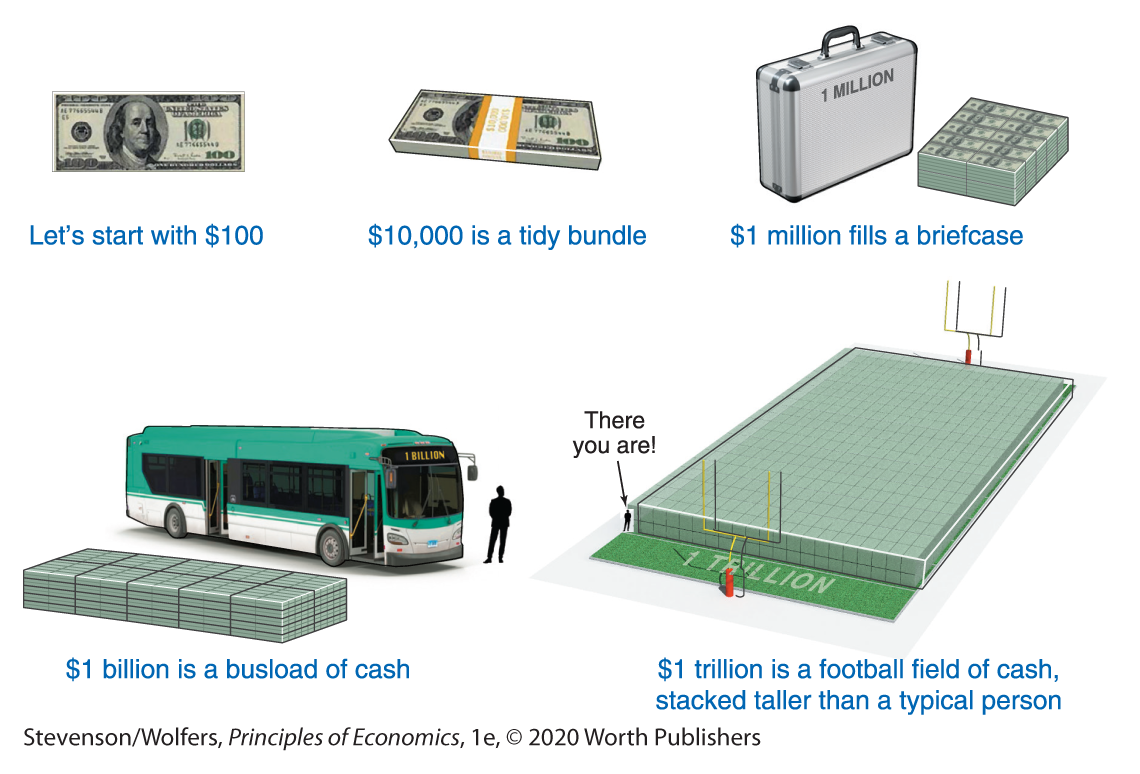
Figure 11 | Millions, Billions, and Trillions
Want to picture the total amount of annual GDP for the United States? It’s a bit more than $20.5 trillion, so about 20 times larger. This time, imagine your favorite football stadium, and fill it with $100 bills from ground level all the way up to the nosebleed seats. That’s roughly annual U.S. GDP.
Four Strategies for Scaling Big Numbers
I’ve got a confession, big numbers sound big to me, too. So how do I make sure that I don’t get confused? I scale big numbers so that they’re easier to manage. Here are a few strategies you can use to make sure that you don’t get confused.
Strategy one: Evaluate what it means per person.
The size of the U.S. economy is almost unimaginably large. What does it even mean to produce a football stadium full of $100 bills each year? Instead of trying to imagine this, try reducing this number to more human terms by thinking about it in terms of what it means per person. Total GDP in 2018 was $20.5 trillion, but it’s far more intuitive to think of this as $62,600 per person.
Keeping a few baseline numbers in the back of your mind will help you apply this strategy as you encounter more macroeconomic data:
- The world population is nearly 8 billion.
- The United States population is about 330 million.
- There are around 100 million households in the United States.
When you encounter other large numbers, you’ll better comprehend their scale if you convert them to per person or per household measures. This means that if I tell you that the United States spends $100 million dollars per year on research to develop self-driving cars or that the household furniture sector spends $900 million per year on advertising, you can translate these numbers to $1 and $9 per household. These are easier numbers to evaluate.
Strategy two: Compare big numbers to the size of the economy.
An alternative approach scales big numbers by comparing them to the size of the total economy. This is why macroeconomists often compare big numbers to total GDP. For example, in 2018, the federal government’s budget deficit—its outlays less its revenue from taxes and other sources—was $779 billion. Without further context, it can be hard to make sense of a number this big. But compare it to total GDP, and you’ll discover that the budget deficit was equal to 3.8% of GDP, which gives you a better sense of the scale of the problem.
Strategy three: Compare big numbers to their own history.
Another way to scale big numbers is to evaluate their size relative to their previous values. This is what percentage changes do. For instance, 6 million Americans were unemployed in 2018, which sounds like a lot. But when you scale it relative to past numbers, you discover that it’s fewer than half of the number of people who were unemployed in 2010, which is a useful context for understanding the scope of the problem.
Strategy four: Use the Rule of 70 to evaluate long-run growth rates.
Sometimes small differences in percentage changes can have bigger implications than you might think, and you can help sort these out by using a simple rule of thumb. The Rule of 70 says that you can figure out approximately how many years it will take something to double if you divide 70 by its annual growth rate:
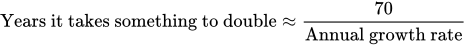
For instance, between 1970 and 2005, real GDP per person in the United States grew at an average rate of 2.1% per year. At that rate, it would take 

You can use this approximation to figure out how long it will take you to double your savings, how long it will take a country to double its average income, and how long it will take your business to double your number of customers. As you’ll discover—and as Figure 12 shows—relatively small differences in annual growth rates lead to big differences over many years because growth tends to compound over time.
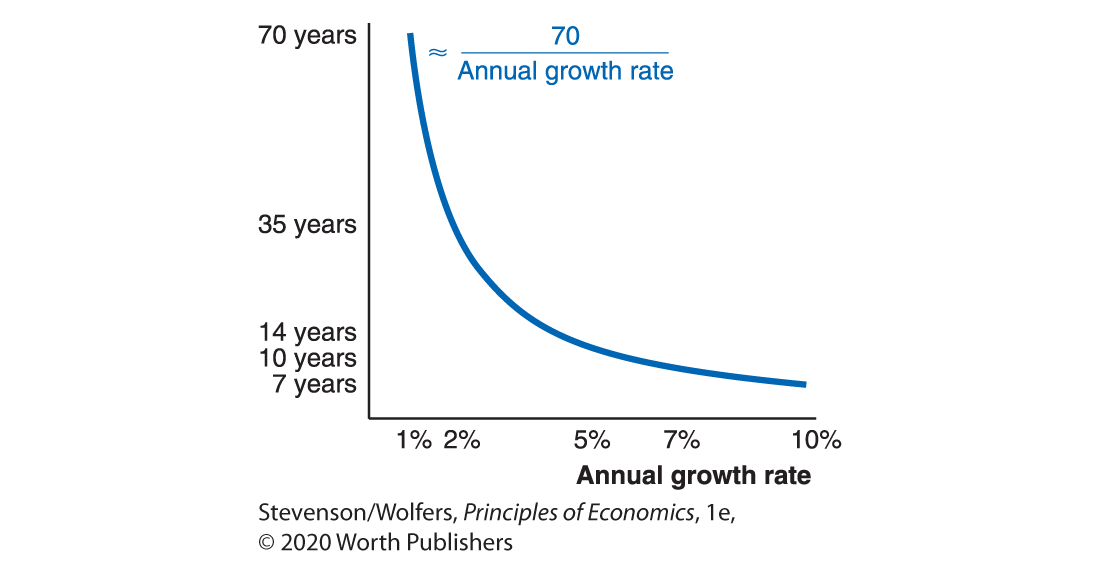
Figure 12 | Years Until Something Doubles
Do the Economics
The ability to convert big numbers into more manageable terms is a valuable skill beyond macroeconomics. Indeed, if you ever interview for a job in consulting, it’s likely they’ll test you on these abilities. So it’s worth practicing:
- Does Walmart employ roughly a thousand, a million, or a billion Americans?
- Is the total amount paid in wages and salaries in the United States each year several millions, billions or trillions of dollars?
- McDonald’s boasts that it sells “billions and billions of burgers” each year. Is this really plausible?
- Does Amazon Prime have 100 thousand members, 100 million, or 100 billion?
- In 100 years do you expect the price of a cup of coffee to be $2, $20, or $200?

It’s worth building your skill in working with big numbers like this, because it will prove to be a valuable asset that you’ll use every time you confront new economic data. So keep practicing!