22.2 The Ingredients of Economic Growth
Why are some countries rich, while others are so poor that they barely produce enough for people to survive? And what makes some countries grow richer over time, while others stagnate? Perhaps no other question in economics—indeed, in all of the social sciences—has such far-reaching implications for human well-being. An answer might provide a roadmap that poor countries could use to become rich, helping billions of people escape poverty and hunger. And so we turn to asking: What determines how much output each country produces?
The Production Function
Whether you’re analyzing how much your household, your business, or a whole country produces, you’ll find it useful to organize your thoughts around the idea of a production function. A production function describes the methods by which inputs are transformed into outputs, and so it determines the total production that’s possible with a given set of ingredients.
A production function is like a cookbook.
If you’ve ever baked a cake, then you’ve got some experience with a production function. You probably looked in a cookbook, and when you found a recipe that relied on ingredients that you had, you followed the instructions on how to combine flour, sugar, milk, and eggs in order to produce your cake. That cookbook told you how much cake you’d produce, given the quantity of ingredients you used.
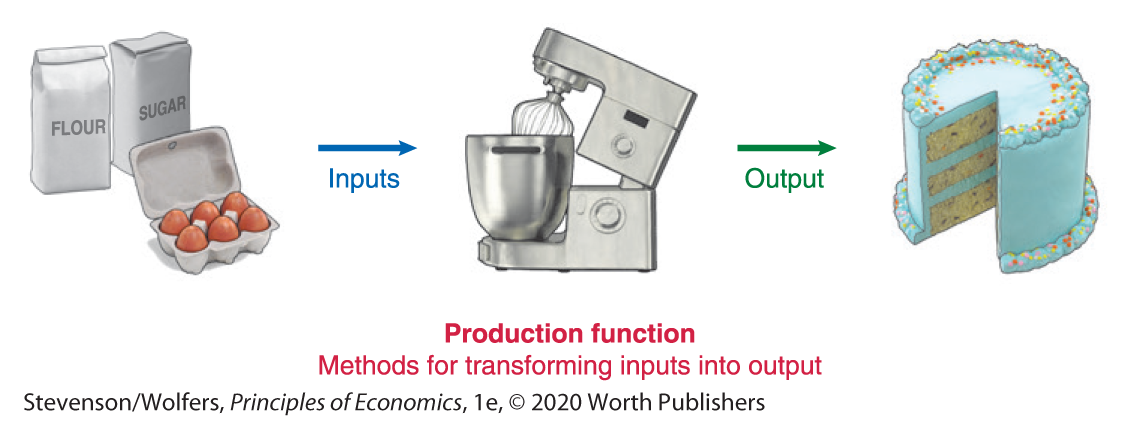
In this example, think of the production function as the whole cookbook, rather than an individual recipe. A recipe describes a particular production technique that relies on a specific quantity of milk, flour, and eggs. A cookbook is a collection of the most important recipes and each page lists a different production technique you might choose, depending on the ingredients you have available. A cookbook and a production function both describe how different mixtures of inputs can be combined to produce valuable output.
A production function describes how a business transforms inputs into outputs.
The same ideas apply to any productive activity. Your company’s production function describes the cookbook of management techniques you can use to transform your inputs into output. By this view, running a business is a lot like baking a cake, and your job as a manager is to acquire the right ingredients—the right people, skills, and machinery—and mix them in the appropriate proportions to produce valuable output. For instance, if you’re running a cake shop, you’ll mix together the hard work and skills of pastry chefs, cake decorators, and cashiers with retail space, display cases, commercial mixers, and ovens, along with raw ingredients like flour, butter, and sugar. Your bakery’s production function describes how the quantity of cake you’ll produce varies according to the amount of each ingredient you add to the mixture.
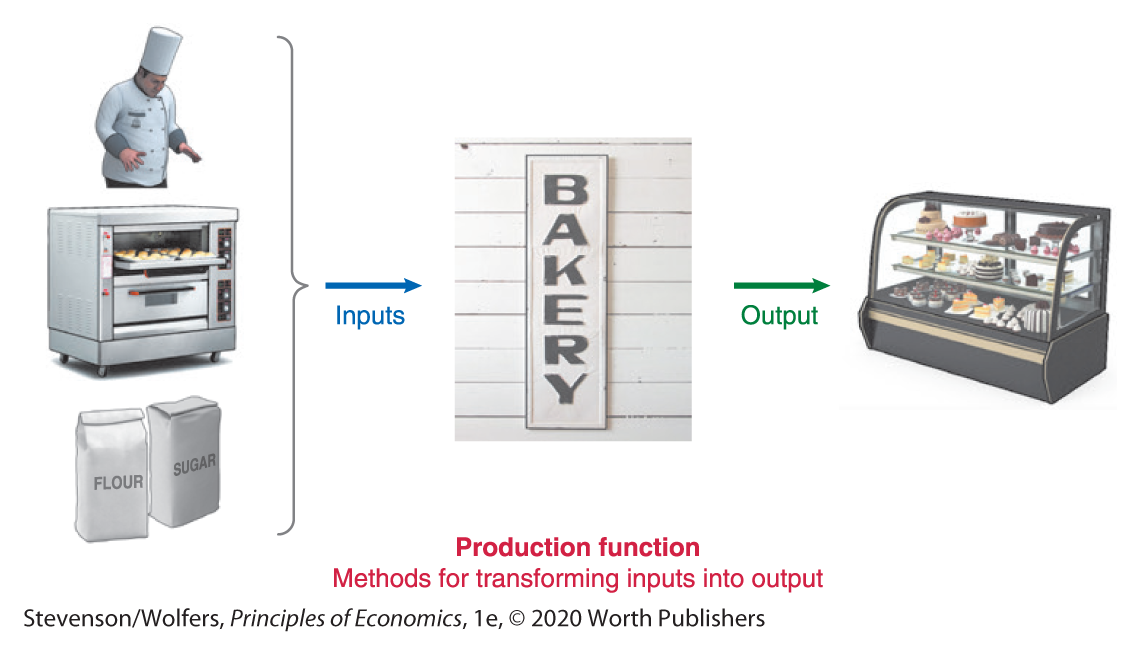
Just as a cake shop has a production function so too does a consulting firm, a hotel, a law firm, a hospital, or a high school. In each case, managers play the role of chef, mixing together workers, specialized skills, and equipment, to bake consulting services, a restful night, legal victories, healthy patients, or educated students. Your company’s production function describes the total quantity of output your business can produce depending on the quantities of each input you employ.
The aggregate production function links GDP to labor, human capital, and physical capital.
The same idea can be applied at the level of the whole economy where the aggregate production function relates total output—that is, GDP—to the quantity of inputs employed. As with individual businesses, the key ingredients are Labor (denoted L), human capital, which describes the skills that workers bring to the job (denoted H), and physical capital, which describes the tools, machinery, and structures we work with (the letter C was taken, so economists follow the German spelling of Kapital and label physical capital as K). The aggregate production function doesn’t include a separate role for intermediate inputs such as the flour used by a pastry chef, because intermediate inputs are typically produced by other businesses within the economy. Flour, for instance, is produced by mills that process the wheat grown by farmers, and so it’s already the result of combining labor, skills, and capital.
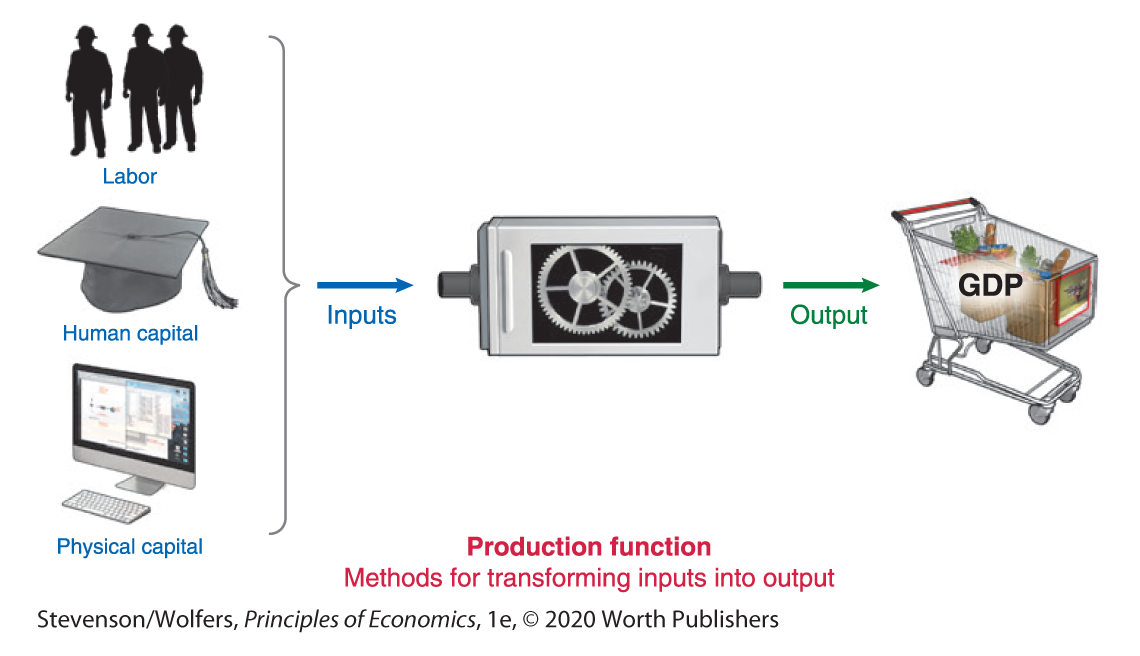
A production function describes how output varies with inputs.
The aggregate production function captures the idea that when you use more ingredients—more labor, more human capital, and more physical capital—you’ll get more output. It quantifies this relationship, telling you how much extra output businesses will produce as they add more labor, human capital, or physical capital. It can be useful to represent this idea mathematically, and the following equation simply says that the quantity of output a country will produce depends on the quantity of each of these inputs:

The aggregate production function illustrates that a country will produce more output if:
- It employs more labor
- Its workers become more highly skilled, accumulating human capital
- It accumulates more physical capital
Finally, a production function reflects the production techniques or recipes that are known at a specific point in time. Finding new and more efficient recipes will shift the production function, creating an additional engine of growth:
- Discovering new and more efficient recipes makes it possible to transform a given quantity of ingredients into a greater quantity of output.
Let’s dig into each of these factors in turn.
Ingredient One: Labor and Total Hours Worked

More babies means more workers, eventually.
As you know from personal experience, the more hours you work, the more you get done. The same thing applies to the whole economy: The more labor that workers do, the more output gets produced. The total quantity of labor input is measured as the sum of all hours worked across the whole economy. It reflects four factors: the size of the population, the fraction who are of working age, the share of those working-age people who choose to work, and how many hours each worker puts in. Let’s consider each of these, in turn.
Population boosts total GDP, but not GDP per person.
The total population of a country provides the upper limit to how much labor it can supply, which explains why the countries with the largest populations tend to produce the most GDP. Countries that experience more rapid population growth—more births, fewer deaths, and more immigration—also tend to experience faster economic growth. But that doesn’t mean that a larger population will yield higher living standards, because that larger GDP gets shared over more people. Population is a key determinant of GDP, but not GDP per person.
As we analyze material living standards, we’ll focus on the determinants of GDP per person. And that in turn will lead us to focus on other per person variables: hours worked per person, human capital per person, and physical capital per person.
Unfavorable demographics are likely to slow economic growth.
The demographic structure of the population matters, because children and the elderly rarely work. The dependency ratio measures the number of people either too young (under 18) or too old (65 or older) to work, per 100 people of working age. Figure 3 shows that the dependency ratio rose sharply in the United States due to the baby boom that followed World War II. The dependency ratio then fell, and by 2016, for every 100 people of working age, there were 61 people either too young or too old to work. This dependency ratio is projected to rise sharply over the next few decades, as those born in the postwar baby boom retire, and it will remain high due to increased life expectancy. The rising share of dependents is likely to slow economic growth over coming decades.
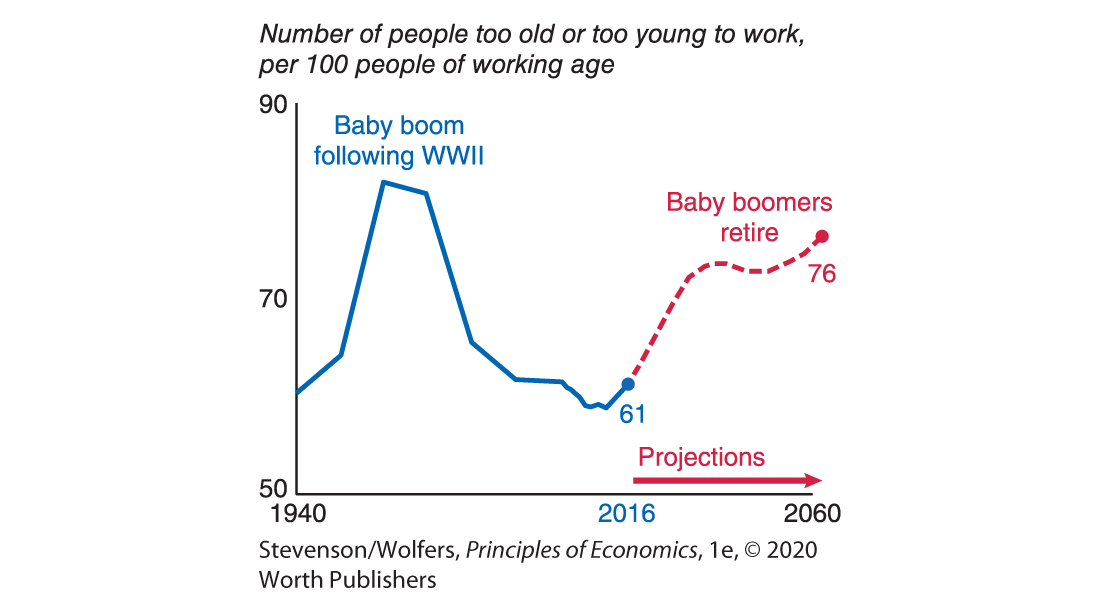
Figure 3 | The Dependency Ratio Is Projected to Rise
Data from: U.S. Census Bureau.
Women’s increased employment created economic growth.
The labor pool grows when a larger share of the working-age population chooses to work. The main driver of the rising participation over the past century, shown in Figure 4, has been an extraordinary transformation in attitudes toward women in the workplace. In the early 1900s few women worked outside the home, particularly once they married. By the early 2000s that share had almost tripled. Much of this change occurred in the 1960s, 70s, and 80s. This shift of women from the home into the market was responsible for a substantial share of the rise in U.S. GDP per person through this period. But by the late 1990s, further progress on this front stalled.
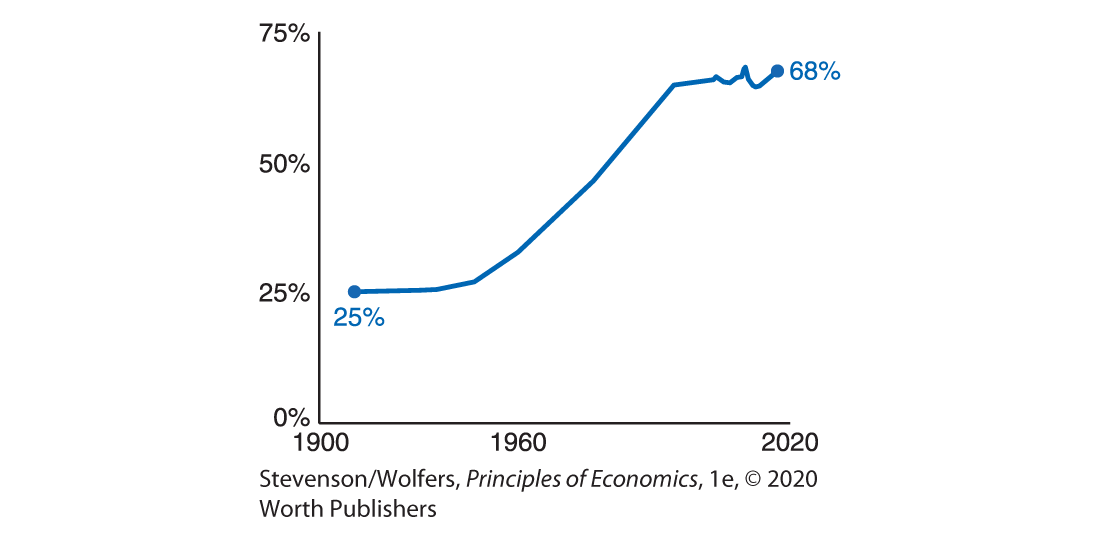
Figure 4 | Share of Working-Age Women Who Are Employed
Data from: U.S. Census Bureau.
Shorter workweeks will reduce GDP, but may raise well-being.
Total labor input reflects not only the number of workers, but also how many hours each person works, on average. The more hours that people work, the more GDP they’ll produce.
But that doesn’t mean we should work all the time! Recall that one limitation of GDP as a measure of well-being is that it doesn’t capture the benefit of the leisure you enjoy when you’re not working. As countries get richer, people tend to choose more leisure over work time. The reduction in the average work week has slowed GDP growth, but probably improved well-being.
Ingredient Two: Human Capital
While hours of work reflect the quantity of labor used, output also reflects how productive people are while at work. The more each worker produces per hour, the higher GDP will be. Economists refer to output per hour of work as labor productivity.
Your labor productivity depends critically on your human capital, which describes the skills and knowledge that you develop through education, training, and practice. As you learn economics you are building your human capital: You’re acquiring new analytic tools that’ll help you make better decisions, developing frameworks you’ll use to transform data into insight, and building the intellectual muscles that you’ll apply to better understand, analyze, and predict human behavior. This human capital is a key reason that economic graduates are more productive and highly paid than most other college graduates. Your ability to learn economics builds on a foundation you laid many years ago.
Primary education develops literacy, which is a key tool for further learning.
You probably spent your first few years of elementary school learning to read and write. Literacy is such a foundational skill that you probably take it for granted. Yet it’s essential for economic life: You need to be able to read to follow written instructions, communicate asynchronously with co-workers, execute written contracts, send e-mail, look things up online, read a newspaper, or evaluate political candidates.
Figure 5 shows that while literacy is nearly universal among industrialized countries, it remains a substantial barrier in many poorer countries. This is important because literacy is the foundation of all later learning, empowering people to acquire further specialized knowledge. Indeed, right now it’s empowering you to learn about the economic impact of literacy!
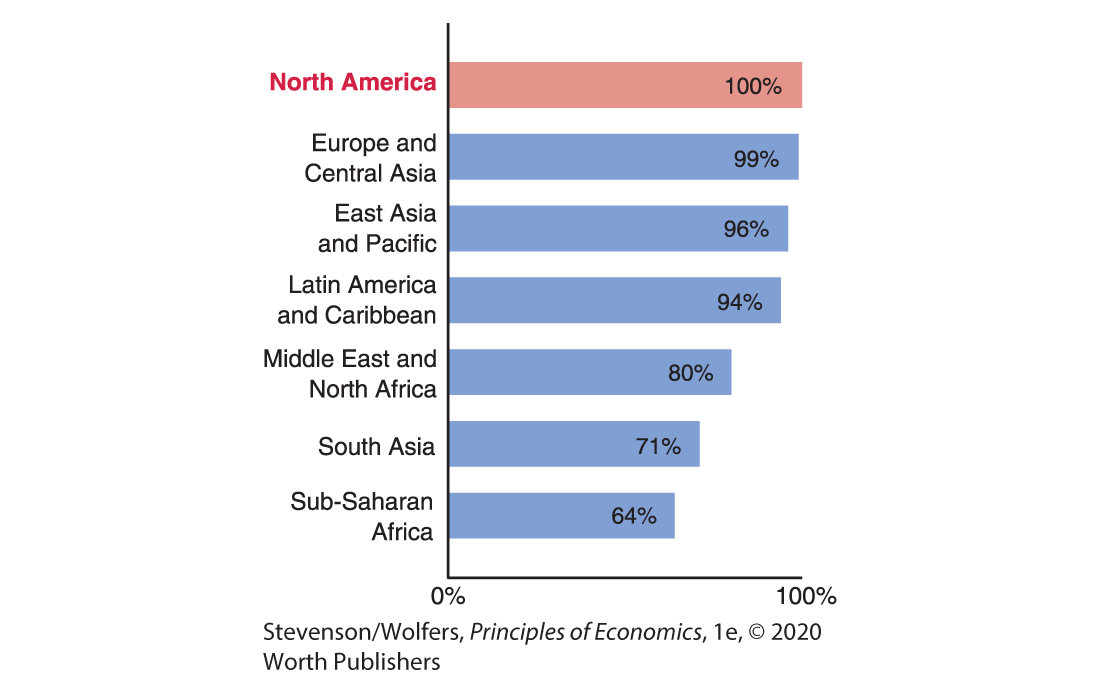
Figure 5 | Adult Literacy Rates Vary Across Regions
2016 Data from: World Development Indicators.
Secondary education promotes greater productivity in a range of jobs.
One of the key reasons the United States was one of the fastest-growing economies in the twentieth century is that it invested more in the education of its citizens than other countries did. A century ago, many mocked the idea of making high school free and available to everyone, arguing that there remained a great need for physical labor and that laborers wouldn’t benefit from having a high school degree. Despite these arguments, support for high school education grew rapidly in the United States. That’s why Figure 6 shows that high school diplomas went from being a rarity in 1900, to being nearly universal today. The claim that this education wouldn’t be useful turned out to be wrong, as it enabled blue-collar workers to work with increasingly sophisticated machinery, boosting their productivity.
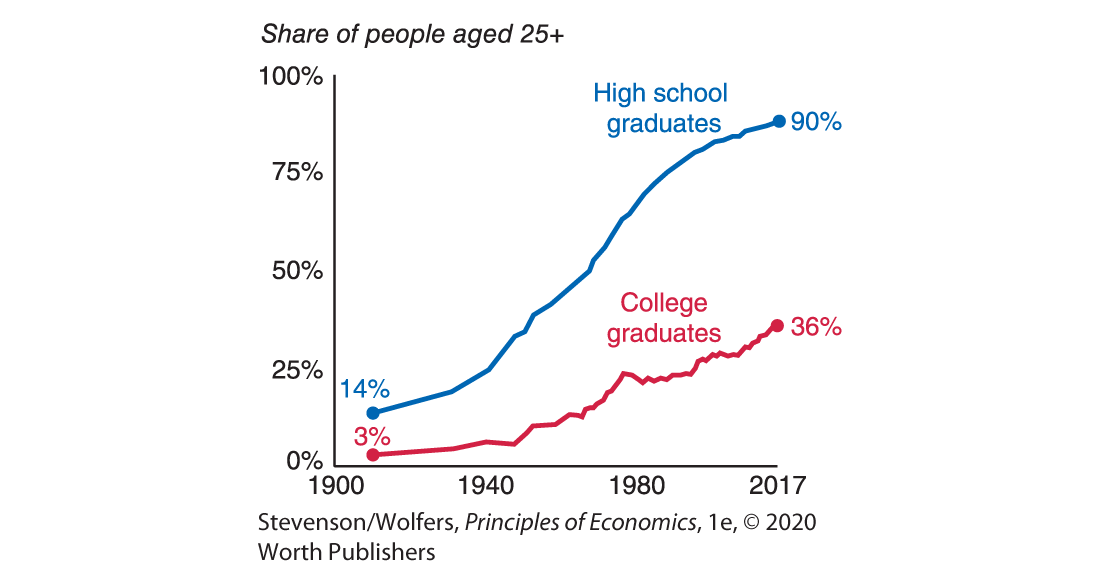
Figure 6 | High School and College Graduation Rates Have Risen
Data from: U.S. Department of Commerce.
Further gains in human capital will come from expanding college education.
Figure 7 shows that most countries lag the United States in terms of primary and secondary education. But now that both are nearly universal in the United States, further gains in human capital accumulation will come from more people completing a college education. Even here, the United States is a world leader, and a bit more than one-third of Americans have a college degree, second only to South Korea.
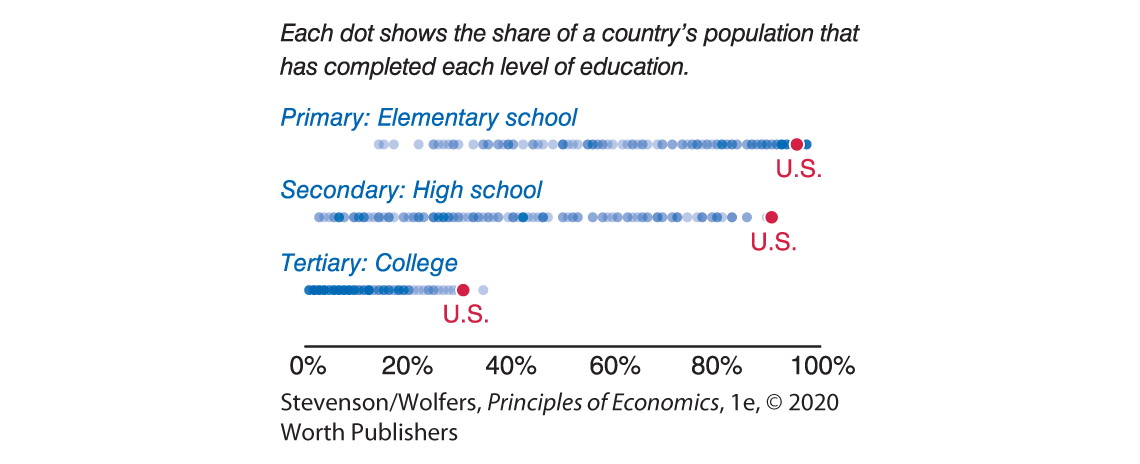
Figure 7 | The United States Leads the World in Education
Data from: World Bank.
The rate of return to making these investments is high: Each year of college raises your earnings by around 8%, and employers pay this premium because the skills you learn in college tend to make workers more productive. Those who complete a college degree enjoy more than $1 million higher lifetime earnings on average, suggesting that a college degree leads you to produce at least a million dollars more in output. (Good news: The boost is even larger for economics students.)
It’s not just the quantity of education that matters, so does quality. So far we’ve measured human capital mainly in terms of the quantity of education you get, but it also depends on the quality of that education. Figure 8 shows that when common international exams are given across countries, the United States is no longer a world leader. This explains why education policy debates are focused on improving the quality of education.
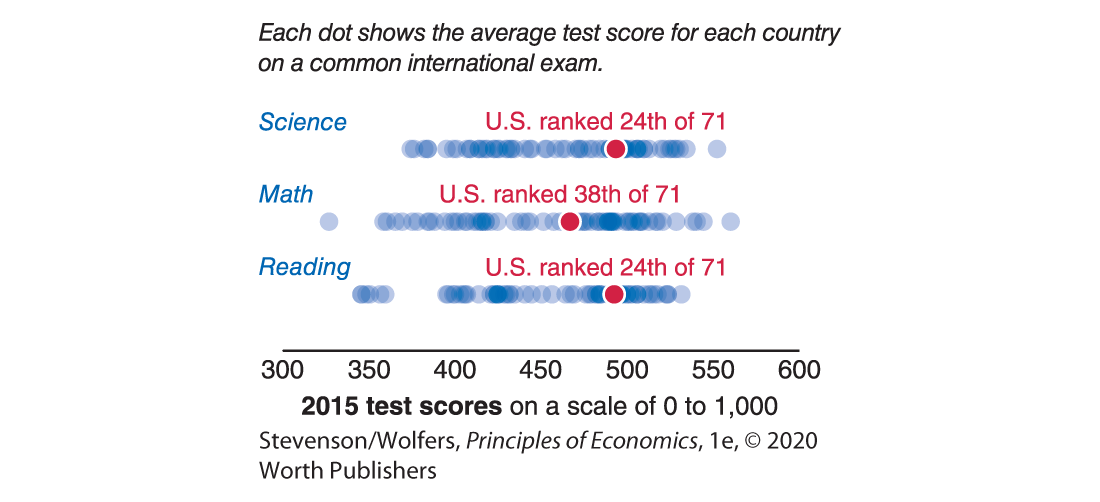
Figure 8 | Average Exam Scores of 15 Years Around the World
Data from: National Center for Education Statistics.
Ingredient Three: Capital Accumulation
The third factor that determines how much you can produce per hour is the equipment you’ll work with. For instance, a pastry chef is more productive when they’re working with commercial-grade mixers, large ovens, and other kitchen equipment. The capital stock is the total quantity of physical capital, and it includes all equipment and structures used in the production of goods and services. It includes both privately owned tools, machines, and factories, and government-provided infrastructure, such as roads, electricity networks, and telecommunications.
Physical capital is a complement to labor.
Workers produce more when they have the right tools available to them, so physical capital is best viewed as a complement to labor. As such, the quantity of capital per worker is an important determinant of labor productivity. While some people worry that machines are a substitute for labor, the reality is that they help you get more done. After all, a pastry chef equipped with a commercial mixer doesn’t have to mix their recipes by hand, so they can use the time they save to bake even more cakes. Indeed, the Industrial Revolution—in which workers went from working with hand tools to harnessing machine power—marked a turning point in history as it sparked a productivity boom that led economic growth to take off.
Investment depends on the saving rate.
Companies grow their capital stock by investing in new equipment and structures. This process is so important that we’ll spend all of Chapter 26 on investment and all of Chapter 27 exploring the role that financial markets play in this process. For now, the key point is that investment occurs out of resources that are saved rather than consumed. As a result, the savings rate is a critical determinant of investment, which ultimately determines the amount of capital each worker has to work with.
Foreign investment builds the capital stock.
The other way to grow the American capital stock is through foreign investment. For instance, the Japanese automakers Toyota and Mazda partnered to build a new car production plant in Huntsville, Alabama, that will add $1.6 billion to the U.S. capital stock. While the plant is owned by Japanese companies, it will employ American workers who will work with that capital, and the cars that roll off that production line will be made in America, and so will count toward America’s GDP. The wages that are paid will accrue to the American workers employed at this plant, while the profits will go to the Japanese owners of the plant.
New Recipes for Combining Ingredients: Technological Progress
Recall that a production function is like a cookbook, listing the most important recipes for mixing labor, human capital, and physical capital together to produce output. This points to the final source of economic growth: New ideas, recipes, or production techniques. Economists refer to new methods for using existing resources as technological progress. It is important because these new methods create ways to produce more valuable output from your existing inputs.
New recipes make it possible to produce more from given physical inputs.
Technological progress can involve new production techniques that build on scientific discoveries. For instance, the discovery of how to rotate crops to replenish the soil led to a massive boost in crop yields. It’s effectively a new recipe for farmers, telling them how to combine their land, labor, and capital in a way that produces more output from their existing inputs. Technological progress can also involve new and better ways of doing things. For instance, the Japanese auto industry is famously efficient due to ingenious management techniques its automakers use to run streamlined production lines. Their recipe for combining workers and capital has since spread around the world.
Sometimes technological progress literally is a new recipe—a new way to combine existing ingredients that yields more valuable output. Oral rehydration therapy might be the most important medical advance in a generation. It’s a blend of sugar, salt, and water, which if mixed in just the right proportions, will revive a child dying from cholera-induced diarrhea. Since this recipe was discovered in the 1960s it has saved tens of millions of lives.
Computers embody technological progress.
The technological progress that sparked the computer revolution is also a new recipe. The key ingredient of computers is sand (or silicone dioxide), and it has existed for thousands of years, but we typically used it in other recipes: Kids at the beach built castles out of it, builders used it as an ingredient in their cement mixes, and artisans in Venice melted it to create glass. What’s new is the understanding that silica can both conduct and block electricity, which means that it’s a semi-conductor. That understanding created new recipes in which sand can be combined with other ingredients to create the sophisticated chips that power modern computers.
This highlights an important distinction. Technological progress doesn’t refer to computers, or even the silicone chips that power them. Those are items of physical capital that embody technological progress. But the underlying technological change is the idea or recipe for combining these ingredients to create a computer.
Interpreting the DATA
The falling cost of light
Technological progress is responsible for one of the most transformative changes you’ve probably never thought about: The increased production of light. The bulb that’s shining above your head right now is providing what was once an extraordinary luxury. New recipes for producing light have made it plentiful and cheap today.
Go back far enough in human history, and the only recipe to create light involved gathering wood, rubbing two rocks or sticks together, and using the resulting spark to light a fire. It would take a solid 60-hour week of work to gather enough firewood to produce 1,000 lumen-hours of light, which is probably less than your overhead light will give off over the next hour. Thousands of years later, a new recipe was developed, in which wicks were dipped into molten animal fat to create candles. George Washington calculated that burning one candle for five hours each night would cost him £8 per year, more than most American families could afford. Many families lived in darkness, instead.
All that changed when Thomas Edison created an extraordinary new method for producing light by inventing the electric light bulb. Your great-great-grandparents could work a 60-hour week to get five months of continuous light. Today, we have LED lights, and that same amount of labor will buy you all the light you’ll need for the rest of your life, plus some. Figure 9 shows just how much the price of light has fallen due to these new recipes for producing light. The declining cost has transformed modern life, so that we can spend our evenings reading, studying, or socializing. It’s a story that illuminates just how important technological progress can be.

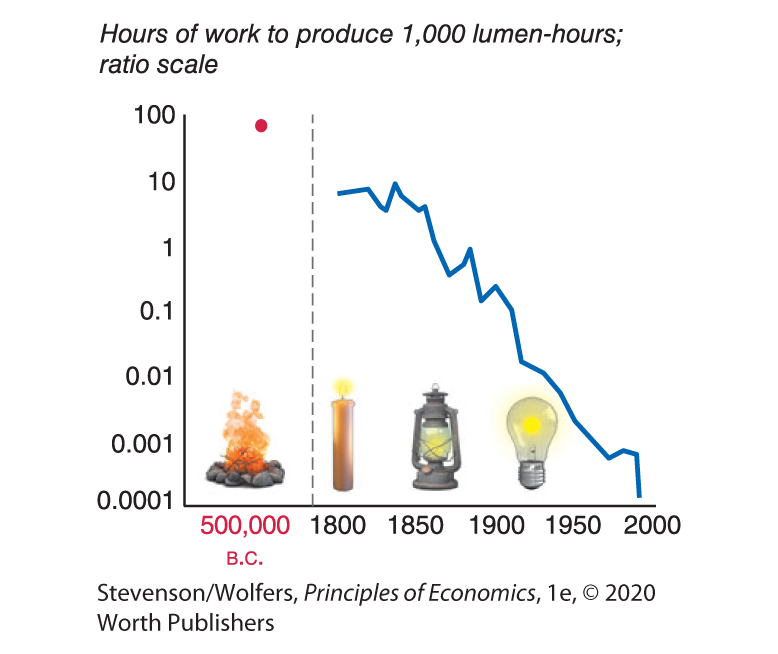
Figure 9 | The Declining Price of Light