26.5 The Market for Loanable Funds
Our analysis so far has taken the real interest rate as given. That’s about to change, as we dig into the factors that shape interest rates, and hence investment.
To figure out what determines the real interest rate, we need to distinguish between two time horizons because they point to two distinct sets of forces. In the short run, the interest rate rises and falls from month to month as the Federal Reserve tweaks interest rates in an effort to dampen the economy’s short-run ups and downs. We’ll devote Chapter 34 on monetary policy to explore how the Fed lowers interest rates when the economy is operating with excess capacity and inflation is low, and it raises rates when the economy is operating above full capacity and inflation is high. But the Fed’s adjustments only nudge the interest rate a bit above or below its long-run level. In the long run—which is our focus here—the real interest rate evolves slowly over many years in response to the balance of saving and investment.
Supply and Demand of Loanable Funds
To assess the long-run drivers of the real interest rate, we’ll analyze the market for loanable funds, which is the market for the funds used to buy, rent, or build capital. It brings together savers who want to lend their funds and investors who want to borrow those funds. This market determines the long-run real interest rate, and therefore the quantity of investment.
Savers supply funds, and investors demand them.
In this market, savers are the suppliers, supplying their funds to businesses who want to borrow them. Investors are the demanders, demanding funds to help fund for their investments in new capital like wind turbines. The financial sector—banks, the bond market, and the stock market—is the marketplace where suppliers of funding (savers) meet demanders (investors).
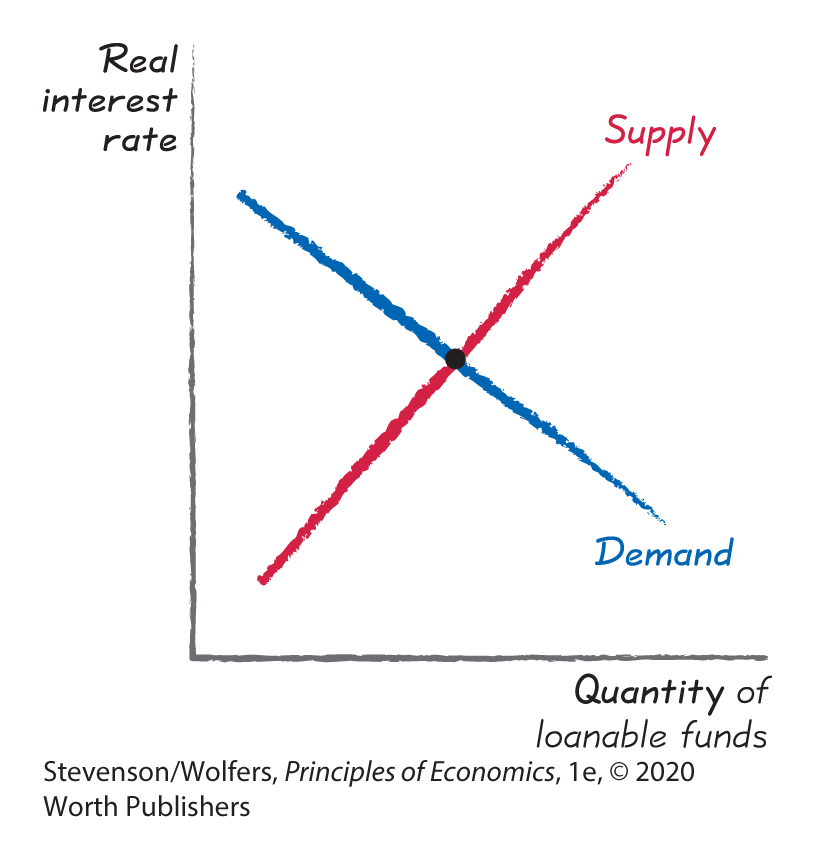
The price of a loan is the real interest rate. It represents the real resources that a borrower must pay a lender to borrow $100 for a year. The long-run interest rate is determined by the forces of supply and demand for loanable funds, as shown in Figure 14.
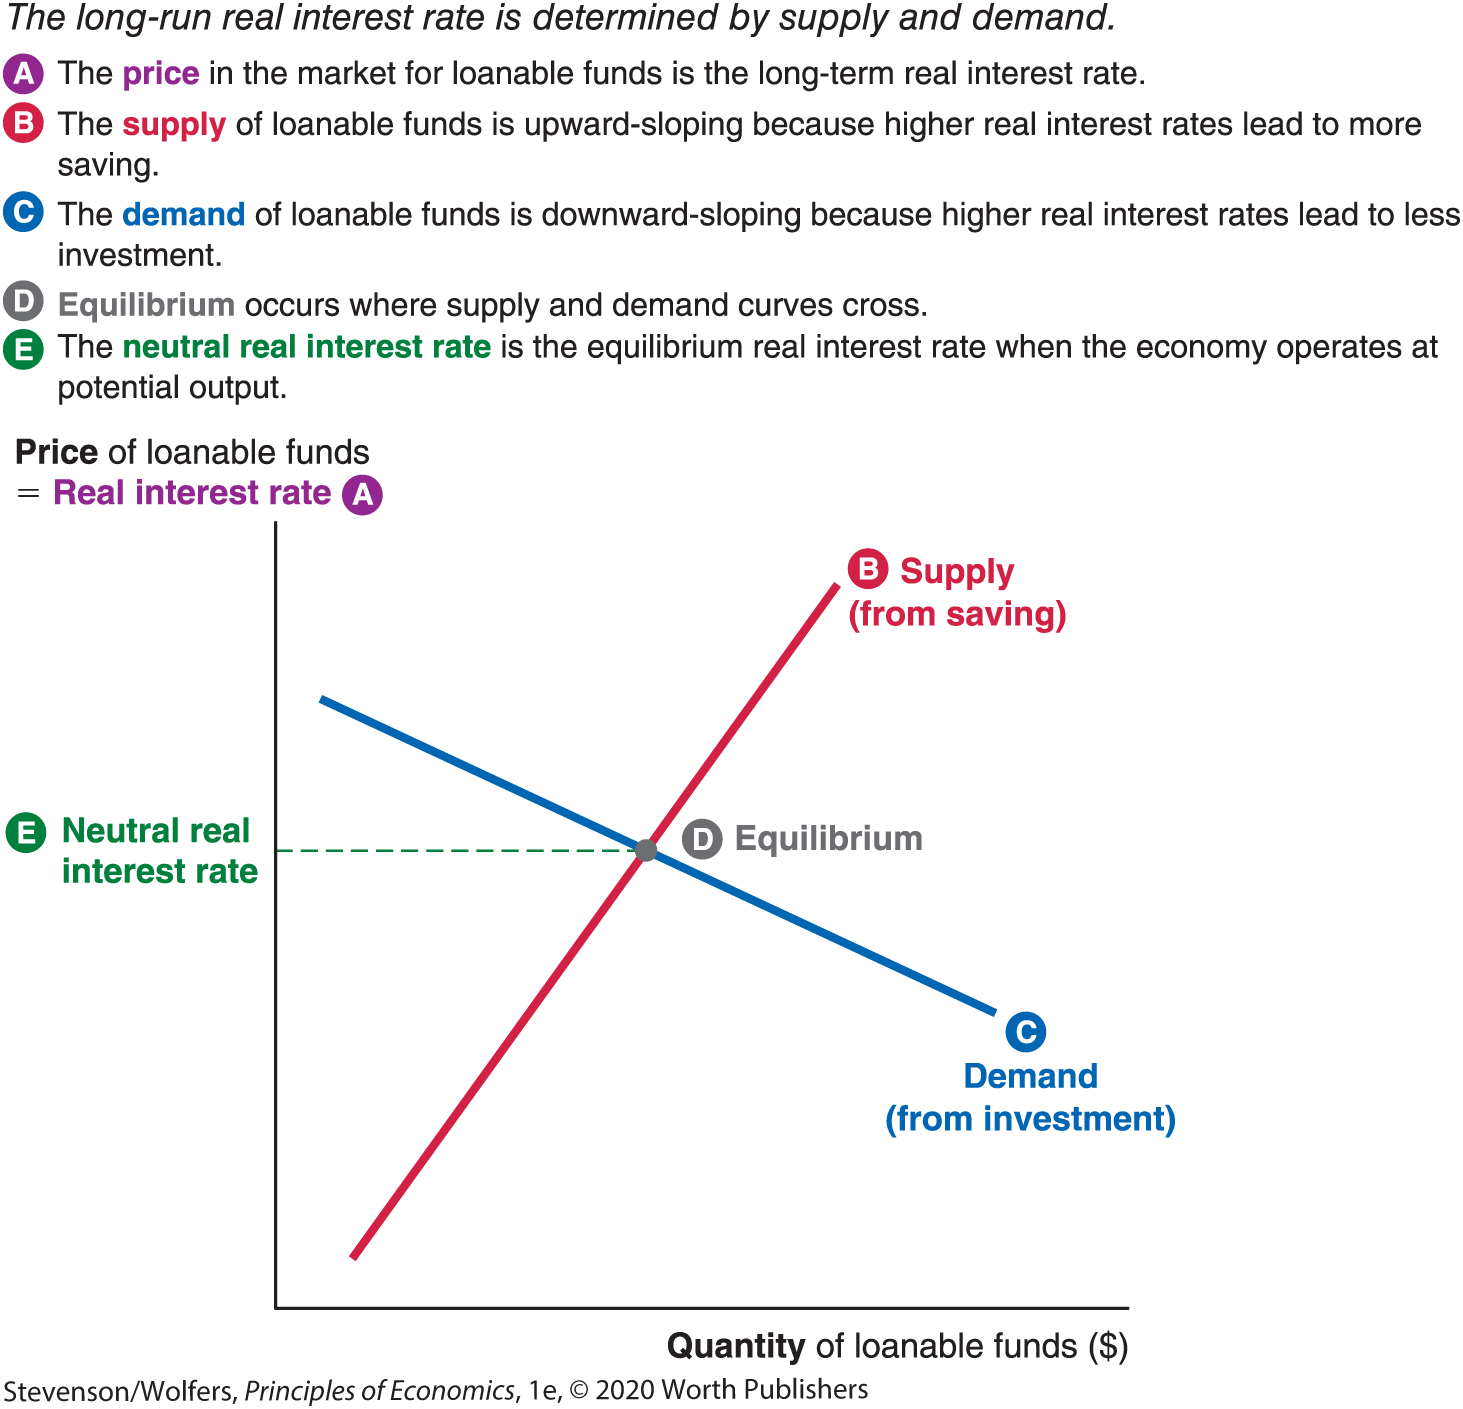
Figure 14 | The Market for Loanable Funds
The supply curve is upward-sloping because a higher real interest rate raises the benefits of saving (as discussed in Chapter 25), leading a larger quantity of loanable funds to be supplied. The demand curve is downward-sloping, because a higher real interest rate makes fewer investment projects profitable, leading a smaller quantity of loanable funds to be demanded.
The real interest rate is determined by supply and demand.
Equilibrium in the market for loanable funds occurs at the point where the supply and demand curves cross, and it determines the equilibrium real interest rate.
In order to abstract from short-run business-cycle influences, we’re focusing on the supply and demand curves that apply when the economy is operating at its potential. It follows that this is the equilibrium real interest rate that applies on average over the long run. This is called the neutral real interest rate because it’s the interest rate that operates when the economy is in neutral—producing neither above nor below its potential.
Our next step is to forecast how changing economic conditions change the neutral real interest rate. We’ll start by analyzing factors that might shift saving and the supply of loanable funds, and then we’ll turn to factors that shift investment and the demand for loanable funds.
Shifts in the Supply of Loanable Funds
A shift in saving at any given real interest rate will shift the supply of loanable funds causing the neutral real interest rate to change.
Figure 15 illustrates that a decrease in saving, which shifts the supply curve to the left (shown in green), will lead to a higher real interest rate. It also illustrates (in purple) the opposite case, in which an increase in saving shifts the supply curve to the right, which leads to a lower real interest rate.
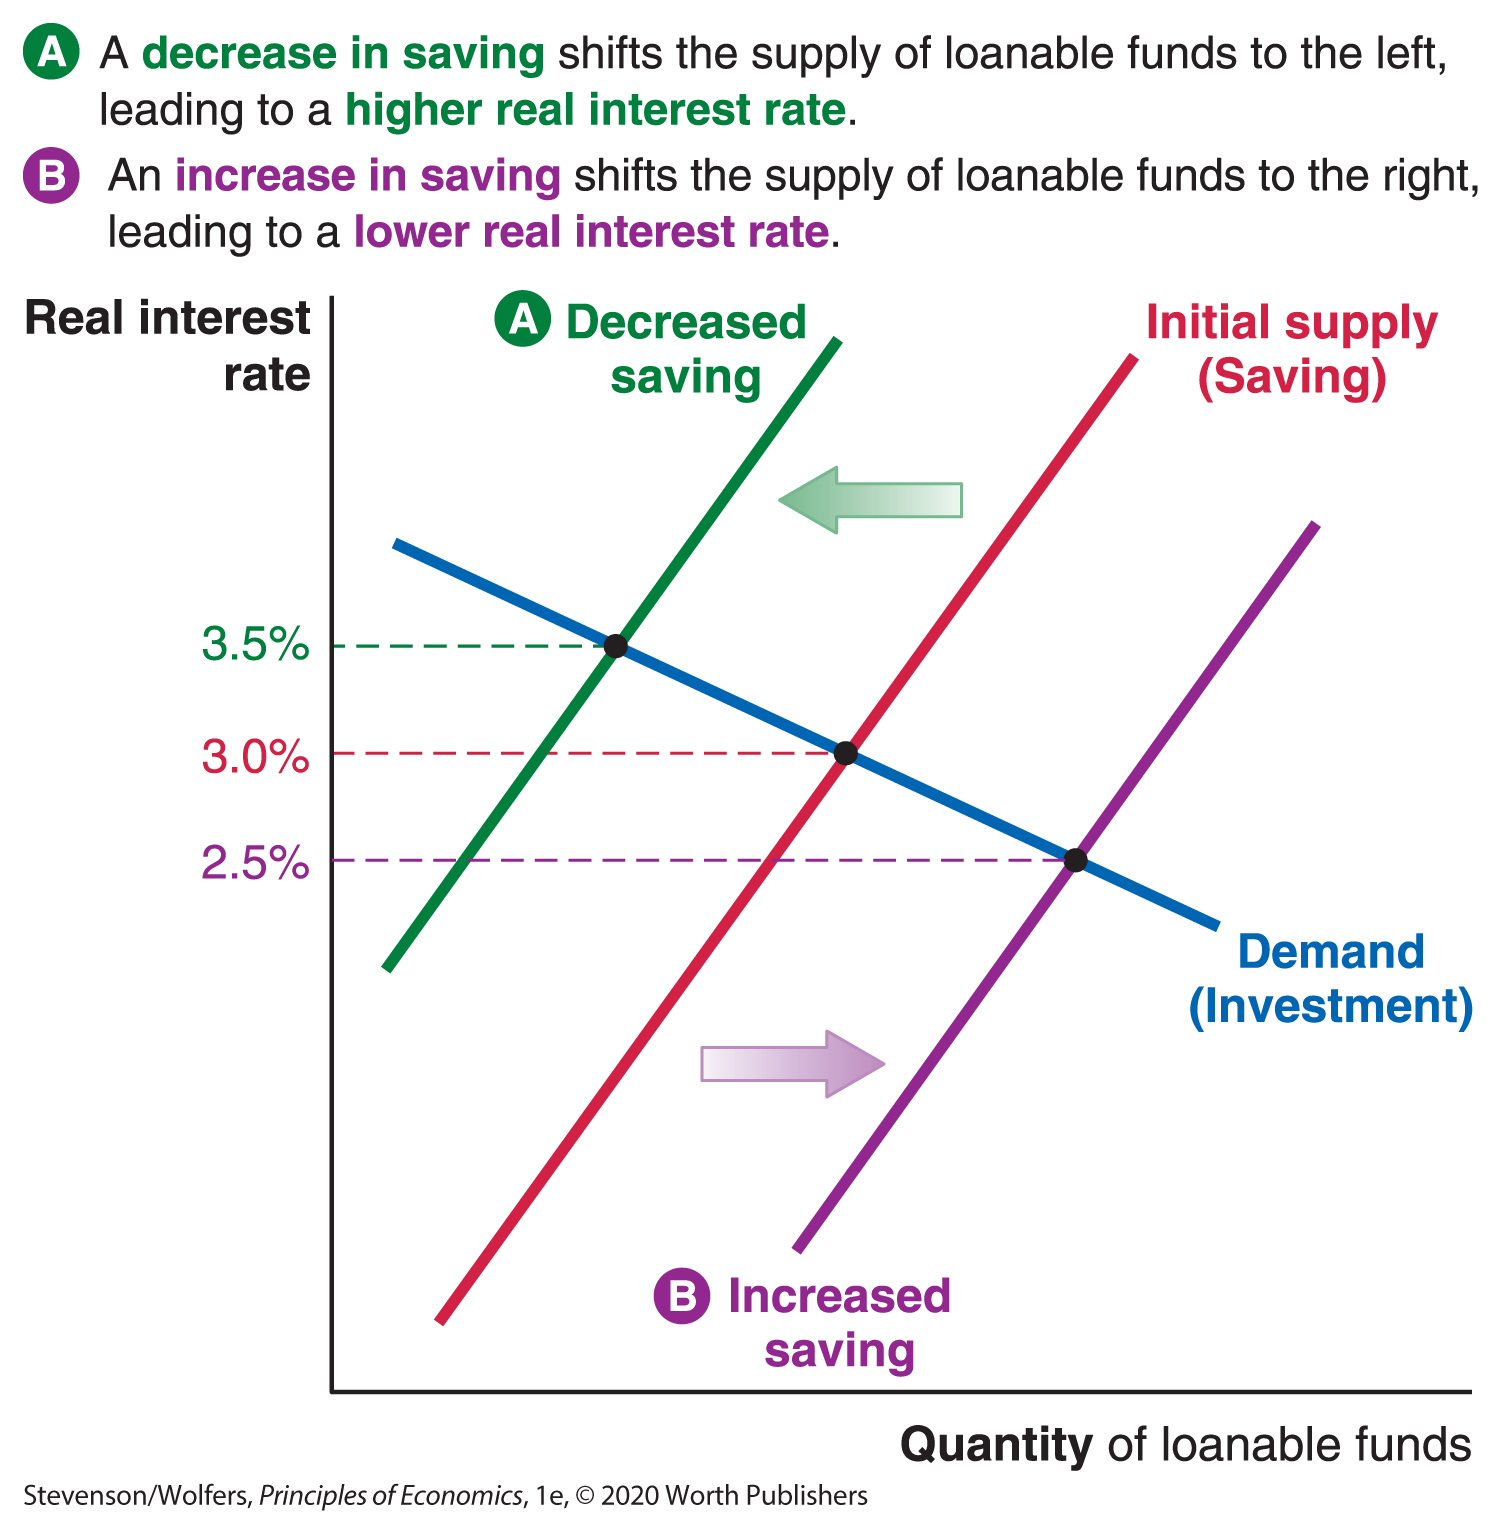
Figure 15 | Shifts in the Supply of Loanable Funds
The supply of loanable funds will shift only if there’s a change in savings by one or more of the three types of economic actors who supply loanable funds: private savers, the government, and foreigners.
Supply shifter one: Changes in personal saving rates.
Personal saving refers to saving by households of whatever income they don’t spend or pay as taxes. Just as putting money in the bank counts as saving, so does paying down your debt, because it frees up loanable funds for others to use. Any factor that shifts people’s willingness to save will shift the supply of loanable funds.
For instance, the government offers big tax breaks to save for your retirement. These tax breaks increase the incentive to save, thus shifting the supply of loanable funds to the right, which lowers the neutral interest rate. If these incentives were removed, saving would decrease at each interest rate, leading the supply curve to shift to the left, which would raise the neutral interest rate.
Supply shifter two: The budget surplus (or deficit) shifts government saving.
Government saving refers to saving by the government. When the government’s revenues exceed its outlays, the government’s budget is in surplus, and so it accumulates extra funds. This budget surplus adds to the supply of loanable funds. By contrast, a budget deficit means that the government is dissaving—that is, spending more than it takes in—thereby reducing the supply of loanable funds available to businesses, because the government must borrow to fund its deficit.
As a result, an increase in the budget deficit will make government saving even more negative, which shifts the supply of loanable funds to the left. As Figure 15 illustrates, the new equilibrium following a decrease in saving involves both a higher real interest rate and lower investment. The decline in private investment due to a larger budget deficit is called crowding out because, when the government borrows, it leads to higher real interest rates, which effectively crowds out some of the firms looking for loans to fund their own investments.
On the flip side, shifting from a budget deficit to a surplus will increase public saving, which shifts the supply of loanable funds to the right. The new equilibrium will involve a lower real interest rate and higher investment, effectively “crowding in” extra private investment. This insight motivated President Bill Clinton’s macroeconomic strategy in the 1990s, as he pushed the federal budget from a large deficit into a modest surplus. As our analysis would predict, this led to a decline in long-run real interest rates, which spurred more private investment.
Supply shifter three: Global shocks shift foreign saving.
Foreign saving refers to funding that comes from foreigners lending money to Americans. These funding flows are often called net financial inflows. (The term net means that we’re focusing on the financial inflows coming to the United States from foreigners, less the financial outflows going to foreigners from the United States.)
These international financial flows are an important channel through which the global economy affects the U.S. economy. For example, in the early 2000s, an increase in saving in the rapidly growing Asian countries and the oil-producing Middle East caused a global glut of saving. The United States is a relatively attractive destination for these funds, and the resulting increase in foreign saving shifted the supply of loanable funds to the right. As Figure 15 suggests, this pushed down the neutral real interest rate.
Shifts in the Demand for Loanable Funds
The demand for loanable funds reflects businesses borrowing to fund their investments. This means that any factor that shifts the investment line—which describes how much investment businesses will undertake at each real interest rate—will also shift the demand for loanable funds. And so based upon our earlier analysis, it follows that the demand for loanable funds will increase, shifting to the right in response to:
- Technological advances that make capital equipment more productive
- Expectations of stronger future revenues
- Corporate tax cuts that mean businesses keep more of their revenues
- Easier lending standards that allow more businesses to qualify for a loan, or if businesses have larger cash reserves many won’t need a loan to fund their investments.
Figure 16 illustrates (in purple) an increase in investment, which shifts the demand for loanable funds to the right, will lead to a higher real interest rate. If any of these factors shifts in the opposite direction, it will lead to a decrease in investment, which shifts the demand for loanable funds to the left (shown in green), leading to a lower real interest rate.
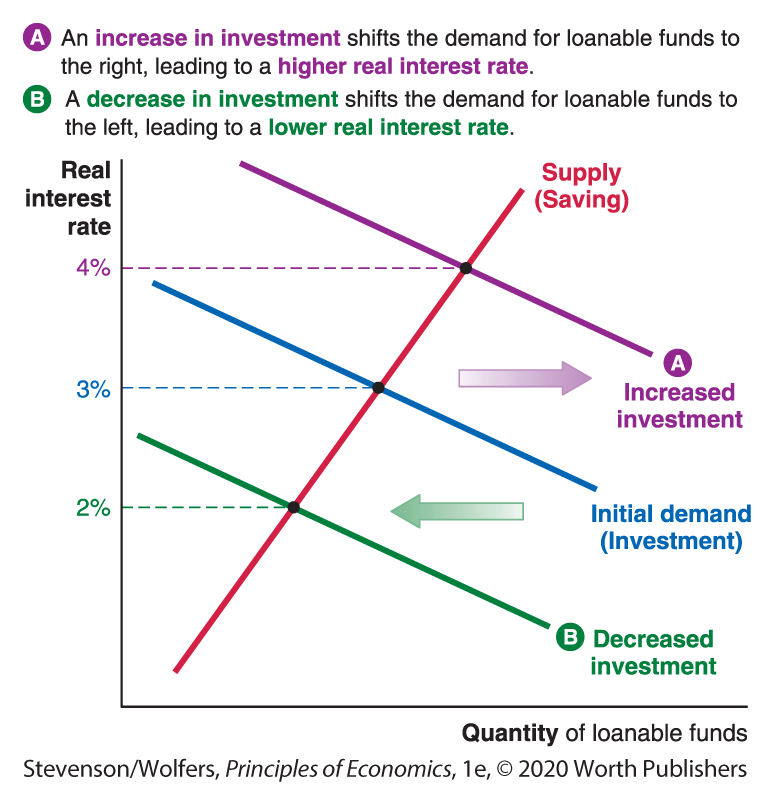
Figure 16 | Shifts in the Demand for Loanable Funds
Interpreting the DATA
Secular stagnation and the declining real interest rate
Several long-term trends have also led to a decrease in the demand for loanable funds. First, population growth is slowing, and fewer new workers mean less investment is required to equip them. Second, the modern economy is increasingly powered by technology firms, which don’t use much physical capital. For instance, WhatsApp grew to be worth about as much as Sony without building a single factory. And third, as capital equipment—particularly computers—becomes cheaper, businesses need fewer funds to meet their equipment needs.
Each of these factors shifts the demand for loanable funds to the left. And together, they help explain why Figure 17 shows that the neutral real interest rate has declined to very low levels since the turn of the century, a trend sometimes called “secular stagnation.”
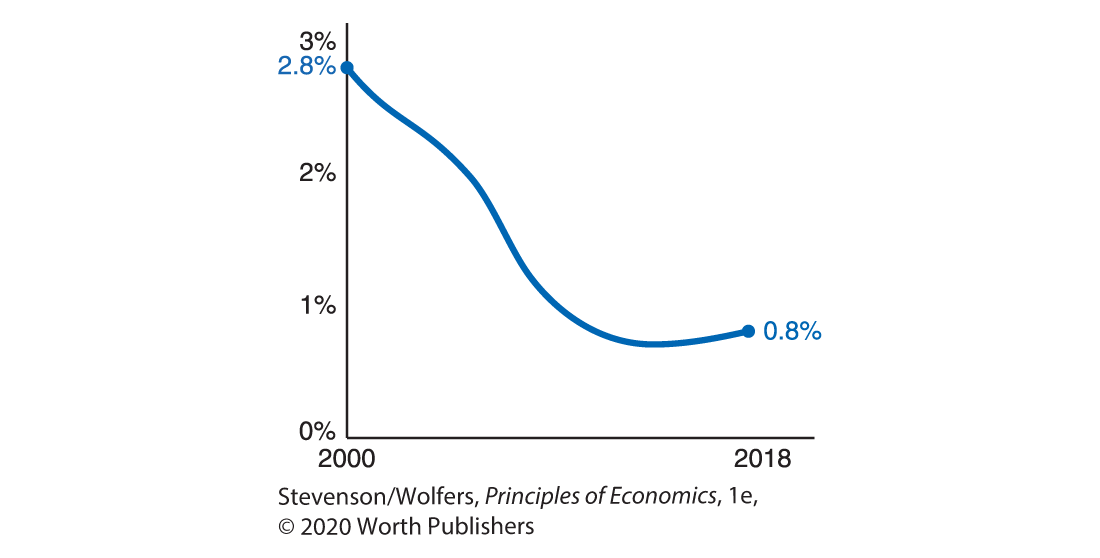
Figure 17 | Estimates of the Neutral Real Interest Rate
Data from: Federal Reserve Bank of New York.
Do the Economics
Think you’ve got this stuff all figured out? Okay, let’s practice by predicting how the neutral real interest rate will respond to changing economic conditions. To do this, apply the same three-step recipe that you can use to predict the results of any supply-and-demand analysis:
- Step one: Will this shift saving and hence the supply of loanable funds, or will it shift investment and the demand for loanable funds?
- Step two: Is that shift an increase, shifting the curve to the right? Or is it a decrease, shifting the curve to the left?
- Step three: How will the price—that is, the neutral real interest rate—change in equilibrium? And what about the quantity of saving and investment?
Now let’s apply this three-step recipe to the follow scenarios:
- The government cuts corporate taxes, so businesses get to keep a larger share of their revenues.
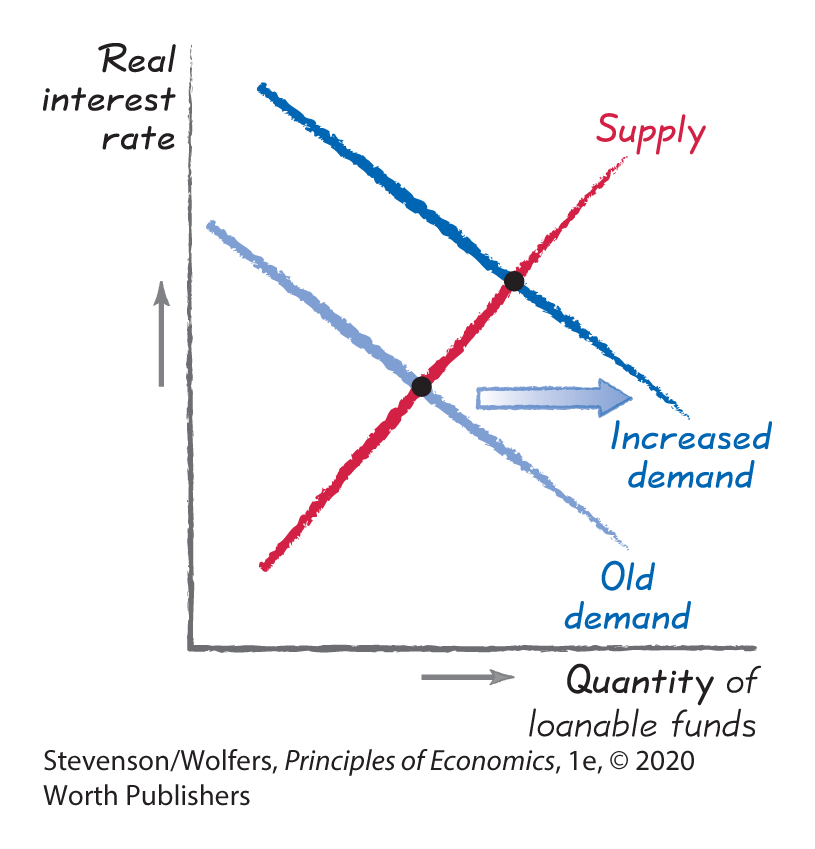
- A tax cut makes investment more profitable so investment will rise.
- → Increased demand for funds
- Result: Higher real interest rate, with more saving and investment.
- Political strife overseas makes foreign savers look for a “safe haven” to park their money.
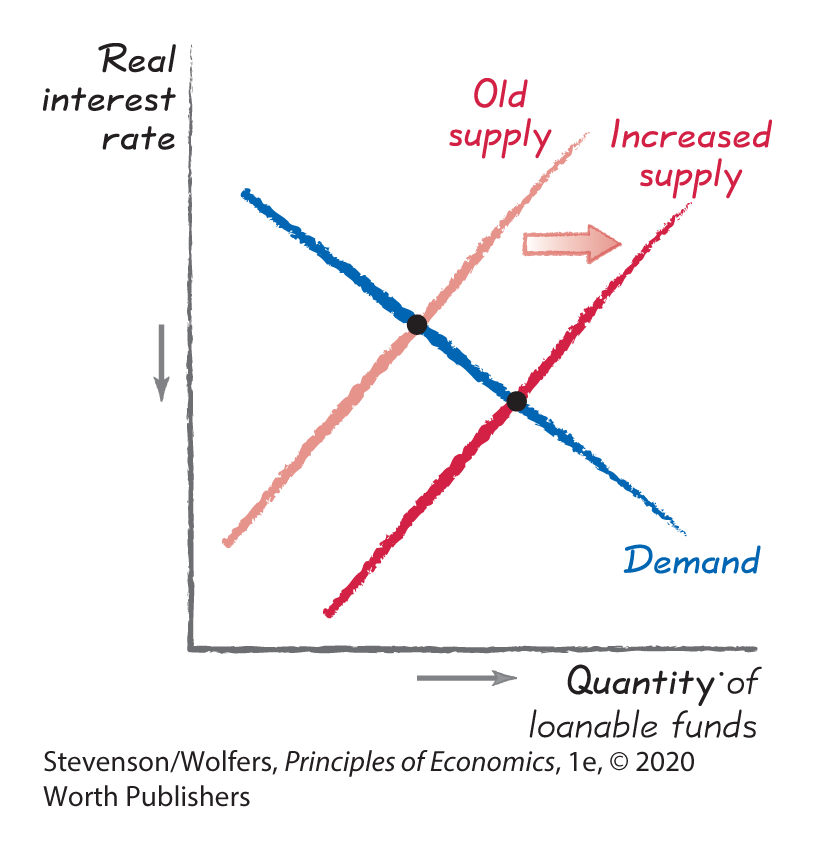
- The United States is a safe haven, so foreign saving will rise.
- → Increased supply of funds
- Result: Lower real interest rate with more saving and investment.
- The federal government embarks on a major spending program that puts the budget into deficit.
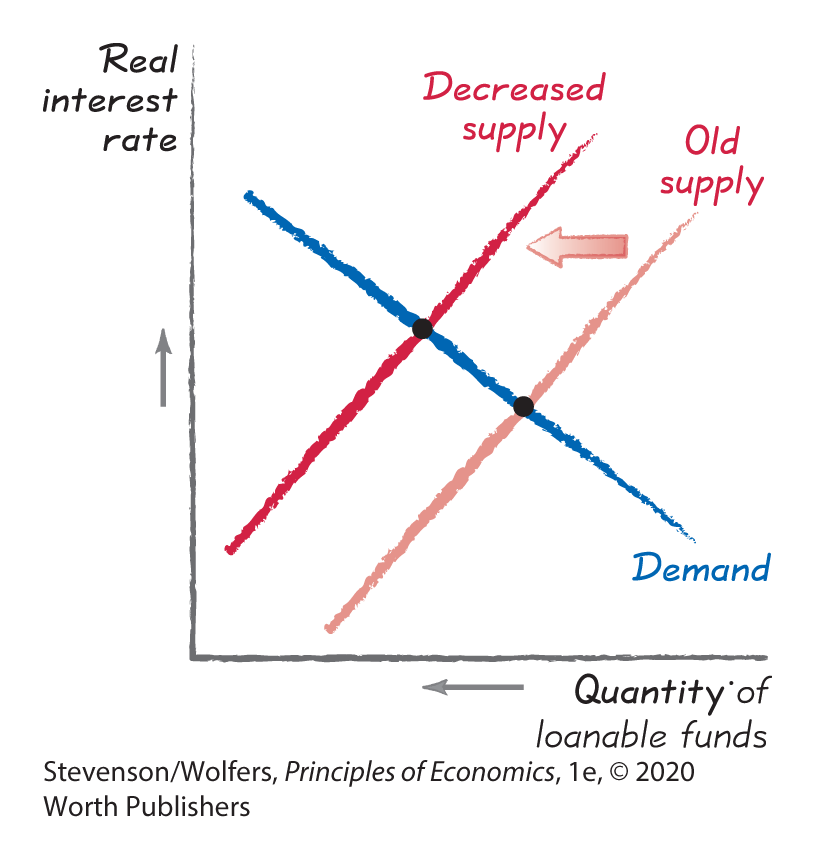
- A budget deficit will decrease public saving.
- → Decrease in supply of funds
- Result: Higher real interest rate with less saving and investment.
- As more students go to college, an increasing share of parents open college savings accounts.
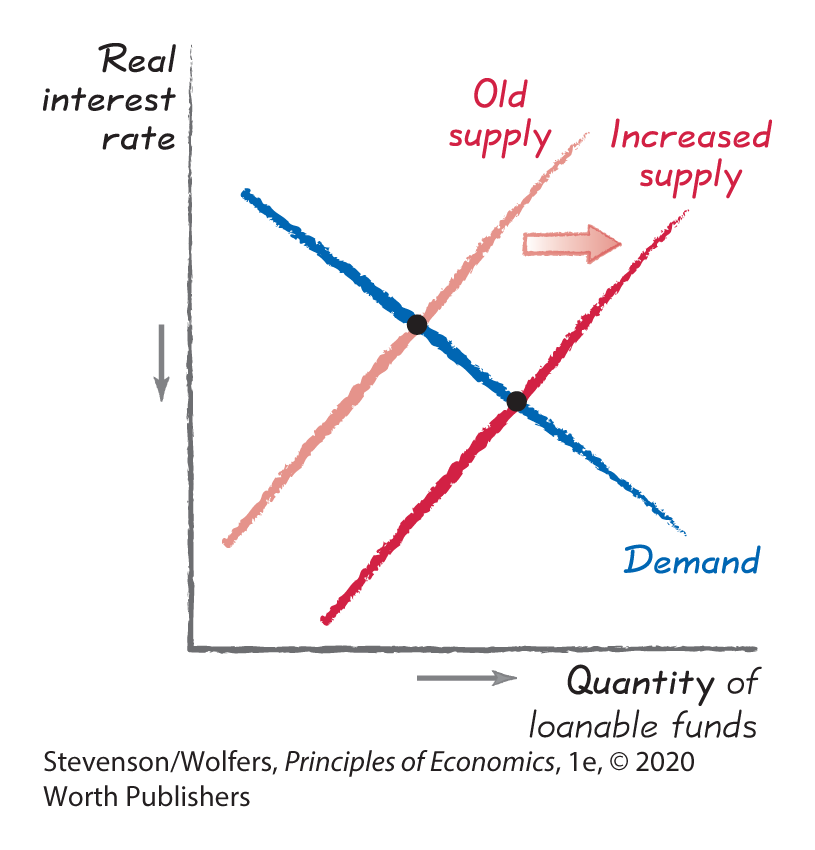
- More people putting away money means private saving will rise.
- → Increased supply of funds
- Result: Lower real interest rate with more saving and investment.
- Business executives expect their profit margins to decline over the next decade.
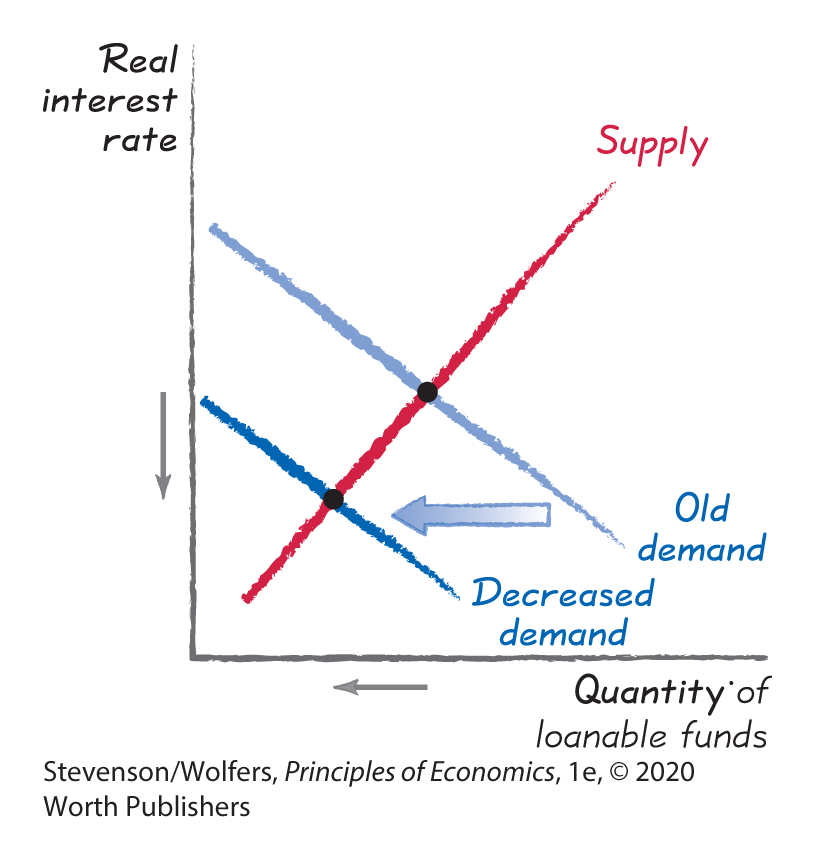
- Lower future profits will reduce investment.
- → Decrease in demand for funds
- Result: Lower real interest rate with less saving and investment.
- The nominal interest rate rises by 2% in response to inflation rising by 2%.
- Trick question: Saving and investment respond to the real interest rate, not the nominal rate. An unchanged real interest rate has no effect on the supply or demand for loanable funds.

