27.4 What Drives Financial Prices?
Our next task is to ask: What drives financial prices? We’ll focus most of our discussion on what drives stock prices, but as you read, you’ll find this material even more useful if you think about how similar ideas apply to the price of other investments. After all, many of the same motivations that lead people to buy and sell stocks lead them to buy and sell other assets such as real estate, fine art, and even truly unusual assets such as alpacas. In each case, you’re buying an asset with a limited intrinsic value—perhaps the possibility of a stream of payments if your stock pays a dividend or someone rents your house—and also the potential for big profits or losses if their prices shift sharply.
Valuing Stocks
What determines the price of a stock—or indeed, any other financial asset? As with just about everything else, it’s all about supply and demand. Figure 6 shows that the price of a stock reflects the same forces as in any other market. There’s a demand curve for Nike stocks describing how many shares investors will buy at each price, just as there’s a supply curve describing how many shares investors will sell at each price. As in other markets, the price moves to the equilibrium point where supply equals demand.
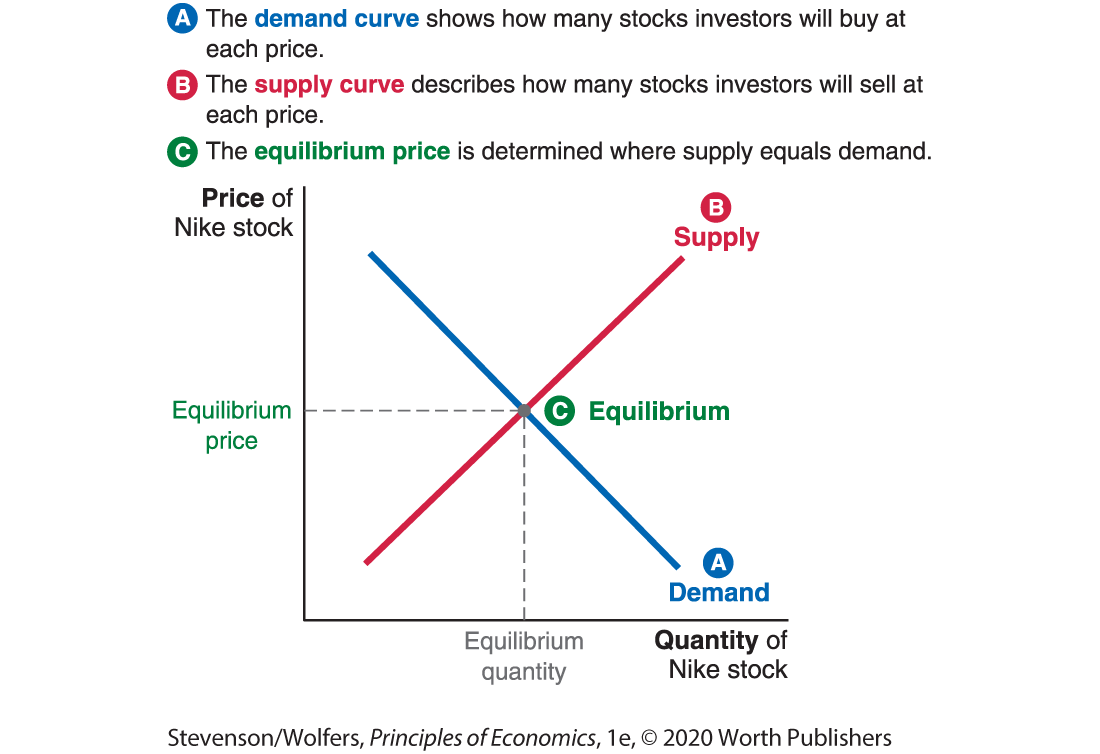
Figure 6 | The Market for Nike Stock
The only real difference is that as a savvy investor, you’re on both the demand and supply side of the market. If the price of Nike stock is low enough, you’ll conclude that it’s such a good deal that you’ll want to buy it, while if the price is high enough, you’ll want to sell it, making you a supplier.
This pushes the question one level deeper: What determines the price at which investors are willing to buy or sell stock? Let’s explore some of the different approaches that investors use to value financial assets, including stocks.
Fundamental value is the present value of future profits.
The goal of fundamental analysis is to assess an asset’s fundamental value. The starting point comes from recognizing that the benefit of owning stock is that it entitles you to a share of a company’s future profits. As such, the fundamental value of a business is the present value of the future profits it will earn. The fundamental value of a firm determines the fundamental value of stock in that firm. A stock is a good deal when its price is below its fundamental value.
Assessing a business’s fundamental value is a four-step process.
- Step one: Forecast future profits. Analysts typically build sophisticated spreadsheet models that project the business’s revenues and costs in each of the next 5–10 years. The difference between revenues and costs is the business’s expected profits for that year. Beyond that time horizon, analysts usually make their projections by assuming that profits will continue to grow at some constant rate, perhaps reflecting the broader growth rate of the industry.
- Step two: Discount these profits. The opportunity cost principle reminds you that tying up your money comes with an opportunity cost—you could invest that money in something else. Consequently, you should convert each year’s profits into their present values to account for this opportunity cost using the discounting formula we introduced in the last chapter. When you’re evaluating a risky stock, make sure to use a higher discount rate because the opportunity cost is investing in another risky stock, and riskier stocks typically earn a higher return.
- Step three: Add up the sum of those discounted future profits. The sum of the present value of all of Nike’s future profits is your estimate of Nike’s fundamental value.
- Step four: Divide the company’s fundamental value by the total number of shares. There are 1,600,000,000 Nike shares and each has a claim on Nike’s future profits. So the fundamental value of a single Nike stock is 1/1,600,000,000 of the company’s fundament value.
If you find Nike stock cheaper than this, then the cost-benefit principle says you should buy the stock. If you’re right, and the stock price heads toward its fundamental value, you’ll be able to sell the stock for a profit. But even if the market never corrects itself, you can hold that Nike stock, and your calculations suggest that over the long term you’ll enjoy a stream of dividends that’s more valuable than the price you paid for it.
Here’s the big caveat: This investment strategy will only succeed if your estimate of Nike’s fundamental value is more accurate than the stock price. If it’s not, you may think you’re buying an underpriced stock, but actually end up buying an overpriced one.
Relative valuation relies on comparable businesses.
An alternative approach, called relative valuation, assesses the value of an asset by comparing it to similar assets. In the simplest form of relative valuation, you assess the price of something by comparing it with an almost identical “twin.” For example, relative valuation says that if a two-bedroom fourth-floor apartment sold for $120,000, then the value of the almost identical apartment across the hallway is also $120,000. Of course, this only makes sense if the first apartment was sold at an appropriate price.
Relative valuation gets a bit more difficult when you can’t find an identical twin. For instance, no company is anywhere near being Nike’s twin—Nike is more than twice the size of its nearest competitor, Adidas (and is 10 times larger than Under Armour). To get around the problem of comparable size, you can look at financial ratios that abstract from each firm’s size. Two of the relative-valuation ratios used by Wall Street analysts are:
- Price-to-book ratio, which measures a firm’s stock price relative to the book value per share, which is a measure of the business’s net assets per share (calculated as total assets less liabilities). If Nike uses its assets to generate profits at a similar rate as Adidas, then both Nike and Adidas should have a similar price-to-book ratio.
- Price-to-earnings ratio, which measures a firm’s stock price, relative to last year’s profits, measured as earnings per share. The idea is that a company with twice the earnings of Adidas should be worth twice as much. If this is true then Nike and Adidas should have a similar price-to-earnings ratio.
Do the Economics
Use relative valuation to price Nike’s stock.
Figure 7 contains some key 2016 financial data for Adidas, which is one of Nike’s key competitors. We’re going to use these numbers to estimate Nike’s value.
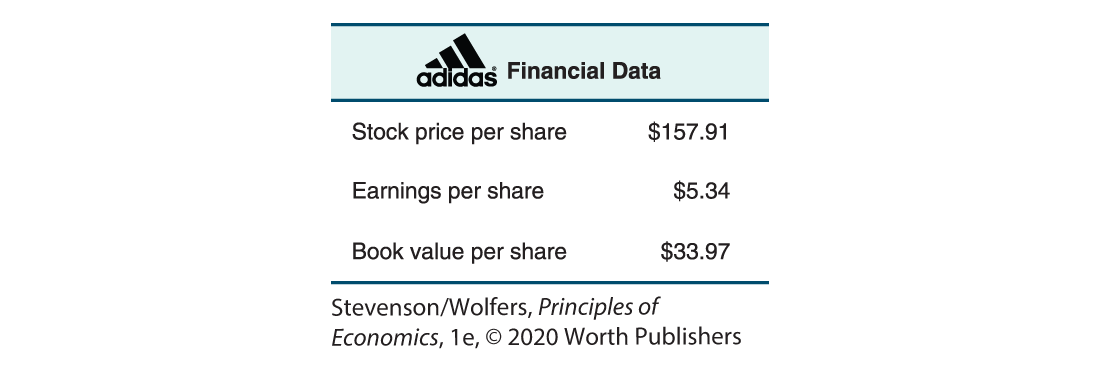
Figure 7 | Adidas Financial Data
2016 Data from: Bloomberg.
- Calculate the price-to-book ratio for Adidas stock.

- Calculate the price-to-earnings ratio for Adidas stock.

Okay, let’s use your calculations to value Nike’s stock.
- Nike’s book value per share was $7.31. If Nike can produce the same price-to-book ratio as Adidas, what’s the value of Nike stock?

- Nike’s earnings per share was $2.16. If Nike had the same price-to-earnings ratio as Adidas, what is the value of Nike stock?

Okay, we’ve used two relative-valuation techniques, and they give different values. One says that Nike stock was worth $64, while the other says it was worth $34. In fact, during 2016, Nike’s stock price fluctuated between $49 and $64, suggesting that these valuations gave a pretty good indicator of the price at which investors were willing to buy and sell Nike stock.
The key to getting a relative valuation right is to make sure that you’re comparing companies that are otherwise quite similar. This means that you should only compare Nike to companies with similar risk, growth prospects, and funding needs. But this doesn’t mean just comparing Nike to other sporting goods companies. Some analysts have argued that Nike should also be compared with other shoe companies, such as Crocs, fashion companies, such as Ralph Lauren, or luxury brands, such as Coach.
EVERYDAY Economics
How much should you pay for that house?

What’s a good price for this tiny house?
You can apply the same principles you use to value stocks to figure out how much you’re willing to pay for a house.
Just as the fundamental value of a business derives from the profits it delivers each year, the fundamental value of a house derives from the “profit” you make from not having to pay rent each year. And just as you can figure out how much a stock is worth by adding up the present value of these future profits, you can figure out how much a house is worth by adding up the future value of the rent that you’d otherwise have to pay to enjoy equally nice housing.
You can also use relative valuation to value a house. If you can’t find a twin for the house that you’re buying, focus instead on a relative-valuation ratio. The most common ratio investors use when valuing houses is the price-to-size ratio. As with all relative-valuation techniques, it’s important to compare like with like, and in this case, it means comparing houses of a similar quality in a similar neighborhood. If similar-quality houses in your neighborhood typically sell at a price-to-size ratio of around $100 per square foot, then this approach says that a 2,000-square-foot house will sell for around $200,000. It also says that a 400-square-foot tiny house will sell for $40,000.
The Efficient Markets Hypothesis
Nike’s stock price is determined by supply and demand. Demand to buy Nike stock comes from investors who believe that its fundamental value is higher than the price. Supply of Nike stock comes from investors who want to sell it because they believe its fundamental value is lower than the price. In equilibrium, demand equals supply, which means that Nike’s stock price moves to the exact point where there are as many bets placed that it is overpriced as there are that it is underpriced. This perspective suggests that a stock price represents the market’s collective judgment about a company’s fundamental value.
Stock prices reflect all publicly available information about a company’s fundamental value.
When an analyst discovers some good news for Nike—perhaps the cost of rubber used to make sneakers will be a little lower—it leads her to upgrade her assessment of Nike’s value. As a result, the fund she manages will buy more stock in Nike, and this extra demand will nudge the price up. Another analyst discovers some bad news—sales are slow in Malaysia!—leading his fund to sell the stock, which nudges the price down.
As thousands of analysts dig into the details, Nike’s stock price will come to reflect all of this information. That’s the idea behind the efficient markets hypothesis, which holds that at any point in time, financial prices reflect all publicly available information.
It’s tough to beat the market.
The efficient markets hypothesis doesn’t mean that a stock’s price is always exactly equal to its fundamental value. Rather, it says that it’s impossible to predict whether it is under- or overpriced based on publicly available information.

Everyone at the flea market is hoping they’ll find an underpriced treasure.
This explains why it’s so hard to make money buying and selling stocks. As a savvy investor, you’re looking to buy a stock whose fundamental value is higher than its price. But the efficient markets hypothesis says that it’s impossible to tell whether a stock is under- or overpriced—or at least it’s impossible unless you have inside information, and it’s illegal to trade on inside information. (That’s called insider trading.) The market includes many traders, each of them diligently looking for an edge. If any information indicated that Nike were underpriced, all these traders would have already snapped up the Nike stock, thereby bidding the price back up to its fundamental value.
The same idea applies to other financial markets, too. Billions of dollars’ worth of bonds and foreign currencies are traded every day, with thousands of analysts and traders looking for every little edge. As such, it’s nearly impossible to identify a bond or foreign currency that is undervalued.
Some markets are less competitive. For example, the market for houses, Picassos, and baseball cards may not be perfectly efficient. But even so, there are enough smart cookies trading these assets that even sophisticated professional investors find it very difficult to identify undervalued assets. That’s why people digging through flea markets for undervalued antiques typically end up with little to show for their efforts.
Financial prices move unpredictably.
The logic of the efficient markets hypothesis also suggests that it will be impossible to predict whether stock prices will rise or fall over the next minute, hour, day, week, or year. After all, if there’s information suggesting that the stock price should rise next Friday, then some trader will figure out they can make money by buying the stock on Thursday to sell on Friday afternoon. You could beat them to it by buying the stock on Wednesday instead, but some smarty might jump ahead of you and buy stock on Tuesday. Follow the logic far enough, and you’ll see that people buy and sell stock today based on news about the future, and they’ll do this to the point that they eliminate any predictable future stock price changes.
If forward-looking traders eliminate all predictable stock price changes, all that’s left will be unpredictable changes. This logic suggests that stock price changes are unpredictable. This is really just an application of the idea that stock prices already reflect all publicly available information—in this case, it says that the stock price already reflects the information that would otherwise cause the stock price to rise or fall in the future. When a price moves in an unpredictable way, we say it follows a random walk, which means that it follows an unpredictable path.
Technical analysis looks for patterns—even where none exist.
All this means that technical analysis—studying graphs of financial prices over time, finding patterns, and trying to use those patterns to predict the future—doesn’t really work. You can’t make money predicting the unpredictable. This can be hard for people to believe. Humans have an instinctive need to try to find order among chaos, and that instinct can easily lead you to believe that you can spot patterns even where none exist.
A random walk doesn’t mean that stock prices move in any crazy old way. Good news still means that a stock price will rise, but the stock price will rise as soon as traders get wind of it, which may even be before the positive outcome occurs. For example, the stock of a pharmaceutical company will rise as soon as investors learn that the company has a new allergy drug. And it will rise again when they learn that the new drug has been approved by the FDA. By the time the company actually shows a profit from selling you the drug to treat your allergies, all those profits are already expected by stock holders and thus are reflected in the stock price.
Do the Economics
Can you predict stock price movements?
Let’s test out this random walk idea. Can you predict whether stock market prices will rise or fall? Figure 8 shows stock price data for a random month for each of 99 leading stocks. If you think the stock rose the next day, mark it with a ✓, but if you think it fell, mark it with a ✗.

Figure 8 | Can You Predict Whether These Stocks Will Rise or Fall Next?
Data from: Bloomberg.
Answer: Hey, make sure you’ve finished making your predictions before you look up the answer! Seriously. Finish it first.
Okay, so now you’re really done? If there’s a period at the end of a stock’s name, that means the stock rose the next day.
How did you do? Most students get roughly as many right as they get wrong—somewhere between 44 and 55 out of 99—which is just what the random walk theory suggests. Occasionally there’s a student who gets a few more right than wrong, but the margin is still small enough that it could be luck.
The Value of Expert Advice

Orlando wasn’t quite purrfect, but he beat three pros.
A few years back, an English newspaper ran a stock-picking contest pitting a leading wealth manager, a stockbroker, and a fund manager against a ginger cat called Orlando. The investment pros did what investment pros normally do, crunching reams of data to find what they considered the best stocks to buy. By contrast, Orlando threw his favorite toy mouse onto a grid representing different stocks. At the end of the year, Orlando had beaten the pros.
That’s nuts, right? Wouldn’t you figure that knowing nothing about stocks—or being a cat—would be a severe handicap in a stock-picking contest?
Not so fast, says the efficient markets hypothesis. If it’s impossible—or at least really difficult—to beat the market, then it must also be really hard to do worse than the market. After all, if Orlando really were a worse stock picker on average, then you could make money just by doing the opposite of whatever he did. It follows that if the efficient markets hypothesis is right, Orlando is as good at picking stocks as any investment professional. (And in this case, he got a bit lucky and beat them.) This is the logic that once led an economist to claim that “a blindfolded monkey throwing darts at a newspaper’s financial pages could select a portfolio that would do just as well as one carefully selected by the experts.”
Thousands of researchers—including both university professors and Wall Street quants—have conducted careful studies trying to assess whether they can predict where stocks are going. The conclusion tends to be that it’s incredibly hard to predict stock prices, although it may not be impossible. You’ve probably heard of Warren Buffett—he’s made billions by seeking out businesses that he thinks are undervalued. But while everyone wants to be like Buffett, few have been able to mimic his success.
Not even experts can beat the market consistently.
In fact, here’s the surprising truth about financial analysts: While some make money, even more lose money, relative to a strategy of just buying a small chunk of each company. So what keeps these analysts going? The short answer is that the money they’re losing belongs to investors like you, and people like you keep hoping that they’ve found the right financial expert that will allow them to beat the market. But hope isn’t reality, and you probably haven’t found one of the handful of financial whizzes who can beat the market.
To see this, let’s consider how the typical person invests in the stock market. Most people invest through mutual funds, which buy a portfolio of stocks (and sometimes bonds) on their behalf. Your employer’s retirement plan will probably allow you to choose from a list of different mutual funds to invest in. There are two types of mutual funds:
- Actively managed mutual funds pay handsome salaries to expert stock pickers who invest your money in the stocks that they think are likely to do particularly well.
- Index funds don’t pay for any fancy stock pickers; instead, they just program a computer to automatically buy every stock that is in the S&P 500 or some other broad market index.
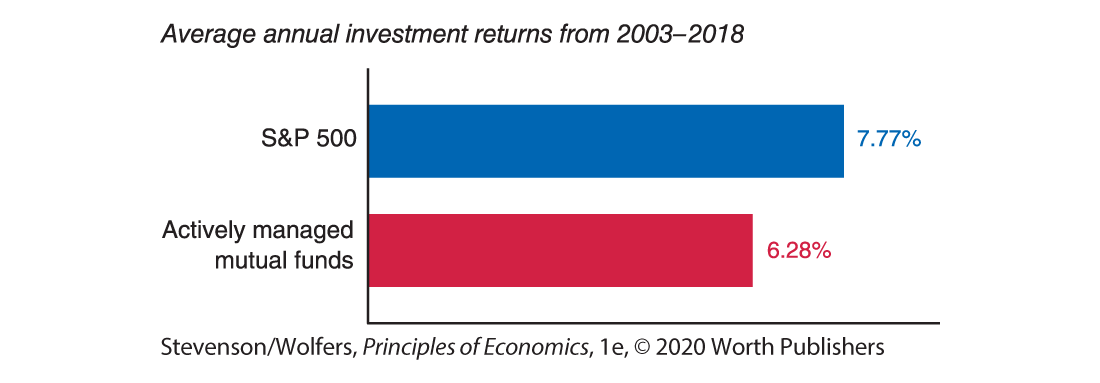
Figure 9 | It’s Hard to Beat the Stock Market
Data from: S&P Dow Jones Indices.
A careful analysis of major mutual funds between 2003 and 2018 found that simply investing in the S&P 500—which is what index funds do and involves no expertise at all—earned an annual average return of 7.77%. By contrast, Figure 9 shows that the average of all comparable actively managed mutual funds run by expert stock pickers earned an annual return of 6.28%. That difference might sound small, but it adds up. A $100,000 investment in the S&P 500 would have grown to $307,000 over this period, while the actively managed funds would have yielded $249,000. You would have netted an extra $58,000 by not hiring an expert stock picker.
What explains this? It’s not that professional stock pickers are particularly bad at picking stocks. Rather, they’re not particularly good. The stocks they pick rise roughly in line with the S&P 500, but they charge you a lot of money for their “expertise.” These high fees make investing with them a bad bet.
Past performance is no guarantee of future performance.
Even so, if you think there are stock pickers who can beat the market, good luck finding them. In my experience, nearly every stock picker will tell you that they’re going to do well in the next few years. Many of them will tout their track records, telling you that they’ve beaten the market in the past. But these same claims always have an asterisk* next to them directing you to the fine print:
* past performance is no guarantee of future performance.
Did you see the fine print? It actually understates the case. It should say this instead:
Past performance is almost completely unrelated to future performance.
Let’s focus on the best-performing actively managed mutual funds over the period 2006–2011. Of the top quarter of these funds, only 20% were in the top quarter again for the 2011–2016 period, which was roughly the same chance that the worst-performing actively managed mutual funds had of being in the top quarter. In other words, past performance didn’t predict future performance.
Whatever made a stock picker do well in the past didn’t much help them in the future. It’s the sort of pattern that suggests that none of them are better than the market all the time, but some of them get lucky some of the time.
Remember Warren Buffett? A few years ago he offered to bet that the S&P 500 stock index would outperform the most actively of managed funds—known as hedge funds—over 10 years. Buffet said that he waited expectantly for “a parade of fund managers … to come forth and defend their occupation.” After all he said, if they were so confident in their ability why wouldn’t they put a little of their own money on the line? Well, there was a good reason that only one person took the bet: That person lost. The loser conceded, stating, “Passive investing is all the rage today.” Why? Because the difficulty of beating the market means that your portfolio will grow faster if you put your money in well-diversified index funds.
EVERYDAY Economics
How to invest like an economist
What do economists do with their own money? Given the evidence so far, you won’t be surprised to hear that most of them invest in well-diversified index funds. Figure 10 shows the results of a survey that asked economists how they handle their money. Buying all 500 stocks in the S&P 500 ensures that you have a well-diversified portfolio. An index fund doesn’t pay for any fancy stock pickers, which helps them keep their fees really low. The best of these funds are so lean that they have very few expenses—about 0.2% of the money they’re handling for you, compared to a number closer to 1% or sometimes as much as 2% for an actively managed mutual fund. Economists ignore past stock-picking performance because it doesn’t predict future performance. The only indicator they focus on is the fees that are charged, which are sometimes called expense ratios. They focus on fees because they’re the best predictor of a fund’s returns. After all, even if it’s hard to predict good stocks, it’s easy to predict that paying high fees will make you poorer. While saving a fraction of a percentage point on fees each year doesn’t sound like a big deal, it is. If you put $100,000 in an index fund for 30 years and let it compound, you’ll end up saving around $120,000 in fees if you choose the lowest-cost option.
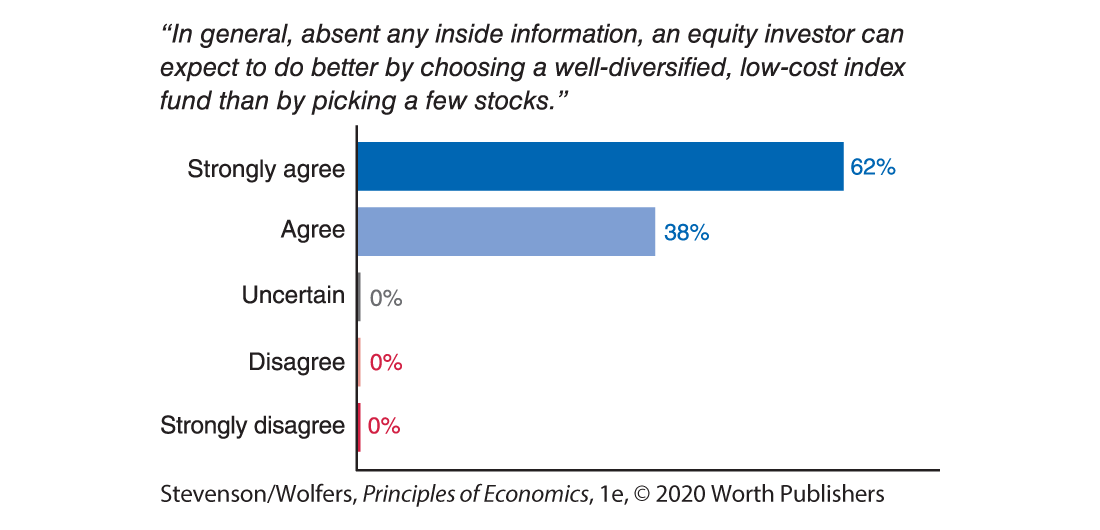
Figure 10 | How Economists Handle Their Money
2019 Data from: University of Chicago’s Booth School of Business.
The efficient markets hypothesis teaches you the value of modesty.
There’s so much money to be made by whoever can figure out how to predict which stocks will rise, and when, that it remains a hot area of research. For now, it’s probably best to say the debate is between those who think that the efficient markets hypothesis is right most of the time, versus those who think it’s right nearly all of the time. If you can be first to bring new information to the market, you can probably profit from it, but realize that new information gets incorporated so quickly that you might only have milliseconds to react.
More importantly, even if you don’t believe the efficient markets hypothesis is exactly right, it sounds an important warning that you should always bear in mind: Be modest about your ability to pick stocks, or indeed any financial asset. Before you trade, you should ask yourself: Is it likely that the market has overlooked the information you’re relying on? Is it likely that your analysis is smarter than the collective wisdom of thousands of traders who spend their lives studying that stock? Always remember that if a stock’s price doesn’t align with your valuation, there’s a good chance that it’s your valuation that’s wrong, rather than the stock price.
The stock market can help predict economic changes.
Experts find it hard to beat the stock market because market prices already embed so much expertise and information. But this also means that stock prices reflect what people think will happen to individual companies and the economy overall. If stocks in many companies are rising, that’s a signal that traders are expecting good times ahead, and if stocks are falling, that’s a signal that perhaps there’s bad news ahead. As Figure 11 shows, the S&P 500—which is a broad indicator of stock prices—tends to rise in anticipation of a strong economy, and fall in anticipation of an economic downturn.

Figure 11 | Stock Prices Predict GDP
Data from: Bureau of Economic Analysis; Bloomberg.
As a result, stock prices are a closely watched macroeconomic indicator. That said, stock prices are extremely volatile, and not every blip translates into changing economic conditions. In fact, sometimes stock prices do some pretty puzzling things, which brings us to our next topic: stock market bubbles.
Financial Bubbles
As the internet economy started to blossom in the late 1990s, Silicon Valley became an extraordinary, almost magical place. New companies sprang up nearly every day, and many enjoyed explosive growth. The internet was the Wild West, and young programmers were the settlers making their fortune as they explored the new frontier. Amazon, eBay, and Google were born, and their founders became incredibly rich. Tech-savvy students across the country hoping to replicate this success dropped out of college and headed west to form start-ups. It seemed like anyone with a good idea, and some with a bad idea, could get funding with a snappy-sounding pitch to hungry investors.
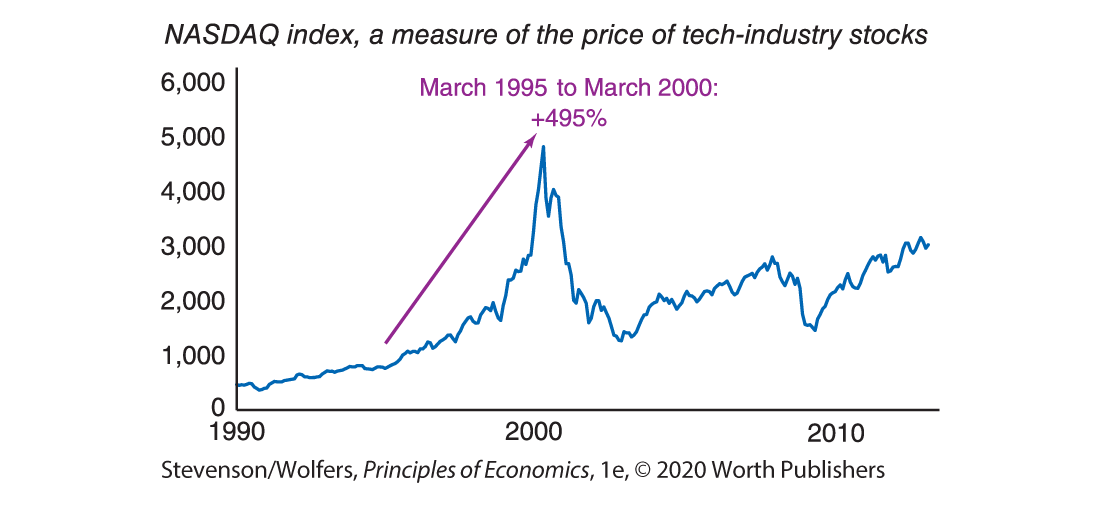
Figure 12 | The Dot-Com Bubble
Data from: NASDAQ QMX Group.
Investors were excited for a piece of the action, paying increasingly higher and higher prices for stock in these young companies. By March 2000, this building excitement had led the price of the NASDAQ index—a basket of mainly tech-related stocks—to rise by 495%, as shown in Figure 12. Some companies that had never made a profit were priced as if they were worth billions. For instance, stock in a grocery delivery service called Webvan rose so high that the company was valued as if it were worth $6 billion, even though it had less than $5 million in revenue at the time and was operating at a loss. The price of many of these technology stocks were disconnected from their future profits.

Not worth $6 billion.
When the price of an asset—like a stock—rises above what appears to be its fundamental value, we call it a speculative bubble because prices are highly inflated. And just like a bubble, it can keep inflating for a while, until POP!, it bursts. In March 2000, the dot-com bubble burst, and the value of these stocks plummeted. Webvan’s stock price fell from $25.44 to $0.06, before it went bust, along with dozens of other dot-com hopefuls. If you had invested $1,000 in the NASDAQ in March 2000, it was worth only $260 two-and-a-half years later.
What could possibly lead to a bubble like this? To answer that, we’ll have to talk about cute puppies.
The stock market is like a puppy beauty contest.
One view of the stock market is that it’s like a puppy beauty contest. Here’s how: In a puppy beauty contest, there are photos of a bunch of puppies, and if you correctly guess which is most popular—that is, the one that most people guess to be cutest—then you’re eligible for a prize.

- It’s your choice now:
- Which puppy would you pick?
- (Hint: If you’re thinking, “Which puppy is cutest?” think again.)
The best strategy isn’t to pick the cutest puppy. It’s to pick the puppy that you think others are most likely to think is cutest. Or go a step further: You want to pick the puppy that you think others are most likely to think that others will pick. And so it goes on. Keep thinking this way, and soon enough, you won’t be thinking about which puppy is cute at all, but rather you’ll focus on other people’s expectations about other people’s expectations.
How does this relate to stocks? Stock buying behavior can resemble a puppy beauty contest because what a stock is worth is what someone else will pay for it. So, instead of picking the stock that is the soundest investment, you might pick the stock that you think others will soon bid up. This idea, that people buy an investment because they expect other people to buy it from them at a higher price, is called the “greater fool” theory because it means that you’ll buy a stock (like Webvan) at five times what it is really worth, as long as you think there’s some greater fool out there who will be willing to pay 10 times what it is worth next week. If everyone believes that everyone else believes that tech stocks will keep rising, then everyone will keep buying tech stocks in hopes of selling them later at an even higher price. And that’s how a bubble keeps getting inflated.
This is not an investment strategy that I recommend. While it’ll work for a while—as long as the bubble keeps inflating—all bubbles eventually burst, and one day you’ll wake up to discover that you can’t find a “greater fool” willing to overpay for your overpriced stock. This happened to tech stocks in 2000, and when the market crashed, it wiped out many people’s life savings.
Even if it’s a bubble, it might not be about to burst.
Our analysis of stock market bubbles is not quite complete. There’s one remaining mystery: Why aren’t speculative bubbles stopped by other investors taking the opposite position? There are three key reasons why bubbles persist.
- Reason one: It can be hard to spot a speculative bubble. The internet was new and exciting, and no one really knew how much it would transform the global economy. You might suspect that Webvan is overvalued, but in the excitement over the internet, you convince yourself that maybe it’ll be the next generation’s Walmart.
- Reason two: Even if you spot a speculative bubble, it can be hard to bet against it. Okay, you think Webvan stock is overpriced. Now what? You won’t buy it, but beyond that, if there’s no easy way to bet that a stock will go down, the price won’t reflect your opinion.
- Reason three: You don’t know when the bubble will burst. Tony Dye was a British money manager who understood that dot-com stocks were in a bubble. He sold all his tech stocks and warned his clients to stay out. Eventually, he was proven to be correct. But not for a few years. Meanwhile, his clients watched unhappily as their friends got rich buying dot-coms. Tech stocks kept rising, leading newspapers to ridicule Mr. Dye. As his clients abandoned his firm, Dye took “early retirement,” which probably meant he was forced out.
The problem is that a bubble can outlast you. For Tony Dye, the bubble lasted longer than he could keep his job. For investors betting that stocks will fall, the bubble can last longer than your savings. So even when you’re right about it being a bubble, it’s really difficult to predict when it will burst.
EVERYDAY Economics
What do houses, tulips, and alpacas have in common with the stock market?
Speculative bubbles don’t just drive occasional bouts of stock market exuberance—they’re also important in many other markets, too.
Perhaps the most consequential bubble to hit a large number of American families occurred in the early 2000s. Home loans were easy to get, and house prices always seemed to rise. Together, these trends made home ownership seem both accessible and profitable. Some folks bought houses to live in, while others bought them with an eye to making a few quick improvements, and then selling (or “flipping”) them at a higher price. For a while, it worked, and house prices more than doubled in Miami, Tampa, Las Vegas, and Phoenix, as you can see in Figure 13. Then the housing market bubble burst, and house prices fell by half or more. The decline in house prices left many people with debts they could not repay. This was the first domino that caused the financial sector to freeze up in 2008, causing a global recession.
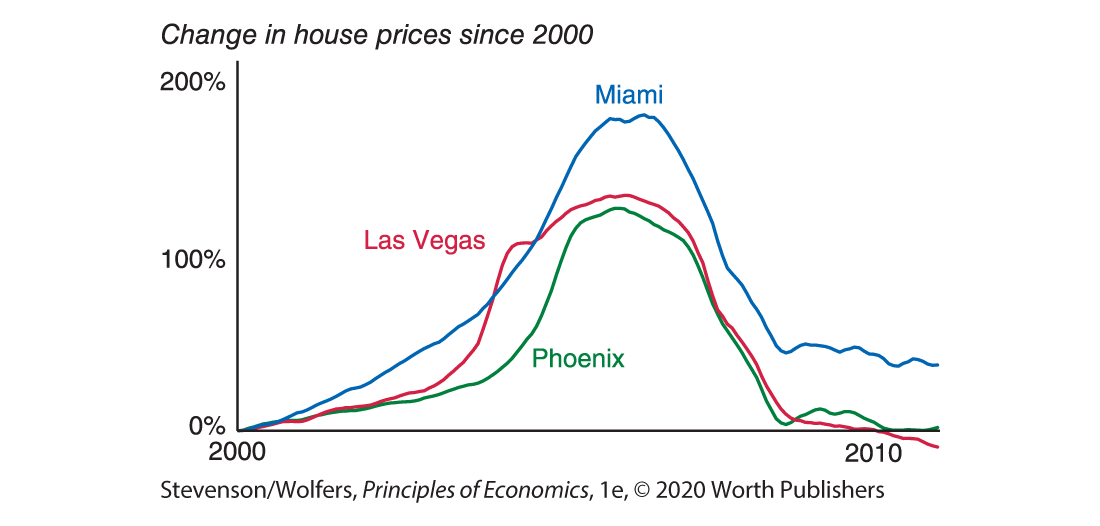
Figure 13 | A Bubble Led to Inflated House Prices … Until It Burst
Data from: S&P Dow Jones Indices, LLC.
Perhaps the strangest ever bubble occurred in seventeenth-century Holland, when investors became enamored with tulips. They saw tulips as valuable because a single tulip could be used to breed more tulips, which could be sold to investors who saw tulips as valuable. At the peak of the bubble, the price of a single tulip bulb rose to the value of a luxury house. You can guess what happened next: The bubble burst, and tulip prices fell by over 95%.

What is this alpaca worth?
A similar story happened with alpacas, the cute South American animals with llama-like long necks, and long eyelashes. In the 1990s and 2000s, American farmers became gripped by an alpaca craze, paying top dollar for alpacas, in hopes of breeding more alpacas that other farmers might pay top dollar for. For a while, it worked, and prices spiraled as high as half a million dollars for a top breeder. But then the bubble burst, and prices plummeted, forcing many investors into bankruptcy. Some were forced to sell their herd for $100 per head or less.

