28.3 Supply and Demand of Currencies
When the Mathisons sell apples to a grocery store chain in Tokyo, they need to get paid in dollars. But a Japanese grocery store does business in yen. Thus international trade is only possible if there’s a market where they can exchange one currency for another. That market is the foreign exchange market. It’s the market in which currencies like the U.S. dollar and the Japanese yen are bought and sold.
The Market for U.S. Dollars

Made in America, with help from foreign investment.
The market for currencies is like any other competitive market, where the forces of supply and demand determine the equilibrium price and quantity. In the foreign exchange market, the products are currencies like the U.S. dollar. Demanders are those, like a Japanese grocery store, looking to buy U.S. dollars in order to purchase U.S. apples. The Japanese grocery store buys U.S. dollars with Japanese yen. Suppliers are folks who are looking to sell their U.S. dollars in return for Japanese yen. For instance, an American camera shop that imports Nikon cameras will supply U.S. dollars in exchange for yen so that it can pay its Japanese wholesaler. The price in this market is the price of a U.S. dollar, which the nominal exchange rate measures as the number of yen you have to pay to buy one U.S. dollar.
There are two main types of international transactions that lead people to demand or supply dollars. First, there are trade flows, such as exports of apples and imports of Nikon cameras. Second, there are financial flows, such as when Toyota invests in building a new factory in the United States, or American investors buy stock in Japanese companies.
The demand for dollars reflects foreigners buying American exports and investing in the United States.
When Japanese consumers want to buy American products—that is, exports from the United States—they need to pay with U.S. dollars. This means that every dollar of exports from the United States creates a demand in the foreign exchange market for one U.S. dollar. Similarly, when Japanese investors want to buy American assets they need U.S. dollars. For example, when Toyota buys or builds a factory in the United States, it needs to buy U.S. dollars to pay for it. Thus, every dollar of financial inflows creates a demand for a U.S. dollar.
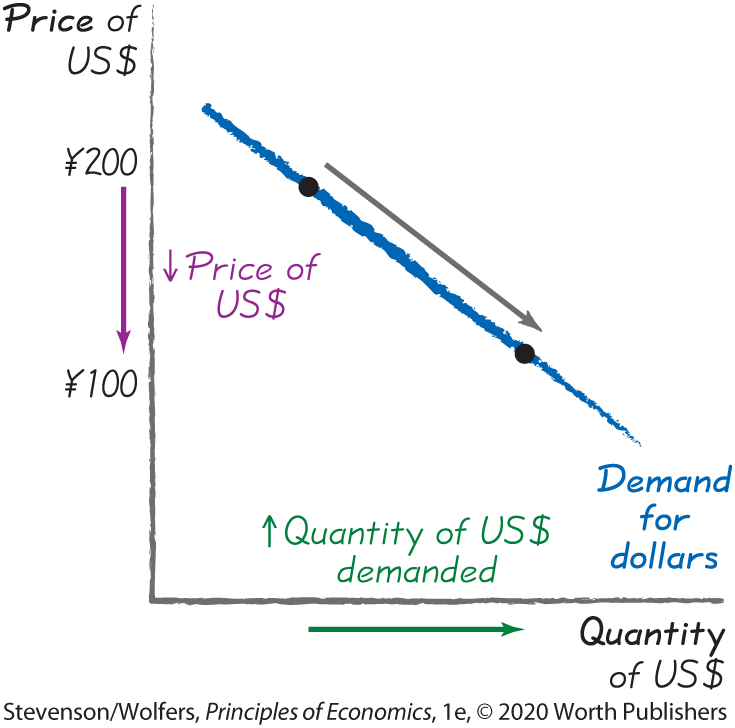
The demand curve for U.S. dollars illustrates how the quantity of U.S. dollars demanded varies with the price of U.S. dollars (which is the exchange rate). This downward-sloping demand curve shows that a lower price for U.S. dollars leads to a larger quantity of dollars demanded. It’s downward sloping because when the price of the U.S. dollar is low, American dollars cost fewer yen. It follows that it costs fewer yen to buy American products. From the perspective of Japanese buyers, it’s like goods exported from America are on sale, so they buy more of them. They’ll need more U.S. dollars to pay for these American exports, and so a lower price for the U.S. dollar leads them to demand a larger quantity of dollars.

The supply of dollars reflects Americans buying imports and investing abroad.
When American buyers pay for Japanese goods—that is, imports into the United States—they need to pay with Japanese yen. They’ll supply U.S. dollars to obtain yen in return. This means that every dollar of imports creates a supply in foreign exchange markets of one U.S. dollar. Likewise, when American investors want to invest abroad, perhaps buying stock in Toyota, they’ll need Japanese yen to do so. Thus each dollar of financial outflows creates a supply of one U.S. dollar.
The supply curve for U.S. dollars illustrates how the quantity of U.S. dollars supplied varies with the price of U.S. dollars (which is the exchange rate). This upward-sloping supply curve shows that a higher price of U.S. dollars leads a larger quantity of dollars to be supplied. It’s upward sloping because when the price of U.S. dollars is high, you’ll get a lot of yen in exchange for your dollars. This means that Japanese stuff is cheaper in terms of U.S. dollars, and so from the perspective of American buyers, it’s like Japanese imports are on sale, and so they’ll buy more of them. If the value of U.S. imports from Japan rises, then Americans will need to exchange more dollars into yen to pay for them. As a result, the higher the price of the U.S. dollar, the higher the quantity of dollars supplied.

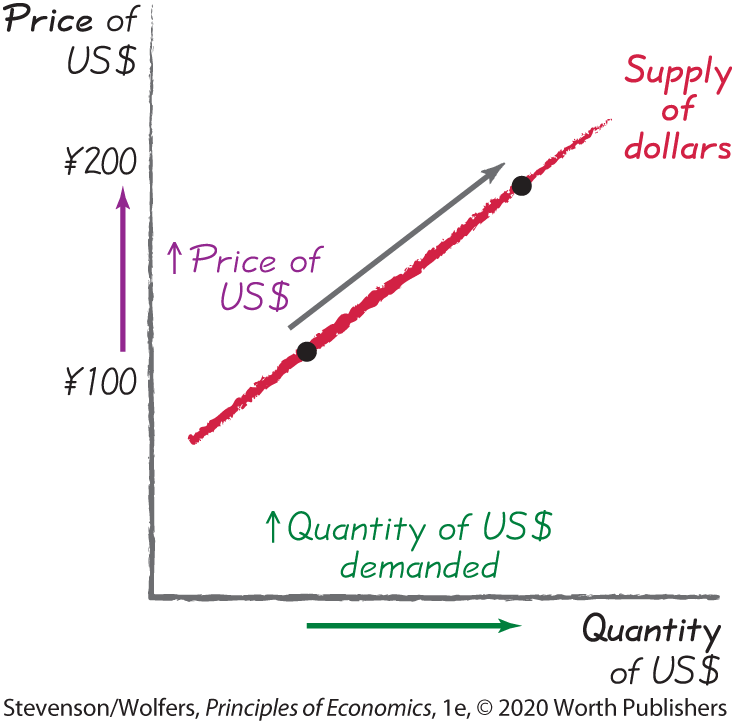
(There’s a subtle issue here: A higher price for the U.S. dollar causes Americans to buy a larger quantity of imports, but the number of dollars required to buy each imported item falls. As a result, the total number of U.S. dollars spent on imports—and hence the supply of dollars—will rise only if the quantity of imports increases enough to offset the decline in price. In reality, that’s what typically occurs, which is why the supply curve is upward-sloping.)
The exchange rate is determined by supply and demand.
The foreign exchange market operates much like any other competitive market, with the forces of supply and demand determining the equilibrium price and quantity. The vertical axis in Figure 10 shows the price of a U.S. dollar, and the horizontal axis shows the quantity of dollars exchanged for yen. The price of a U.S. dollar describes how many yen a buyer has to pay to get one U.S. dollar. The higher the exchange rate, the more expensive the dollar is in terms of yen.
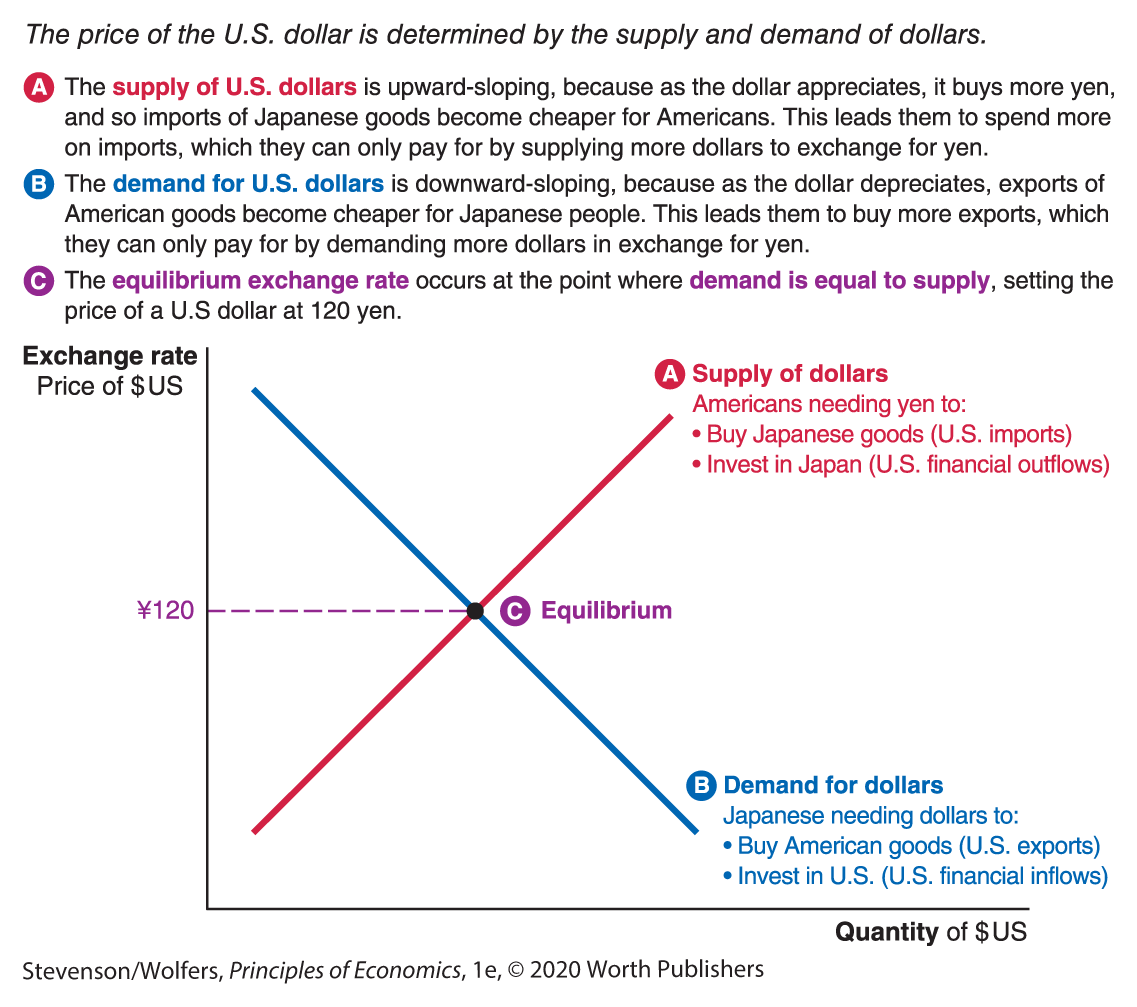
Figure 10 | The Market for U.S. Dollars
Equilibrium occurs at the point where the supply and demand curves cross, and this determines the price of U.S. dollars. Consequently, the equilibrium exchange rate reflects the balance between the forces of supply and demand, which means that it reflects the influence of U.S. imports and financial outflows on one side, and U.S. exports and financial inflows on the other.
EVERYDAY Economics
How to keep exchange rates straight
You’ve learned that the supply of U.S. dollars comes from Americans looking to exchange their dollars for yen. But if you were studying economics in Japan, you’d learn that Americans looking to exchange their dollars for yen create the demand for yen. Similarly, you’ve learned the demand for U.S. dollars comes from Japanese folks who are looking to exchange their yen for dollars. But in Japan, you’d learn that this creates the supply of yen. These dual identities arise because the market for U.S. dollars (paid for with yen) is also the market for yen (paid for in U.S. dollars). These are just two sides of the same, umm… coin. So to keep straight which side is up, always:
- Clarify which market you’re analyzing. Don’t just say that you’re analyzing the foreign exchange rate market; describe it as the market for U.S. dollars, paid for with Japanese yen.
- Specify what price you’re evaluating. If you’re assessing the market for U.S. dollars, be clear that you’re analyzing the price of a U.S. dollar, which we describe as the number of yen needed to buy one dollar. If you’re forecasting the price of the yen, the relevant price is the number of U.S. dollars needed to buy one yen.
- State the origins and destinations. Don’t just say “exports”; say “exports from the United States to Japan.”
Follow these three pieces of advice, and you’ll avoid a lot of confusion.
The exchange rate will change when macroeconomic conditions change.
You’ll find this framework to be particularly useful for forecasting how the exchange rate will change in response to changing macroeconomic conditions. Our next task is to analyze shifts in the demand for dollars, and we’ll then turn to shifts in supply. But before we dive in, remember that in any supply-and-demand analysis, a change in the price—which in this case is a change in the exchange rate—will not shift either the demand or supply curve.
Shifts in Currency Demand
An increase in demand for U.S. dollars shifts the demand curve to the right. As the left panel of Figure 11 shows, an increase in demand causes the price of the U.S. dollar to rise, which is an exchange rate appreciation. The demand curve for U.S. dollars shifts right whenever people want to buy more dollars at any given exchange rate. By contrast, the right panel shows that a decrease in demand for U.S. dollars shifts the demand curve to the left. A decrease in demand causes the price of the U.S. dollar to fall, which is an exchange rate depreciation. The demand curve shifts left whenever people want to buy fewer dollars at any given exchange rate.
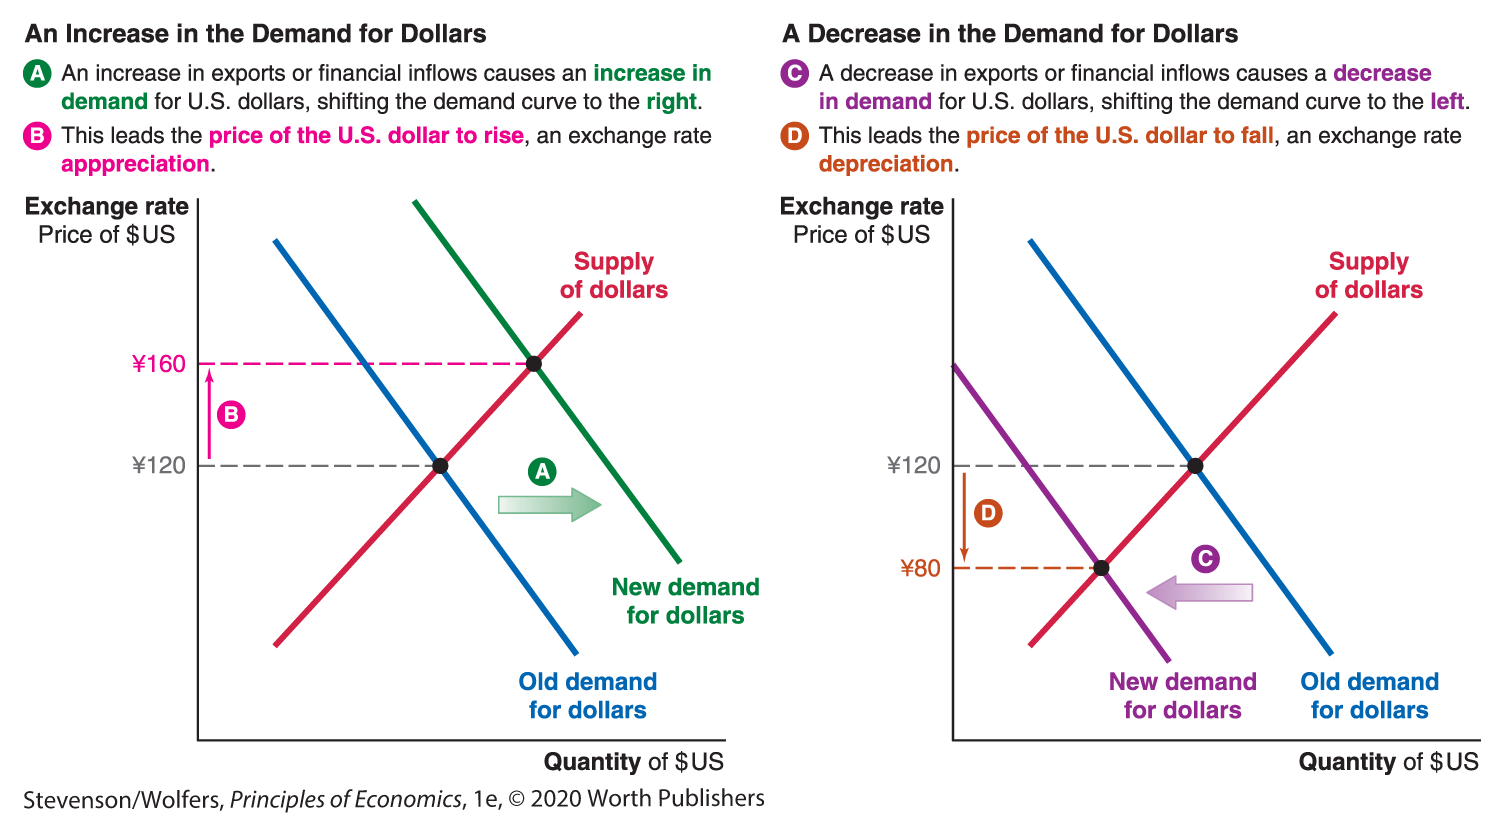
Figure 11 | The Demand for Dollars
Recall that demand for U.S. dollars comes from foreigners who either need dollars in order to buy American exports or to invest in the United States. The interdependence principle reminds us that their decisions depend on developments in other markets and in other countries. As a result, anything—besides the exchange rate—that shifts either how much foreigners spend on exports, or how much they invest in the United States (that is, financial inflows), will shift the demand for dollars. Let’s evaluate each of these shifters in turn.
Demand shifter one: Exports from the United States.
Any factor that shifts the dollar value of exports at a given exchange rate will shift the demand for dollars. As a result, exports from the United States—and hence the demand for dollars—shift in response to the following factors:
- Strength of the global economy: An increase in the GDP of our major trading partners usually causes an increase in U.S. exports, shifting the demand for U.S. dollars to the right. For instance, an economic recovery in Japan will increase the income of Japanese consumers, and they’ll spend some of this extra income on the Mathisons’ apples and other American goods and services.
- Barriers to trade in foreign market: When foreign governments provide easier access to their markets, exports will increase, shifting the demand for U.S. dollars to the right. For instance, Japanese officials used to require American apples be quarantined before they could be sold, causing high spoilage rates. When this trade barrier was scrapped, the Mathisons started exporting apples to Japan.
- Domestic innovation and marketing: Successful innovation and marketing of U.S. goods and services to foreign customers will increase exports, shifting the demand curve for U.S. dollars to the right. For example, the Mathisons have developed new storage and packaging technologies that make their fruit more attractive to foreign customers.
- Foreign prices: When foreign prices are higher than their American counterparts, foreign customers switch to buying the American-made goods instead. This increased demand for U.S. exports will shift the demand curve for U.S. dollars to the right. For example, if Japanese apple farmers raise their prices, then some Japanese consumers will switch to American-grown apples, increasing the demand for U.S. dollars. Or if the price of apples from a third country—say, New Zealand—were to rise, some Japanese consumers will switch from New Zealand to American-grown apples.
- Domestic prices: When American sellers cut their prices it leads to a large increase in exports, thereby increasing the demand for dollars. For example, if the Mathisons cut the price of their apples, foreigners will buy more of them. This is where it gets a bit tricky: While this means that the Mathisons will export more apples, each apple costs fewer dollars. Therefore, the total number of dollars that foreigners spend on apples could either rise or fall. In practice, lower domestic prices tend to lead to such a large increase in exports that the demand for dollars will increase.
In each of these cases, you’ve seen what happens if exports were to increase at a given exchange rate. These same influences also operate in reverse: A decrease in exports would lead to a decrease in the demand for dollars, which causes the exchange rate to depreciate.
Demand shifter two: Financial inflows into the United States.
Foreign investors are usually seeking a combination of a healthy return on their investment, and relatively low risk. This means that financial inflows—and hence demand for dollars—change in response to the following factors:
- Interest rate differentials: Foreign investors are sensitive to the opportunity cost principle, and the opportunity cost of investing in the United States is investing in either their home country or some other country. As a result, financial inflows are driven by the difference between American interest rates and foreign interest rates. A higher interest rate differential—due to either higher interest rates in the United States or lower interest rates in a foreign country—will increase financial inflows, shifting the demand curve for dollars to the right.
- Business profitability: The more opportunities there are for profitable investments in the United States relative to such opportunities in other countries, the larger will be financial inflows. As a result, financial inflows are sensitive to factors like taxes, wage rates, and demand that affect business profitability. Any change that creates a more profitable business climate in the United States will lead to more financial inflows, shifting the demand curve for dollars to the right.
- Political risk: The United States is often called a “safe haven” for investing, making it an attractive destination for foreign investors worried about political risks in their own country. Whenever foreign risks rise relative to political risk in the United States—such as the risk of a foreign government coup or seizure of assets—financial inflows into the United States increase, and thus so does the demand for U.S. dollars, shifting the demand curve to the right.
- Expected exchange rate movements: Right now, thousands of foreign exchange speculators are evaluating how changing economic conditions are likely to shift the price of the U.S. dollar. Any news that might cause the dollar to rise in the future has an immediate impact, as speculators rush to buy dollars in anticipation of them later rising in value. Increased demand for U.S. dollars by speculators shifts the demand curve for U.S. dollars to the right.
In each of these cases, you’ve seen what happens if these factors lead financial inflows to increase at a given exchange rate. These same influences also operate in reverse: A decrease in financial inflows would lead to a decrease in the demand for dollars, which causes the exchange rate to depreciate.
Okay, these are the factors that shift the demand for U.S. dollars. Let’s now turn our attention to shifts in the supply of dollars.
Shifts in Currency Supply
An increase in the supply of U.S. dollars at any given exchange rate shifts the supply curve to the right. As the left panel of Figure 12 shows, an increase in supply will cause the price of the U.S. dollar to decline, which is an exchange rate depreciation. By contrast, the right panel of Figure 12 shows that a decrease in supply at any given exchange rate shifts the supply curve to the left, leading to a new equilibrium in which the price of the U.S. dollar rises, an exchange rate appreciation.
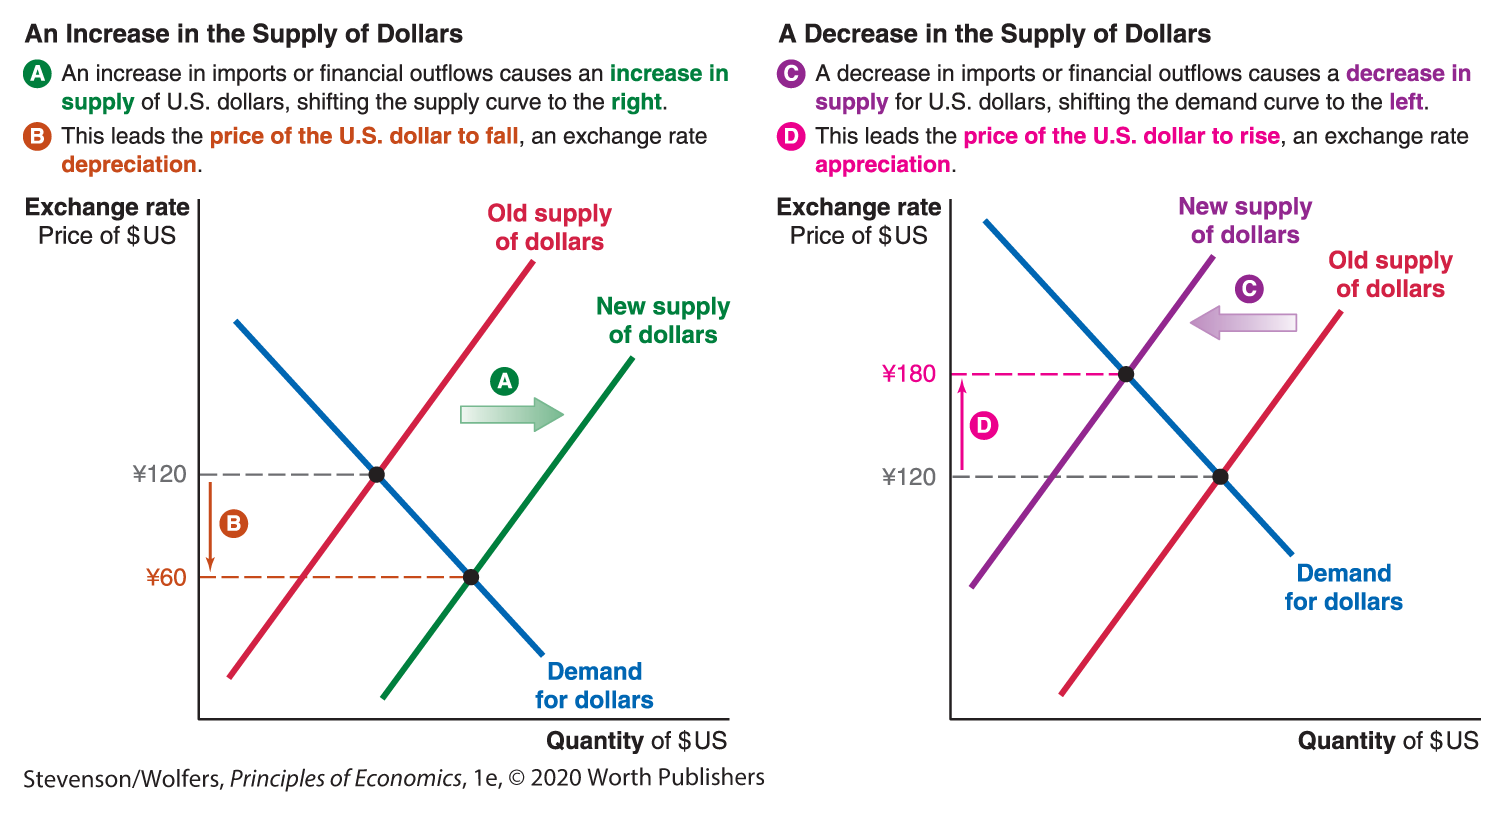
Figure 12 | The Supply of Dollars
As with the demand for dollars, the supply for dollars reflects the interdependence principle at work. The supply of U.S. dollars comes from Americans who need to exchange their dollars for foreign currency, so that they can buy imports or invest their savings abroad and those decisions depend on developments in other markets. As a result, anything—besides the exchange rate—that shifts either how much people spend on imports, or how much they invest abroad (that is, financial outflows), will shift the supply of dollars. Let’s evaluate each of these shifters in turn.
Supply shifter one: Imports into the United States.
Any factor that shifts how much Americans spend on imports will shift the supply of dollars. As a result, imports—and hence the supply of dollars—shift in response to the following factors:
- Strength of the domestic economy: An increase in U.S. GDP means that Americans have more income to spend, including on imported goods like Japanese electronics. Thus, an increase in American incomes means more imports, shifting the supply of U.S. dollars to the right.
- Trade barriers protecting domestic producers: When the United States reduces tariffs and other barriers that make it difficult for foreign companies to sell their goods to Americans, demand for imports will increase and thus so will the supply of U.S. dollars. For example, when China joined the World Trade Organization, Americans purchased more Chinese imports, which shifted the supply of U.S. dollars to the right.
- Foreign innovation and marketing: Innovation in foreign-products and better marketing of foreign products to Americans will lead to an increase in American demand for imports. For example, Japanese innovation disrupted the camera industry, shifting demand from American companies such as Kodak to Japanese companies such as Nikon. The result was an increase in imports, which shifted the supply of dollars to the right.
- Domestic prices: If American producers raise their prices relative to foreign alternatives, American buyers will switch from buying domestically-produced goods and services to buying more imported ones. The result is an increase in imports, which shifts the supply of U.S. dollars to the right.
- Foreign prices: Similarly, if foreign producers cut their prices, American buyers will buy more imported goods. Typically, demand for imports is very price sensitive, and so lower foreign prices usually lead to an increase in the quantity of dollars supplied, shifting the supply of U.S. dollars to the right.
In each of these cases, you’ve seen what happens if the quantity of imports were to increase at a given exchange rate. These same influences also operate in reverse: A decrease in imports leads to a decrease in the supply of dollars, shifting the supply of dollars to the left, which causes the exchange rate to appreciate.
Supply shifter two: Financial outflows from the United States.
Remember that when Americans invest abroad, they’ll need foreign currency to do so. And so any factor that shifts financial outflows at a given exchange rate will also shift the supply of dollars. The decisions that American investors make about whether to invest their funds abroad or at home lead financial outflows—and hence the supply of dollars—to respond to:
- Interest rate differentials: A lower interest rate differential—due to either lower interest rates in the United States or higher interest rates in a foreign country—will increase financial outflows as Americans seek better investment opportunities outside of the U.S., shifting the supply curve for dollars to the right.
- Business profitability: The fewer opportunities there are for profitable investments in the United States, the larger will be the resulting financial outflow. Any change that creates a less investment-friendly business climate in the United States will lead to more financial outflows, shifting the supply curve for dollars to the right.
- Political risk: Whenever foreign political risks decline, U.S. investors are more interested in investing abroad, increasing the supply of U.S. dollars, shifting the supply curve to the right.
- Expected exchange rate movements: Any news that might cause the dollar to fall in the future has an immediate impact, as speculators rush to sell dollars in anticipation of them later falling in value. Increased supply of U.S. dollars by speculators shifts the supply curve for U.S. dollars to the right.
Look closely, and you’ll notice that this list of factors that shift financial outflows is the mirror image of the list of factors that shift financial inflows, and hence the demand for dollars. This symmetry arises because American and foreign investors are in the same business of scouring the world looking for good investment opportunities, and so they’ll respond to similar factors. When investing abroad becomes a better bet, American investors invest less here and more abroad, increasing financial outflows. When foreigners follow suit and also invest less here and more abroad, the result is a decrease in financial inflows.
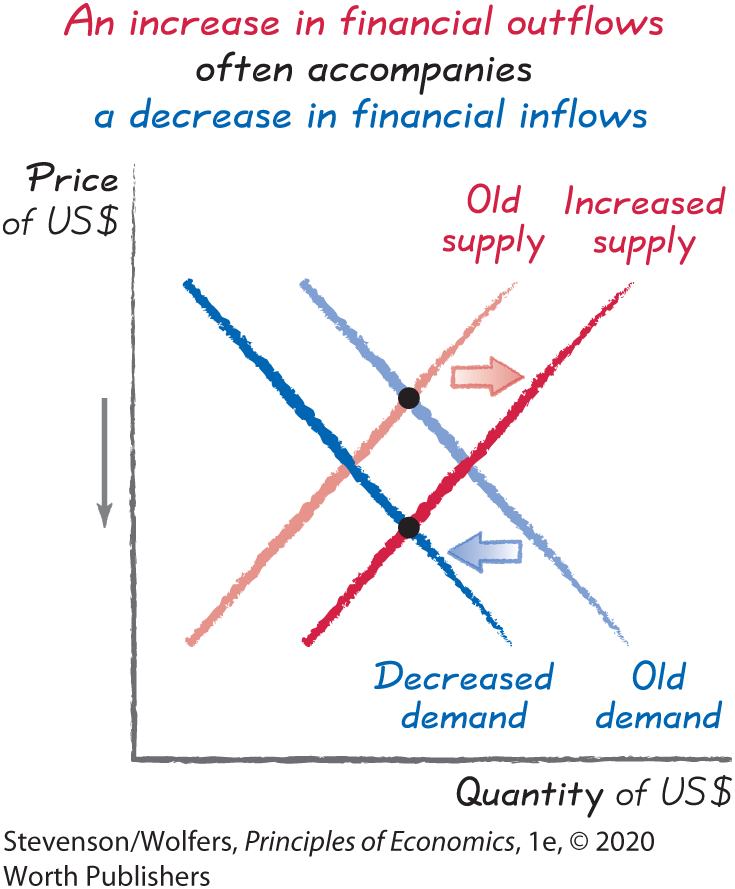
This can make it tricky to analyze financial flows, as nearly any factor that shifts financial outflows, and hence the supply of dollars, in one direction will shift financial inflows and the demand of dollars in the opposite direction. Ultimately these effects will reinforce each other, as an increase in the supply of dollars will cause a depreciation that’s reinforced by a decrease in demand. Likewise, a decrease in the supply of dollars will cause an appreciation that’s reinforced by an increase in demand.
Okay, that’s it—we’ve analyzed the set of factors that might cause the demand or supply of dollars to shift, and I’ve summarized them for you in Figure 13. But remember: There’s one factor that won’t shift either the demand or supply curves, and that’s the exchange rate.
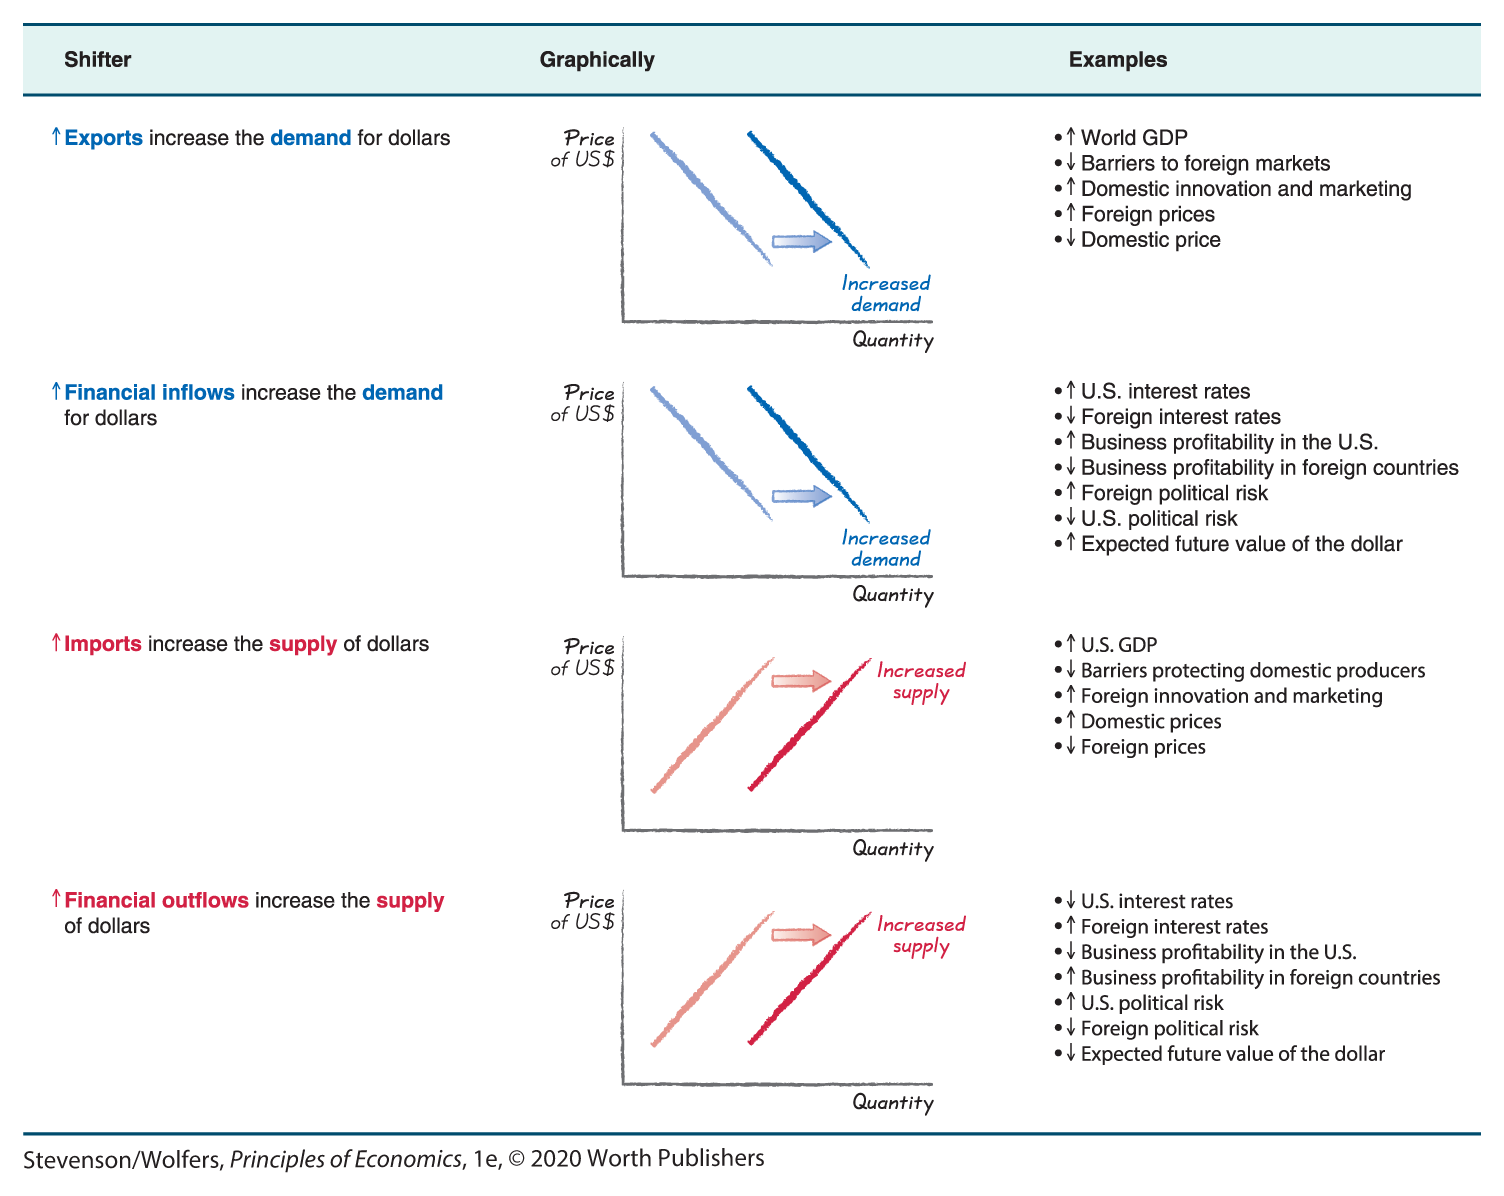
Figure 13 | Factors That Shift the Demand and Supply of Dollars
Forecasting Exchange Rate Movements
You’re now ready to apply these tools to forecast how the exchange rate will respond to changing economic conditions. Simply apply the same three-step recipe you use to predict the results of any supply-and-demand analysis:
Step one: Is the supply or demand curve shifting (or both)?
Will this shift exports or financial inflows into the United States—in which case it shifts the demand curve? Or will it shift imports or financial outflows abroad—which will shift the supply curve?
Step two: Is this an increase that will shift the curve to the right, or a decrease that will shift the curve to the left?
Increases in any international transactions—in imports, exports, financial inflows, or financial outflows—will shift the relevant curve to the right. And decreases in these transactions will shift it to the left.
Step three: How will the price—that is, the exchange rate—change in equilibrium?
Remember, the new equilibrium occurs where the new demand and supply curves cross.
Do the Economics
Think you’re ready to try your hand at this? Try working through the following examples.
- A “Buy American” campaign leads millions to buy American-made goods instead of imports.
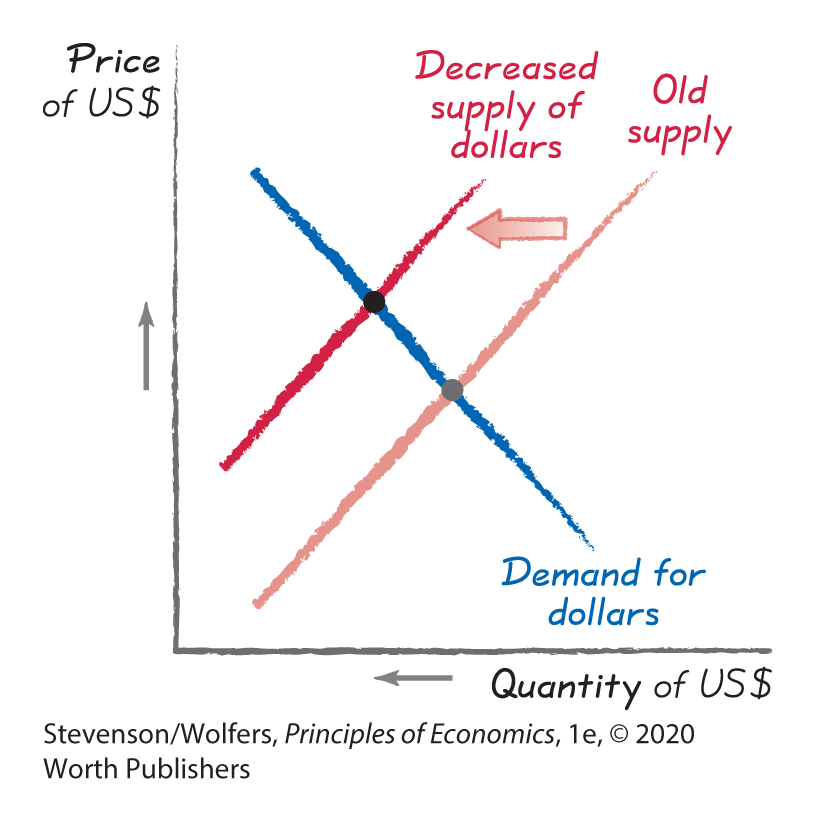
- Decreased imports to the United States
- → Decreased supply of US$.
- Result: US$ appreciates
- Germany imposes a 30% tariff on U.S. cars.
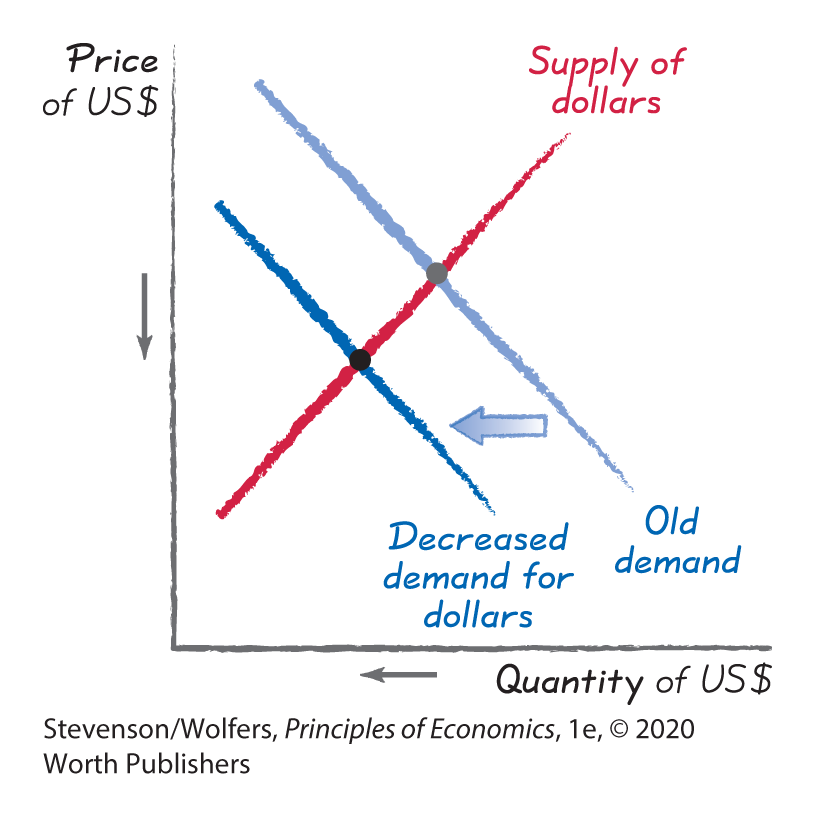
- Decreased exports from the United States
- → Decreased demand for US$.
- Result: US$ depreciates
- People in China are traveling more, so Chinese airlines are buying more American-made Boeing aircraft.
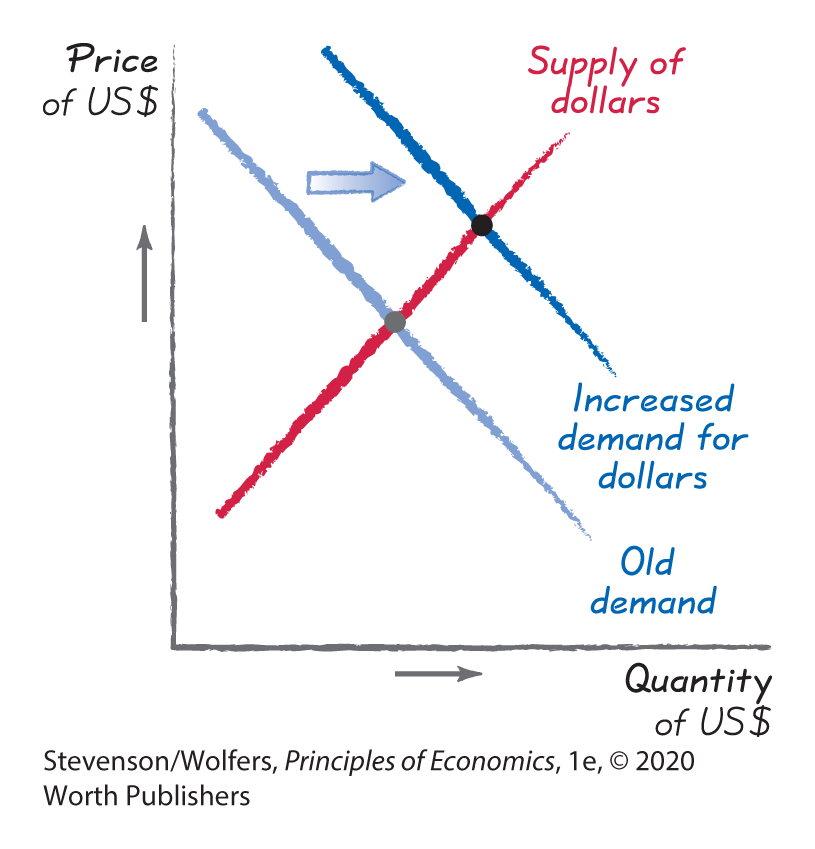
- Increased exports from the United States
- → Increased demand for US$.
- Result: US$ appreciates
- A strong U.S. economy leads Americans to buy more imports.
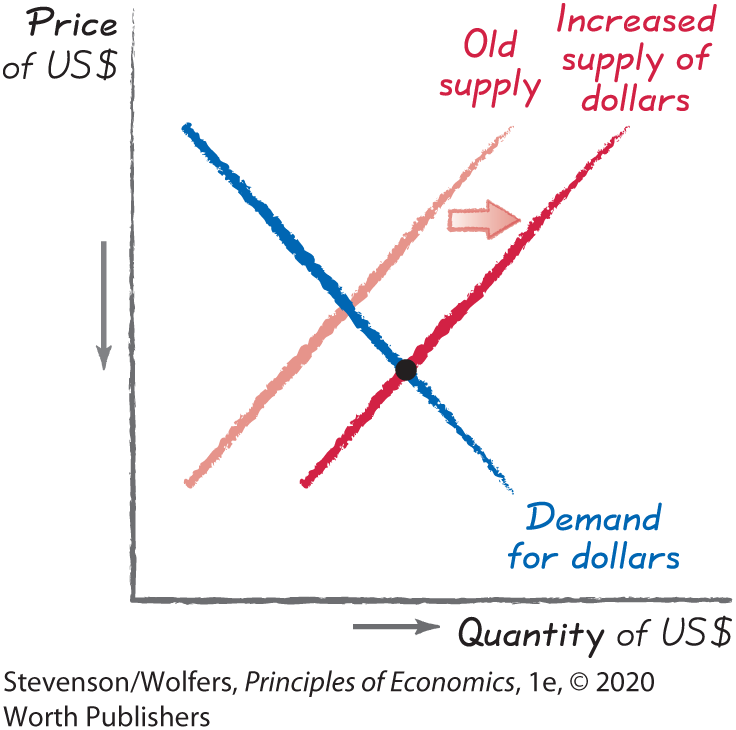
- Increased imports to the United States
- → Increased supply of US$.
- Result: US$ depreciates
- The Federal Reserve unexpectedly raises U.S. interest rates.
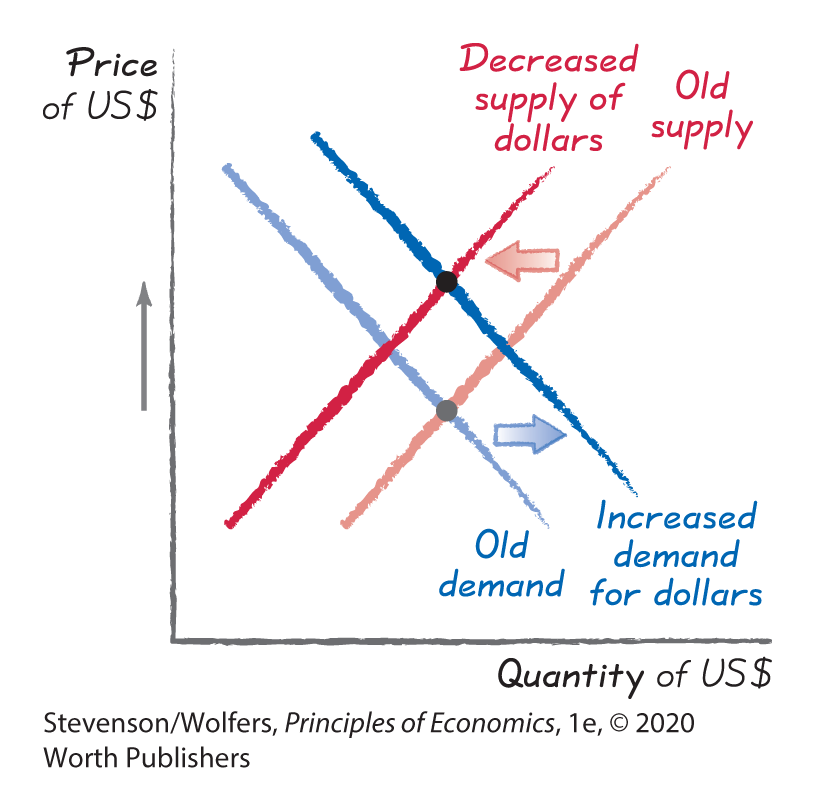
- Increased financial inflows and decreased financial outflows
- → Decreased supply of US$ and increased demand for US$.
- Result: US$ appreciates
- Political turmoil in the United States leads investors to question whether it really is a safe haven.
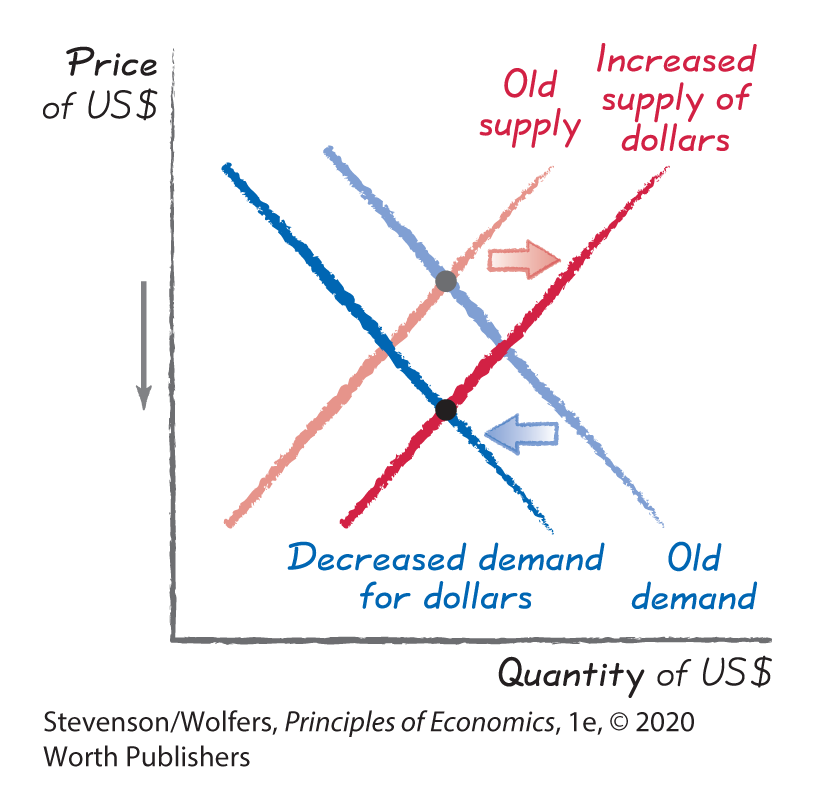
- Increased financial outflows and decreased financial inflows
- → Increased supply of US$ and decreased demand for US$.
- Result: US$ depreciates
Government Intervention in Foreign Exchange Markets
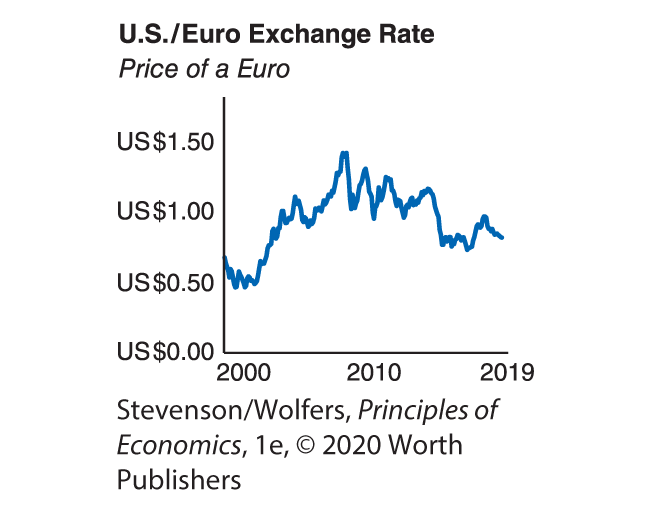
So far we’ve described the foreign exchange market as determined purely by the forces of supply and demand, and this system is called a floating exchange rate. We’ve done this because today most countries have a floating exchange rate. The U.S. dollar and the Euro are both examples of floating exchange rates and, as a result, the U.S. dollar/Euro exchange rate rises and falls as macroeconomic conditions change.
Some countries actually fix their exchange rate.
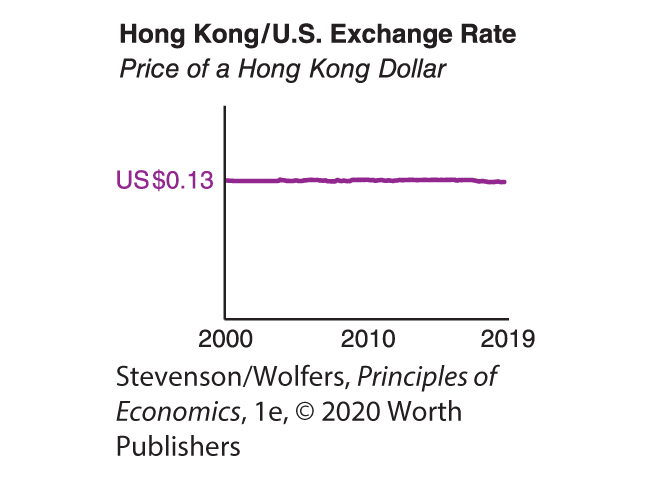
A fixed exchange rate is one where the government effectively sets the price of the currency. For instance, Hong Kong maintains a fixed exchange rate with the United States, and for several decades the price of a Hong Kong dollar has not budged from US$0.13. Hong Kong’s central bank achieves this by buying or selling as much currency as needed to prevent the price from moving. When the demand for its currency exceeds supply, it sells Hong Kong dollars, and when there’s more supply than demand, it buys Hong Kong dollars. Fixed exchange rates were more common in the decades following World War II.
Some countries operate between these extremes, in what’s called a managed exchange rate (or a “dirty” float).
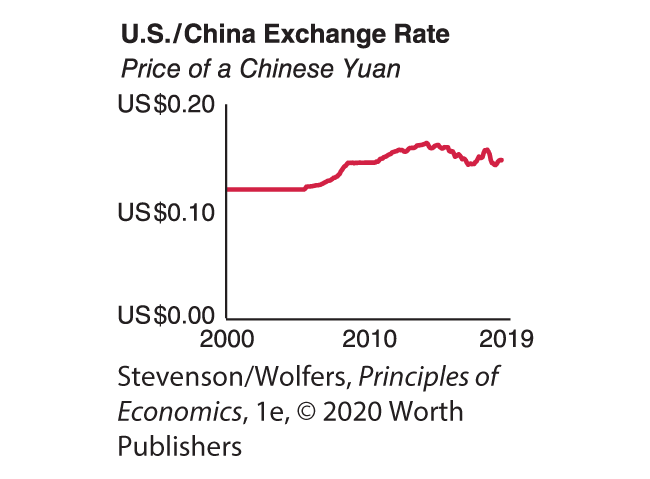
Data from: Federal Reserve Bank of St. Louis.
China is an important example of a country that manages its exchange rate. It officially abandoned its fixed exchange rate in 2005. But in an effort to boost the competitiveness of China’s exporters, China held the value of its currency artificially low for much of the next decade, by selling trillions of yuan (and buying trillions of dollars). This cheap yuan policy led to frictions. It meant low-prices for American consumers, but that also meant that it helped Chinese exporters win business from American companies. China appears to have abandoned this policy sometime around 2015. It still continues to somewhat manage its exchange rate, but to a lesser degree.

