30.3 The MP Curve: What Determines the Interest Rate
Our next stop is the financial markets, where interest rates are determined. We’ll start by analyzing the role of the Federal Reserve because it’s the 800-pound gorilla in financial markets. We’ll then incorporate the rest of the financial system to see how other market factors—including the price of risk—shape the interest rate. We’re digging into the factors determining interest rates because the IS curve tells us that they have major economic consequences. Our goal is to bring these insights together in a few pages into a compact and useful framework.
The Federal Reserve

The president of the Atlanta Fed pondering the IS curve.
Eight times a year, policy makers meet at the Federal Reserve in Washington to decide how high (or low) to set the interest rate. Over two days of meetings, they pore over binders full of data about how the economy is doing, discuss what trends they’re seeing in different parts of the economy, debate the implications, and think through a variety of scenarios. As policy makers discuss where to set the interest rate, they consult their estimates of the IS curve in order to assess the implications of each possible choice.
At the end of this meeting, the Federal Reserve issues a statement to let everyone know how it plans to change the interest rate. When the Federal Reserve sets interest rates in an effort to influence economic conditions, this process is called monetary policy. It’s so important that we’ll devote all of Chapter 34 to studying it. For now, we’ll focus on the big picture, leaving the details for later.
The Fed sets the nominal interest rate to influence the real interest rate.
When the Federal Reserve announces that it’s setting the interest rate at 5%, it’s actually setting the nominal interest rate. But just as we have focused on the real interest rate because that’s the rate that people respond to, so does the Fed. If inflation is 2%, then it’s just as accurate to say that the Fed set the nominal interest rate at 5% as it is to say that it set the real interest rate at 3%. And so we’ll describe the Federal Reserve as setting the real interest rate because in practical terms that’s what it is doing.
The Fed’s decisions percolate throughout the whole economy.
The Fed doesn’t set every interest rate in the economy. Rather, its policy tool is a specific interest rate called the federal funds rate, which is the interest rate on a set of overnight loans that are almost certain to be repaid the next day. There’s no such thing as a loan with zero risk, but these overnight loans come pretty close—so close, in fact, that for our purposes you can think of the Federal Reserve as effectively setting the risk-free interest rate.
Changes in the risk-free interest rate then percolate through the rest of the economy, affecting the interest rate you’re paid on your savings, the interest rate at which you can borrow money for a house or car, the interest rate on your credit card, and the interest rate at which businesses can borrow to fund their investments. But the Fed is not the only force affecting interest rates.
The Risk Premium
There’s another critical factor that affects interest rates: risk. Whenever you lend someone money, there are risks involved. You might not get paid back, you might set the interest rate too low, or you might end up needing those funds yourself.
The interest rate on any loan reflects the risk-free rate plus a risk premium.
Banks and other lenders demand to be paid extra for taking on risk. The extra interest that they charge to account for risk is called the risk premium. It’s the reason that the interest rate you pay on your credit card, car loan, housing mortgage, or a business loan is typically higher than the risk-free interest rate set by the Federal Reserve. While riskier borrowers and riskier types of loans might get charged a higher risk premium, for now we’ll simply focus on the risk premium that’s charged for a typical loan.
As a result, the real interest rate that’s relevant to the typical borrower—and hence is relevant for our analysis—reflects two influences: It’s the risk-free rate (set by the Fed), plus the risk premium, which is determined by financial markets.

The risk premium is determined in financial markets.

This is where risk is traded.
This is where Wall Street comes in. That’s where the buyers and sellers of risk—mainly big banks and other financial institutions—meet to trade risk. They do this by buying and selling complicated financial contracts that allow them to reallocate the risks in their portfolios—including the risks associated with the money they have loaned you. You can think of the market for risk as being like other markets: There are many buyers and sellers, and just as a buyer of T-shirts has to pay $10 to induce a supplier to produce one, a borrower has to pay a financial institution a risk premium to induce it to make a risky loan. Seen this way, the risk premium is a price—the price at which financial institutions are willing to bear the risk associated with lending you money. This price is determined by the forces of supply and demand, and so it reflects changing financial conditions and sentiments in financial markets.
EVERYDAY Economics
Why you pay different interest rates on different loans
Macroeconomic analysis focuses on the typical risk premium faced by the typical borrower. But in your own life, you’ll confront different risk premiums on different types of loans, leading you to pay different interest rates.
The riskier the loan, the higher the interest rate you’ll end up paying. For instance, a family member might be willing to lend you money at a lower rate than a bank because they’ll trust that you’ll repay them. (And unlike a bank, they might have other ways of making you pay.) When you take out a car loan, the lender (usually a bank) has the right to repossess your car if you fall behind on your repayments. That makes a car loan less risky than a personal loan, which is why banks offer lower interest rates on car loans than they do on personal loans. Try to borrow money at a payday lending shop, and you’ll discover outrageously high interest rates. That’s partly because these are risky loans. And it’s partly because the only people who aren’t driven away by those high rates are usually in some kind of financial pickle, making them riskier still.
The MP Curve
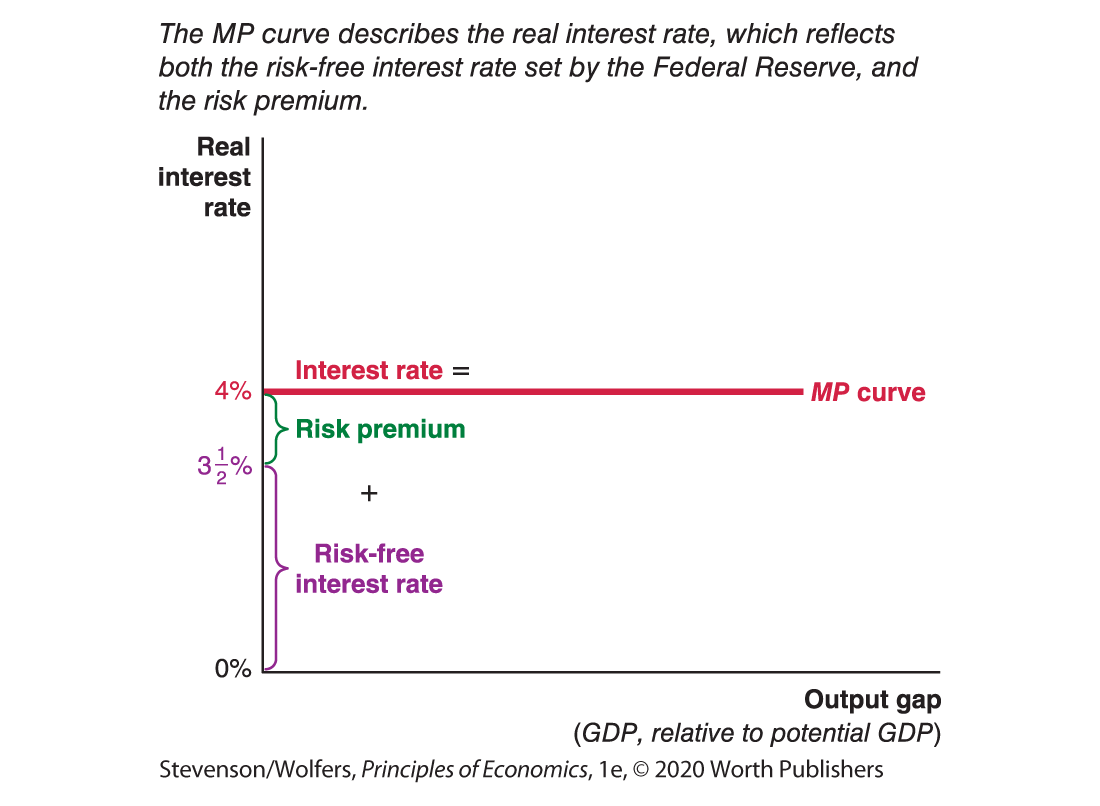
It’s time to integrate our analysis of the Fed and financial markets into the broader framework we’re developing. We do this by adding a new curve, the MP curve, which stands for “Monetary Policy,” because we use it to illustrate the current real interest rate, which is largely shaped by monetary policy. The name is a bit misleading, because we also use the MP curve to illustrate how changes in the risk premium affect the real interest rate.
The MP curve illustrates the real interest rate.
As Figure 6 shows, if the Federal Reserve sets the real interest rate at 


Figure 6 | The MP Curve
The MP curve illustrates the current real interest rate. If the interest rate changes—either because the Fed changes monetary policy, or changes in financial markets shift the risk premium—the MP curve will shift to illustrate this.
You can measure the risk premium using interest rate spreads.
Here’s a simple trick you can use to track the risk premium: Calculate the difference between the interest rate at which you can borrow and the risk-free interest rate (and make sure you’re comparing loans of the same duration). This difference, which is called an interest rate spread, is an estimate of the risk premium.
A useful proxy for the risk-free interest rate is the interest rate on loans to the U.S. government, because the U.S. government is almost certainly going to pay its debts. And so you can calculate the risk premium as the difference between the interest rate at which you can borrow and the interest rate on a similar duration loan to the U.S. government.
Interpreting the DATA
Measuring financial risk
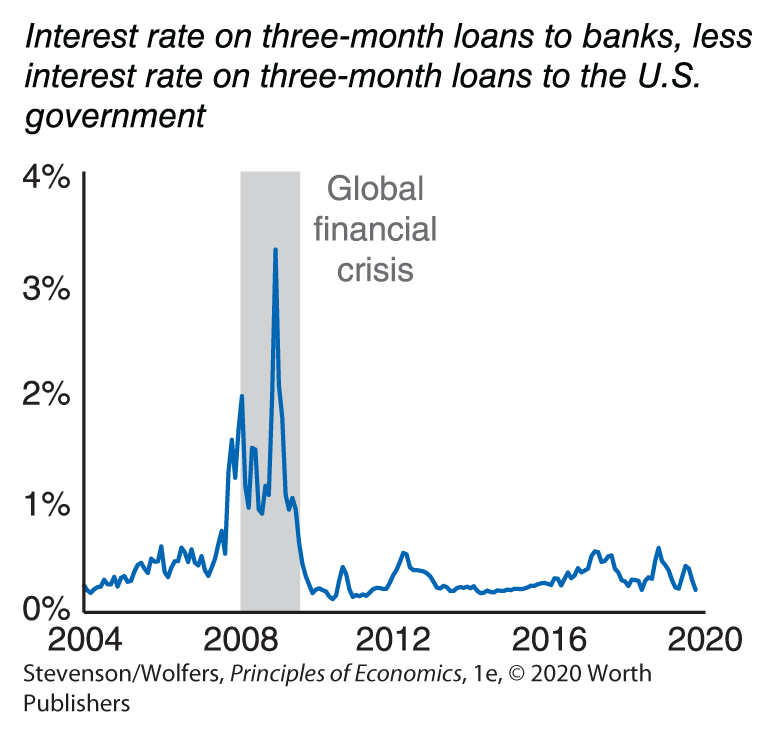
The TED spread is an important interest rate spread that economists watch closely to monitor the health of the banking system. Ignore the name—it’s an obscure financial acronym—and focus instead on what it is: the difference between the interest rate at which banks lend to each other for a three-month period, and the interest rate at which the U.S. government can borrow for three months. As such, it’s a measure of the perceived riskiness of the banking system. As you can see in Figure 7, the TED spread is usually low and stable. However, during a major financial crisis, it will spike, pointing to increased risk in the financial system. Each spike corresponds with a rise in the risk premium. As the global financial crisis emerged in 2008, the TED spread rose sharply, indicating a higher risk premium, which shifted the MP curve upward. If anything, this understated the problem: The TED spread tells you about the risk premium if you can get a loan. During the worst days of the crisis, many borrowers couldn’t find anyone willing to lend to them.

Figure 7 | TED Spread
The MP curve is simple because monetary policy is simple.
Before we continue, a historical note. You’ll notice that the MP curve is pretty simple—you just draw a horizontal line to show whatever the current real interest rate is. That’s because the Federal Reserve simply announces where it wants to set the interest rate, and the MP curve reflects that (plus the risk premium). But it wasn’t always so easy. Several decades ago, the Federal Reserve implemented monetary policy by announcing changes in the money supply instead. Figuring out how this affected the economy required a careful analysis of Liquidity and Money, which is why some economics textbooks describe a more complicated LM curve, instead of the MP curve. So if you come across a reference to IS-LM analysis, you should know that they’re describing similar ideas, but analyzing an older approach to monetary policy.
You’ve now developed two powerful tools for understanding the business cycle—the IS curve and the MP curve. Our next task is to bring them together, into an integrated IS-MP framework. Just as businesses, investors, and policy makers do, you’ll be able to use this framework to organize your thoughts about the implications of changing economic conditions.
