26.3
Particle Filtration and Reverse Osmosis
26.3.1 Introduction
The process of liquid filtration is used in a range of industries to remove suspended particles or microorganisms by passing a fluid through a porous filter medium.1 In some cases, the suspended matter is the desired product, for example, precipitation or recrystallization of a reaction product. However, in production of beverages such as wine and beer (or municipal water) the primary goal is to clarify, stabilize, and/or sterilize the liquid phase [1, 2]. Other means to achieve a degree of clarification are available to the winemaker (e.g., settling and racking, centrifugation (Chapter 19), fining (Chapter 26.2)) but this chapter focuses on common approaches using filtration to achieve more rigorous removal of suspended particles – or exclusion of particular compounds in the case of reverse osmosis (RO) – at different stages of the winemaking process. There are many types of filtration systems and porous filter media [3], with the choice depending on the components being removed and the level of clarity required at the particular stage of winemaking. Typically, there are less stringent requirements early in production, but at bottling a high degree of wine clarity (extremely low turbidity) is almost always essential.2 Filtration can remove particles either through physical exclusion (i.e., the particles are larger than the filter pores) or by adsorption. The latter is of particular interest to wine chemists because: (i) adsorbed compounds are often responsible for blocking (fouling) filters, decreasing the efficiency of filtration, and (ii) adsorption could potentially result in losses of flavor or color compounds.
26.3.2 Definitions, principles, and characteristics of winery filtration
A range of definitions and equations are used to describe filtration in engineering and fluid dynamics texts (e.g., [4] and [5]). The feed is the liquid to be filtered and the filtrate is the liquid that exits the filtration system. The clarity of liquids is described by their turbidity – the ability of the liquid to scatter light – and is typically measured by a nephelometer (also called a turbidity meter, Figure 26.3.1a), and expressed as nephelometric turbidity units (NTUs).3 Turbidity is monitored to assess the effectiveness of winery filtration (and other clarification) operations. Filtration may be described as coarse (removal of the largest particles, leaving a hazy filtrate, around 100 NTU), tight (or polishing/fine, removal of small suspended solids, leaving a “cellar bright” filtrate, at around 10 NTU or less), and sterilizing (removal of microorganisms, giving a biologically stable, bright wine, typically < 1 NTU, which is suitable for bottling).
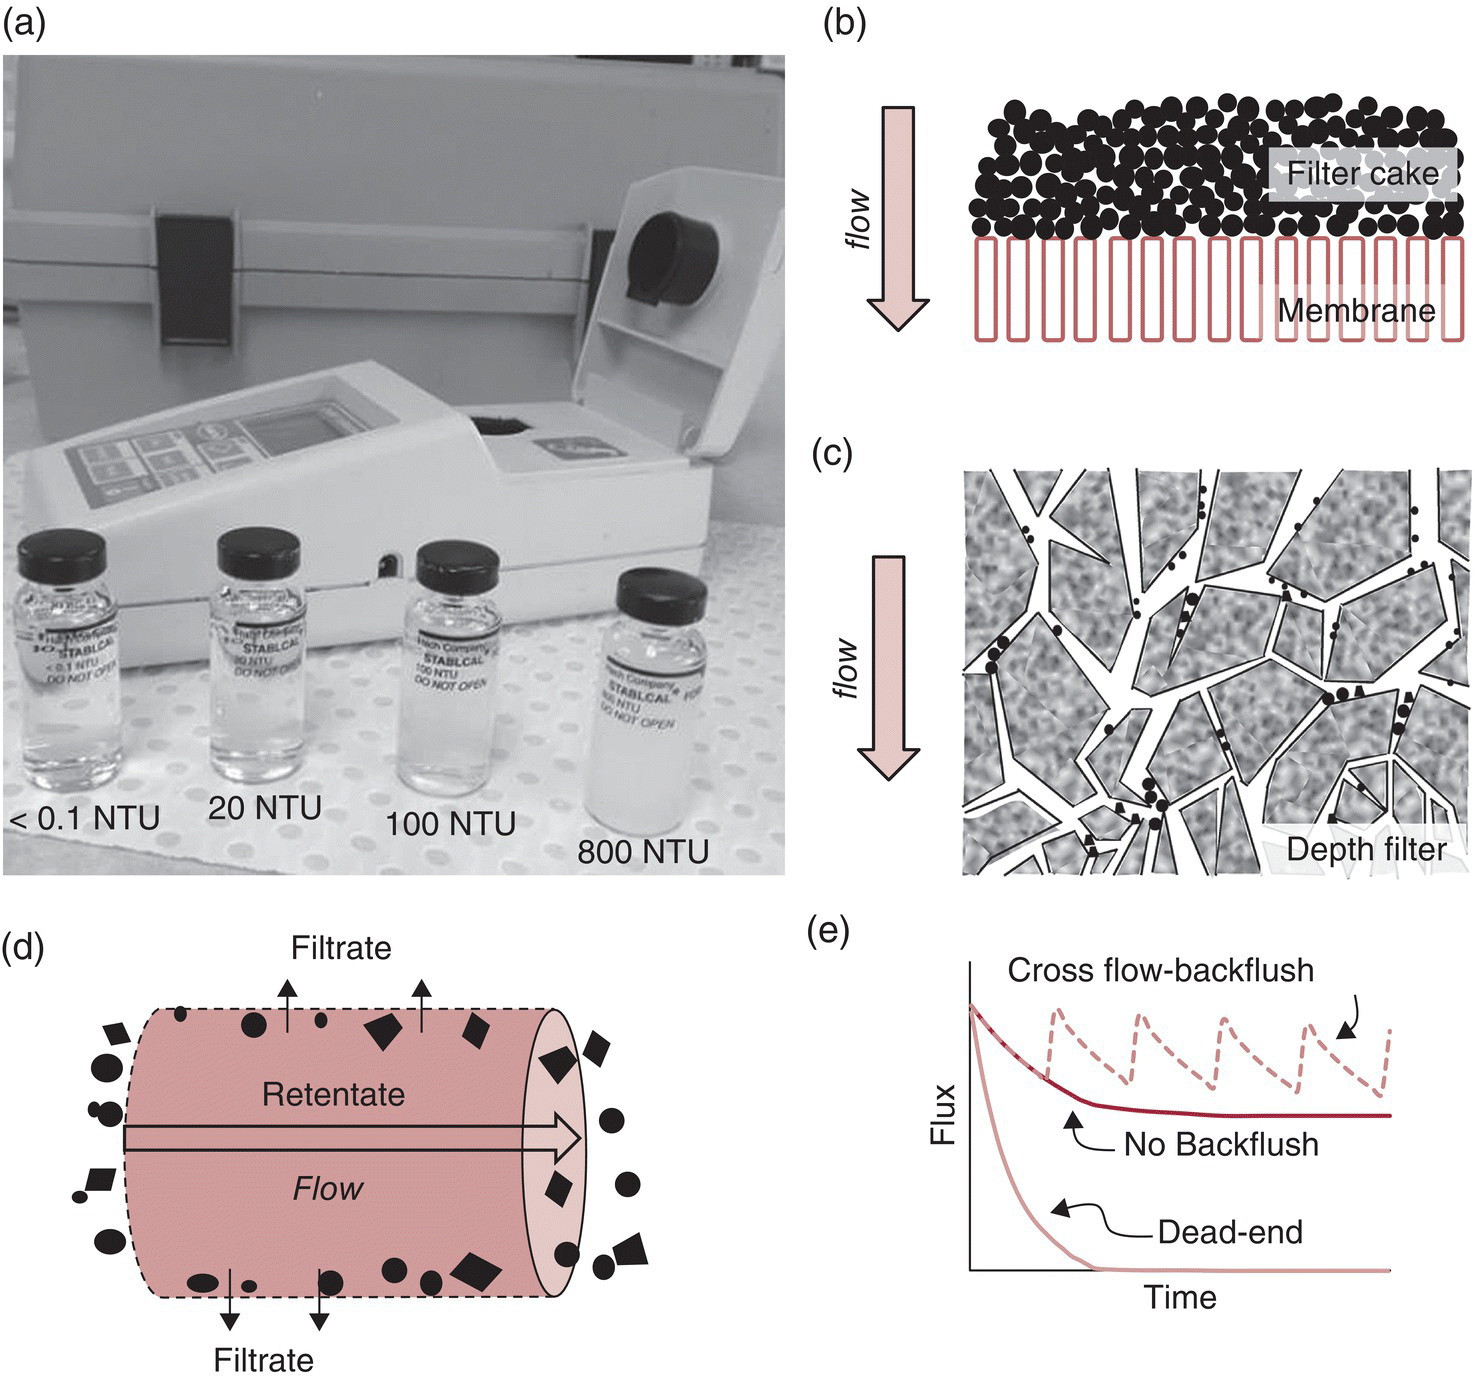
Figure 26.3.1 Image of (a) a portable nephelometer and formazin standards of increasing NTU as indicated, and representative diagrams of filtration models showing (b) dead‐end surface filtration with screening of particles at the membrane filter surface as well as formation of a filter cake, (c) dead‐end depth filtration, in which particles are mechanically trapped within the tortuous paths of the filter matrix or electrostatically adsorbed, (d) tangential crossflow filtration, where particles are swept along the filter surface, and (e) decrease in flux during filtration of a wine by dead‐end and crossflow filtration (with and without periodic backflushing), assuming constant pressure and constant concentration of particulates
Several approaches are used to classify filtration. A common approach is to distinguish filtration based on whether particles are filtered within the filter media (depth) or above the surface of the filter media (surface, cake) (Figure 26.3.1) [1, 2].
- In depth filtration, particles (solids) in the feed are mechanically trapped or adsorbed within the filter medium along tortuous paths making up the depth of the filter, for example a cellulose fiber pad (in a winery) or piece of filter paper (in a lab). Resins can be included in some depth filter media to introduce a surface charge and increase adsorption through electrostatic effects due to the zeta potential of the filter matrix (electrokinetic capture sites) and the charges on the particles (e.g., colloids and microorganisms). Depth filters do not have well‐defined pore sizes.
- In surface filtration, filtration takes place upstream, outside of the filter medium. Particles too large to pass through pores on the filter surface are retained. Typically, surface filtration is achieved through use of a membrane, or a semi‐permeable layer of material with a defined maximum pore size, although larger particles can be filtered at the surface of a depth filter.
During operation, both surface and depth filtration will lead to build up of a filter cake composed of inert solid material (e.g., cells, grape solids) deposited on the surface of the filter media, resulting in cake filtration.4 Similar to depth filtration, cake filtration will result in particles being removed by adsorption or trapped within channels. In winemaking and other areas of the beverage industry, filter cakes may be intentionally generated with a pre‐coat of a rigid solid (termed a filter aid, Chapter 27) like diatomaceous earth (DE).5
A second approach to classifying filtration is based on whether the feed has to pass through the filter medium or can travel parallel to it.
- In dead‐end filtration, the filtrate exits a filter medium positioned perpendicular to the feed stream (Figure 26.3.1b and c). Dead‐end filtration systems are simpler and less expensive to implement, and thus far more common in wineries. However, the flow rate through a dead‐end filter will eventually drop to near zero due to fouling unless the filtering region is cleaned; for example, the filter cake can be removed or the filter media replaced. Dead‐end filtration can be conducted with depth or membrane filters (Figures 26.3.2 and 26.3.3).
- In tangential (crossflow) filtration, the filtrate exits through a filter medium that is parallel to the feed stream (Figure 26.3.1d). In addition to the filtrate, crossflow filtration generates a retentate stream that does not pass through the filter pores and is recirculated through the crossflow filter multiple times. While more costly to establish, crossflow filtration provides several advantages, particularly that the parallel flow of feed decreases the extent of cake build‐up on the filter surface, so the decrease in flow rate over the course of filtration is less severe in crossflow than in dead‐end filtration (Figure 26.3.1e). This means that liquids of higher turbidity can be filtered, including lees, therefore eliminating the need for multiple filtration steps. Crossflow filtration is performed with membranes (Figure 26.3.4).

Figure 26.3.2 Winery depth and cake filtration systems include (a) flat sheet filter press comprising 40 cm × 40 cm cellulose sheets positioned within the black frames on the press, which offers variable capacity by using more or fewer frames, (b) rotary drum vacuum filter (RDV) coated with DE or perlite (approximately 100 mm thick) suitable for large volumes of turbid juice or wine (e.g., lees from the bottom of tanks), and (c) pressure leaf filter housing, with the inset at bottom right showing horizontal leaves (screens) used for supporting DE filter cakes
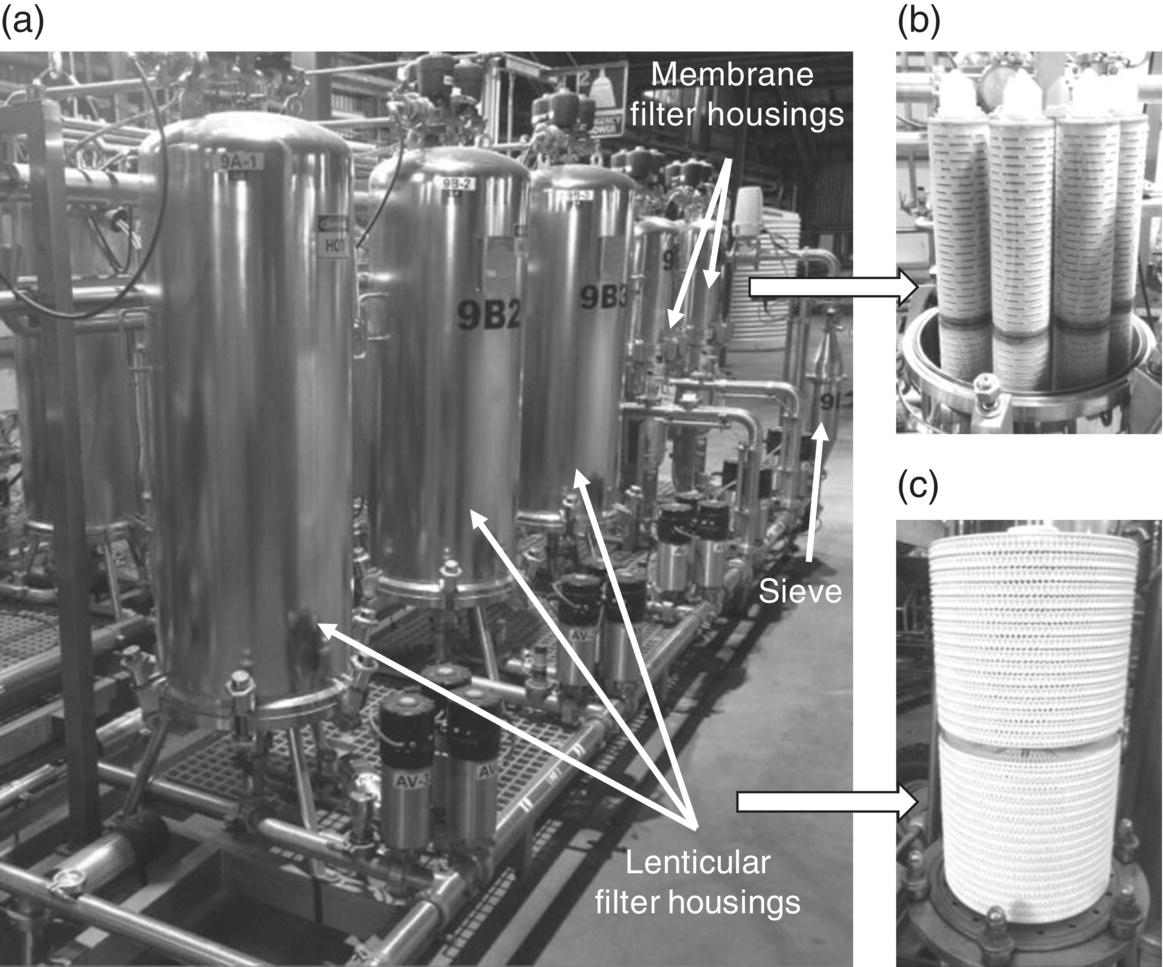
Figure 26.3.3 Winery automated filtration skid consisting of (a) a coarse sieve as well as depth and surface filter housings containing (b) pleated polymer membrane filter cartridges and (c) cellulose lenticular filter modules, respectively (not to scale).
Source: Reproduced with permission of Luke Wilson
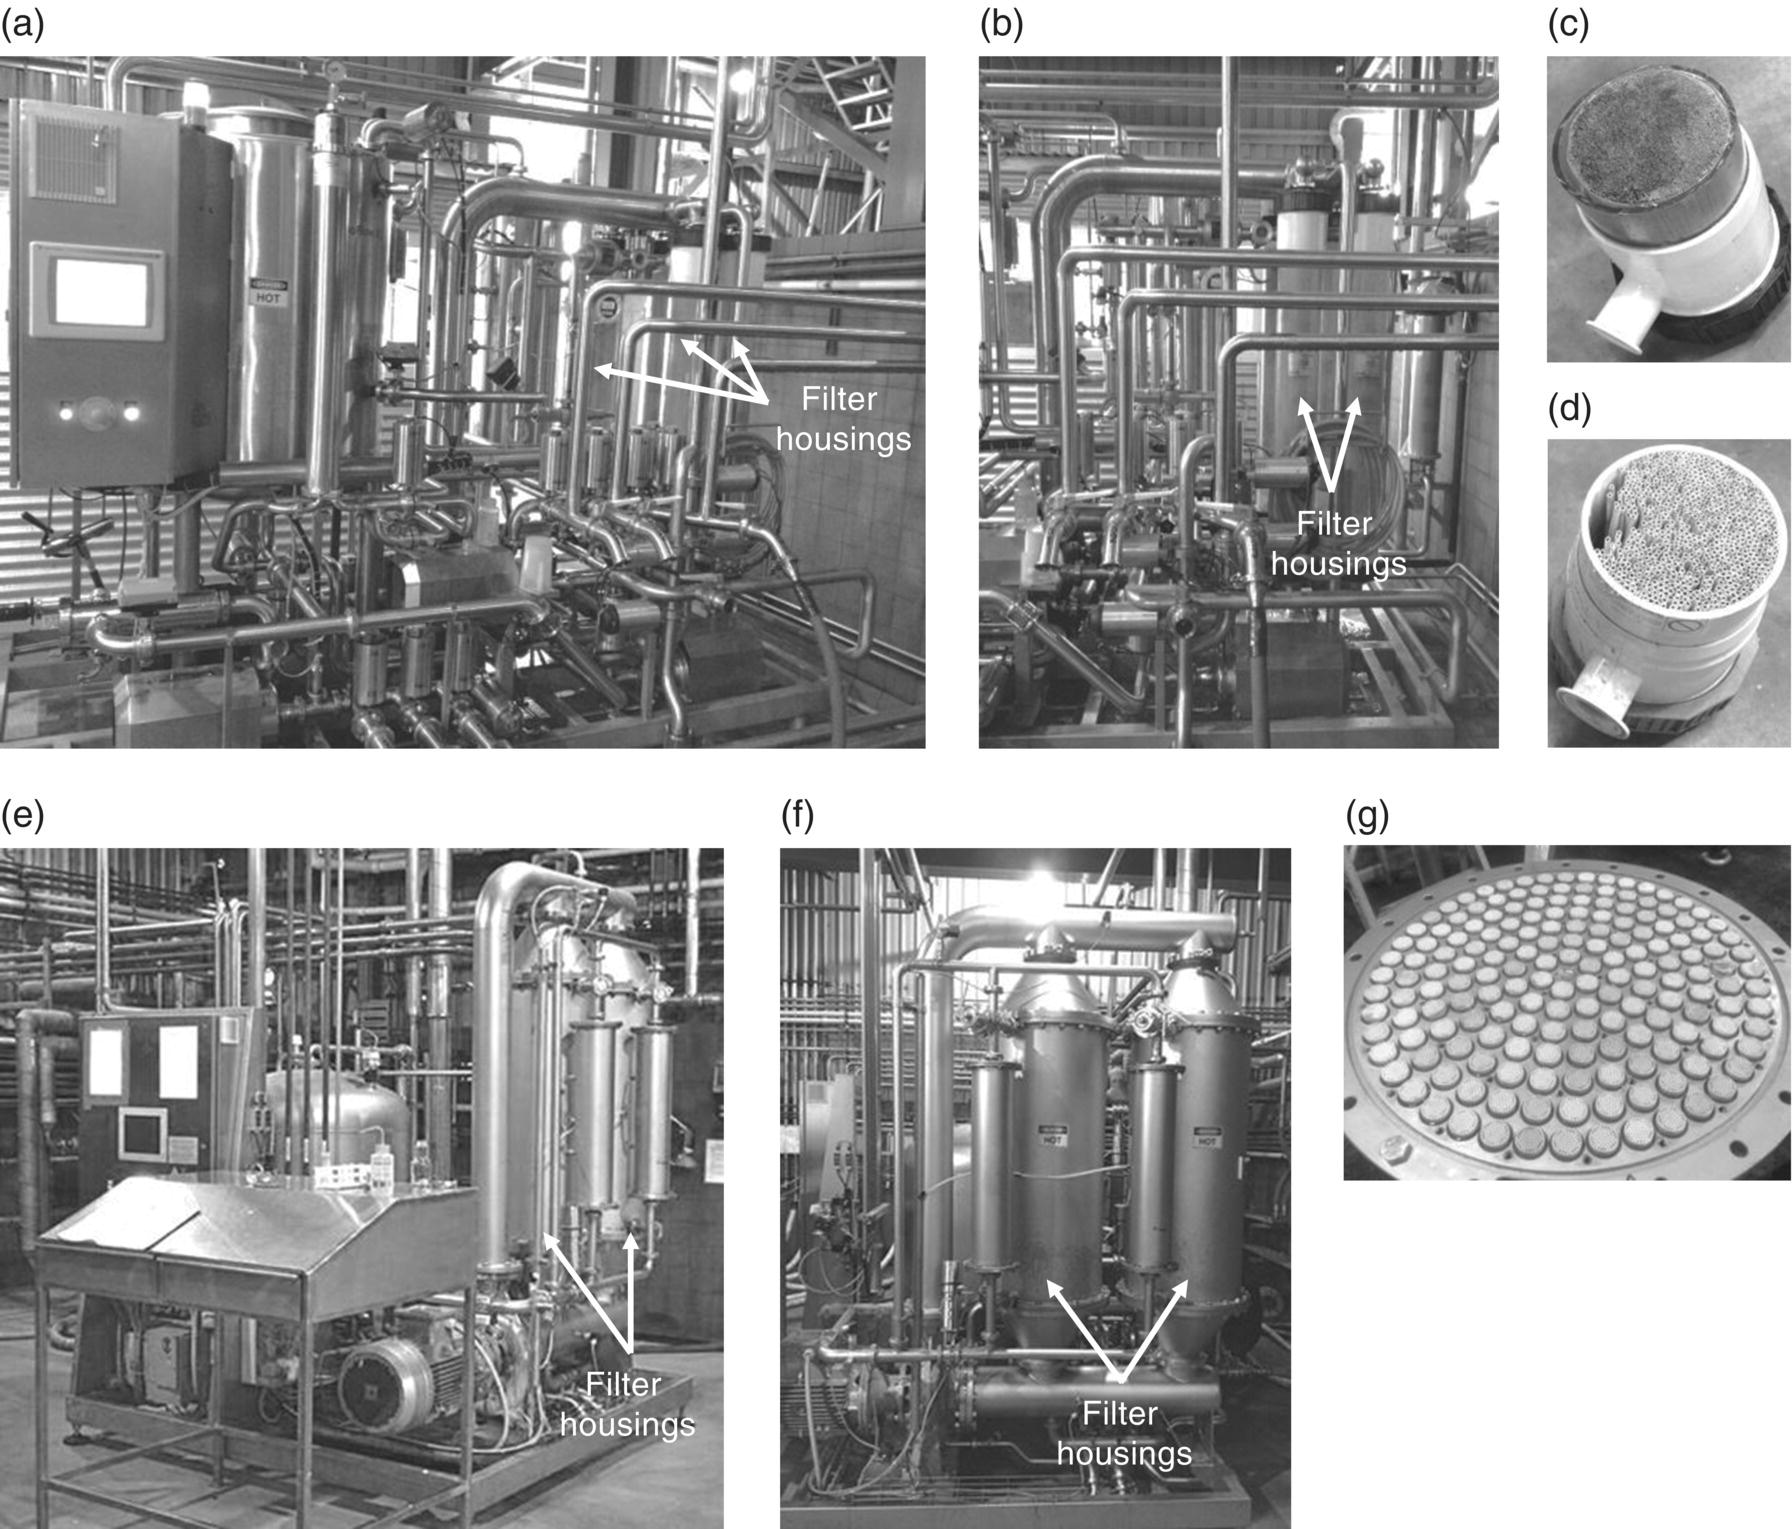
Figure 26.3.4 Winery crossflow filters include (a) front view and (b) side view of a polymer membrane system containing hollow fibers in either (c) normal high flow and (d) high solids lees (note wider fiber bore) housings, and (e) front view and (f) side view of a ceramic membrane system containing (g) numerous filter candles in a housing.
Source: (c), (d), (e), and (g) reproduced with permission of Luke Wilson
Finally, filtration may be classified by the size of particles designed to be retained, referred to as the cut‐off (usually given in micrometers, Table 26.3.1). An absolute cut‐off indicates that 100% of particles greater than the rated particle size will be filtered out. Absolute cut‐off values are only valid if the medium has entirely consistent pore sizes and the particles are spherical. Many filter media and filtrates do not strictly satisfy this description, and nominal cut‐off is used to define a minimum percentage of particles larger than the filter rating that will be retained. Because depth filtration does not employ defined pore sizes, it is invariably described by nominal cut‐off values, and will not be used to achieve sterile filtration (no microbes in the filtrate). A range of characteristics related to winery filtration is summarized in Table 26.3.1 and typical filtration sequences for different wine types are shown in Table 26.3.2. A more thorough discussion of filtration topics can be found in practical wine texts [6, 7].
Table 26.3.1 Characteristics of separations using different filtration processes
| Process | Nominal cut‐off | Typical use | Typical filter type/media | |
| µm | g/mol | |||
| Particle filtration (macro) | 100–1000 | – | Juice or wine fractions with high solids content, e.g., yeast lees, grape solids. Often used soon after fermentation | Cake filtration with diatomaceous earth (DE) or perlite |
| Particle filtration (micro) | 1–100 | – | Removal of dirt, crystalline matter, wine lees, insoluble fining agents such as bentonite. During wine cellaring or prior to microfiltration | Depth filter (DE, perlite, or cellulose sheet) |
| Microfiltration | 0.1–10 | >100 000 | Yeast, bacteria, and particle removal. Haze removal or wine stabilization prior to bottling | Depth filter (cellulose sheet or lenticular module) or membrane filter (crossflow or pleated polymer cartridge [sterile]) |
| Ultrafiltration/ nanofiltration |
>0.001–0.1 | 200–100 000 | Colloids, large molecules, viruses. Typically of little use in a winery | Membrane filter (crossflow) |
| Reverse osmosis | 0.0001–0.001 | 1–200 | Removal of small molecules. Alcohol adjustment or fault removal throughout winemaking process | Membrane filter (crossflow) |
Table 26.3.2 Typical filtration sequences used on different white and red wines prior to bottling. Crossflow filtration can replace the lenticular filtration steps if it has been conducted within several weeks of the final filtration sequence
| Wine | Sequence of filtration (from left to right) | |||
| Medium lenticular |
Fine lenticular |
Membranes a | Sieve b | |
| White | ||||
| Typical | × | ✓ | ✓ | ✓ |
| Sparkling | × | ✓ | ✓ | × |
| Red | ||||
| Typical | ✓ | × | × | ✓ |
| Sweet/low SO2 | ✓ | × | ✓ | ✓ |
| Premium/super premium | × | × | × | ✓ |
a Consists of pre‐filter (0.65 µm) and final filter (0.45 µm).
b Stainless steel gauze with a large cut‐off (e.g., 45 µm) that serves as a final catch‐point for foreign objects.
26.3.3 Filtration and fouling
Most filtration models utilize Darcy’s Law or one of its variations to explain how flow will vary during filtration or with different filtration media. This can be expressed in several ways, including:

where J is the flux, or the filtrate volume per unit surface area of the filter, and μ is the viscosity of the feed. The flow is created by a pressure drop (ΔP) across the filter, that is, the difference in pressure between the feed and filtrate sides of the filter.6 R t is the total resistance of the system, and comprises both the resistance created by the filter medium as well as additional resistance from the filter cake or blocking. The inverse of the resistance is the permeability, expressed as Darcy units,7 and is a measure of how easily a filter medium allows liquid to pass through and is widely used to evaluate filter performance. Generally speaking, lower resistance (and higher flux) is more desirable in production settings.
As filtration is performed on a wine, R t will increase due to deposition of solids on the filter media or filter cake. Unless pressure is increased over a filtration run, the flux will decrease (see Figure 26.3.1). Several mechanisms can explain this increase in resistance (Figure 26.3.5):
- Deposition of filter cake. This results in an increase in resistance as the liquid must traverse a longer distance through pores within the cake. Cakes may be incompressible, as would be formed from rigid particles like DE, or compressible, as would be formed by organic material. In particular, flexible macromolecules like pectins can generate a gelatinous, compressible filter cake at the membrane surface. The resistance of compressible cakes increases with increasing pressure drop, and often results in a greater loss of flux than incompressible cakes.
- Particles can block pores directly. This blockage may occur within the pores of the filter medium (standard blocking) or as a result of complete or partial (bridging) obstruction of pores at the filter medium surface.
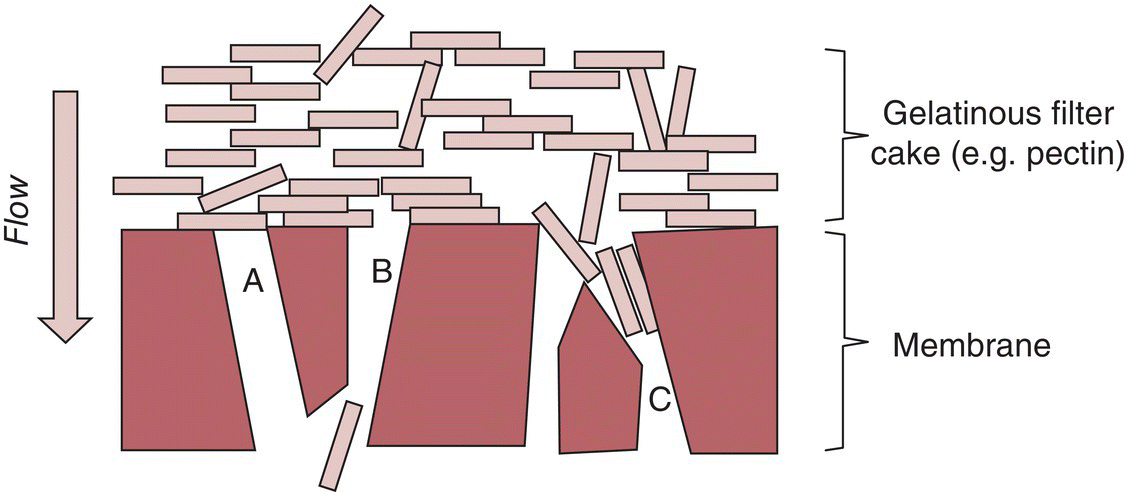
Figure 26.3.5 Representation of mechanisms responsible for filter fouling during wine filtrations showing a gelatinous filter cake and direct blockage of pores by particles [8], either through complete (A) or bridging (B) obstruction at the surface, or internally (“standard” blocking model, C)
Several empirical and theoretical models have been developed to characterize the change in resistance (and thus flux) over the course of a dead‐end filtration.8 A review of all models is well outside the scope of this book, but many wine filtrations can be well‐modeled through the power model [6], where α and b are empirically derived constants, and V/A is the total volume filtered per unit area of the filter:

Incompressible cakes, as occur when filter aids like DE are added, can be well modeled by b = 1 (i.e., the resistance increases linearly with the volume of juice filtered). The various blocking models use b = 2–3 and filtration of most real wines by pad filtration falls in the range of b = 1.5–4 [9].
The change in resistance over time has a profound effect on the filterability of a wine. Wines with poor filterability will show a strong (and undesirable) exponential increase in resistance (high b values) over the course of filtration. Filterability is often characterized empirically by a filterability index (FI) for a specific wine and a specific filter (usually a membrane) [10]. Several methods for calculating FI exist and generally involve comparing the time necessary to filter two successive volumes of wine through a microfiltration membrane of defined characteristics [10–12]. For example, one approach uses FI < 20 as a criteria for acceptable filterability:

Filterability for cellared wines prior to bottling is often poorly correlated with the amount of solids in the wine (Figure 26.3.6).
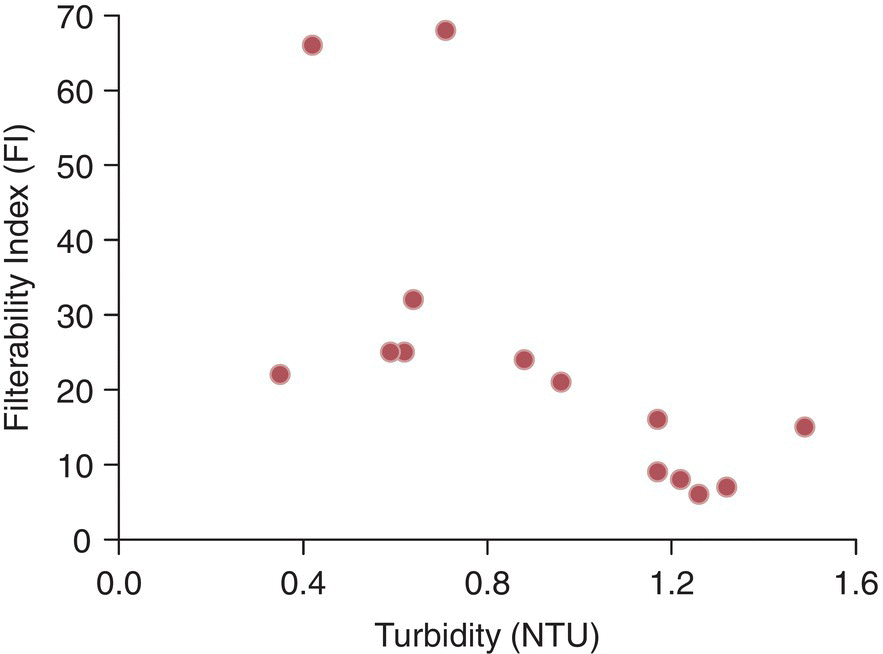
Figure 26.3.6 Comparison of turbidity (NTU, proxy for suspended solids) and filterability index (FI) for 14 red and white wines prior to membrane filtration and bottling. Data for three wines with intermediate NTU and FI > 500 are not shown.
Data from Reference [12]
Several studies have investigated the cause of fouling by studying the composition of foulants and through simulations using synthetic wines, primarily in membrane filtrations (reviewed in Reference [13]). This work has implicated colloidal material formed from macromolecules,9 particularly:
- Grape‐derived polysaccharides (primary cause)
- Polyphenols, for example, proanthocyanidins
- Mannoproteins.
Interestingly, the particles most commonly implicated in fouling are smaller (1–100 nm) than the typical pore sizes encountered in microfiltration (0.2 or 0.45 µm). As shown in Figure 26.3.7, fouling (decrease in flux) can occur even in a synthetic wine containing polysaccharides or polyphenols and with no particles >0.2 µm [8]. Studies of juice indicate that fouling begins with blocking of pores, with cake formation occurring later [14]. Unless incompressible filter aids like DE are used, the cakes formed during wine filtrations tend to be gelatinous and highly compressible. Having a more turbid wine (e.g., more microbial lees) can potentially improve filterability by generating a cake more rapidly and preventing pore fouling (see Figure 26.3.5) [14].
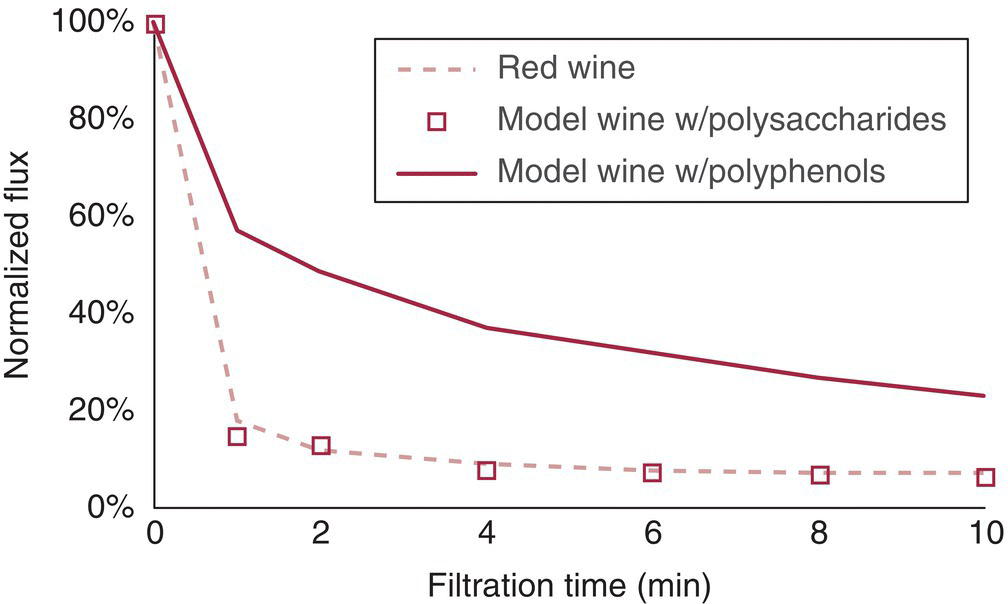
Figure 26.3.7 Change in flux (a proxy for fouling) versus time for crossflow microfiltration (0.2 µm) of a red wine, and two synthetic wines containing either wine polysaccharide or polyphenol fractions.
Data from Reference [15]
Both the physical and chemical properties of membranes will affect their adsorption of macromolecules:
- Membrane surface roughness increases the rate of fouling during microfiltration, presumably by creating areas that are not well swept by the filtration flux [16].
- Alumina (Al2O3) membranes and many other ceramics will have a positive surface charge at wine pH. This can lead to electrostatic interactions with wine components, particularly acidic macromolecules like pectic polysaccharide fragments (Chapter 2) [17]. Because other ions in the wine can shield the positive surface charge of alumina through formation of a double layer, these interactions will be stronger at higher flow rates, which disrupt the shielding. This type of interaction is a form of electrokinetic capture (or zeta‐potential filtering).
- Adsorption of macromolecules on organic membranes will involve non‐covalent interactions. For example, polyethersulfone (PES) membranes are reported to adsorb polysaccharides more strongly (and foul more rapidly) than polypropylene (PP) membranes because of their H‐bonding capability [13].
26.3.4 Reverse osmosis
RO is used to selectively remove small dissolved molecules (i.e., around 200 g/mol or less10) to concentrate juice or must (i.e., remove water) or make corrections to wine composition (e.g., decrease volatile acidity (VA), acids, taints, and alcohol) [18–20]. In comparison to membrane microfiltration, RO membranes have much smaller nominal cut‐offs in the nm range (Table 26.3.1). The lower permeability means RO membranes must operate at much higher pressures, up to about 80 bar, compared to around 1 bar for most microfiltration membranes. Selectivity is governed by molecular size of the solute, but is also strongly affected by the chemistry of the membrane and its interactions with solutes [21,22]. For compounds of similar molecular weight, factors tending to increase rejection (i.e., retention by the membrane) are:
- Molecules with higher hydrophobicity/lower polarity through binding to the membrane
- Larger apparent “size” of solutes, either due to hydration or branching of molecules
- Like charges on membrane and solute leading to electrostatic repulsion
- Ionization and extent of charge on solutes causing greater hydration.
During normal osmosis water will travel through a membrane from low (permeate) to high (retentate) solution concentrations, and the drive experienced by water is referred to as the osmotic pressure. As the name implies, reverse osmosis requires that the process of osmosis happens in reverse, where water or other small solutes must flow from the more concentrated solution (retained wine) to a less concentrated solution. This can only occur when the transmembrane pressure (i.e., the pressure difference between retentate and permeate) is greater than the osmotic pressure. Due to practical limitations on pressures achievable with commercial pumps and membranes, the osmotic pressure effectively limits the degree of concentration achievable, such as when increasing sugar concentration along with other components in a juice by RO (to a maximum of around 27 °Brix) [23,24].
The permeate from RO filtration of wine will contain water as well as other low molecular weight compounds such as ethanol and acetic acid. Unlike treating juice, the typical goal during RO of wine is not to concentrate the retentate, but instead to prepare the permeate for a subsequent step that removes an unwanted component. Following that treatment, such as recovery of ethanol by distillation in the case of lowering wine alcohol content [25] (Chapter 26.4), the permeate can be recombined with the concentrated retentate, thereby reconstituting the wine. RO is thus a useful pre‐treatment process for decreasing unwanted low molecular weight components because it affords a level of selectivity. In addition to decreasing alcohol in wine, treatments include removing VA by anion exchange resin [26] and eliminating taints caused by volatile phenols (i.e., wines affected by Brettanomyces or bushfire smoke) through their adsorption on resins [27, 28].
26.3.5 Sensory effects of filtration
The typical cut‐offs for haze removal and microbial stabilization (>0.2 µm) are larger than all compounds known to have a flavor impact on wine. However, as described above, filter fouling typically arises from adsorption and bridging by smaller macromolecules like polysaccharides and polyphenols that can contribute to the mouthfeel of wine. Adsorptive losses of smaller molecules (e.g., odorants, bitter compounds) is also well documented in the food industry.11 Potentially, large flavorless solutes that could serve as flavor precursors could also be removed. As a result, filtration – and particularly membrane microfiltration – is viewed with suspicion by some wine producers. However, anecdotal accounts (and, to some extent, the peer‐reviewed literature) regarding the chemosensory effects of filtration are confounded by several factors:
- Lack of filtration leaves the wine susceptible to growth of spoilage organisms (e.g., Brettanomyces, lactic acid bacteria), which can change wines’ sensory properties.
- Contaminated or poorly cleaned filter media can taint wines.
- Transfer operations during filtration can introduce oxygen.
With these caveats, existing literature does indicate that membrane microfiltration can result in small but significant decreases in flavor or color compounds (Table 26.3.3), particularly anthocyanins and other polyphenols [13, 29–32]. Significant differences in some aroma properties are occasionally noted, but studies on the effects of microfiltration on wine odorants are scarce, and may be of lesser importance – one report has shown significant (and minor) decreases for only three odorants out of over 100 quantified following microfiltration on hydrophobic membranes [29].
Table 26.3.3 A selection of data from studies assessing changes to wine sensory and chemical properties arising from different filtration processes. Data from References [29] to [32]
| Sample | Description of Filter Media | Parameters Affected |
| Cabernet Sauvignon wine Compared before/after filtration | Membrane filter with polypropylene pre‐filter (1.2 µm) and PVDF final filter (0.65 µm) | Lower in color intensity (2%), total polyphenols (9–13%), anthocyanins (2–3%) and tannins (2–6%) Lower concentrations for a small number of volatiles Significant sensorial differences related to body and aroma |
| Synthetic red wine containing marc extract and model polyphenol and polysaccharide Compared binding by polymer types | PES or PP hollow fiber membranes (0.2 µm) as used in a crossflow filter | Greater binding of polysaccharide compared to polyphenol on PES (2‐fold) and PP (4‐fold)Greater binding of polyphenol (10‐fold) and polysaccharide (17‐fold) by PES membrane |
| Red wine blend Compared to unfiltered wine | Crossflow with hollow fiber PES membrane (0.2 µm) | Sensory profile up to two months was relatively constant for all samples; in control wines after this point berry and stone fruit aromas decreased and oak, grassy, earthy and smoke aromas increasedLower in A420, A520 and color density (1–10%) compared to controlLower in the concentrations of tannin (8–26%) and anthocyanin (5–10%) compared to control |
| Malbec and rosé wines Compared to unfiltered wine | Sequential filtration through coarse and tight pads (cellulose or cellulose+DE), then two membrane filters (0.45 µm, PES or Nylon) | Lower in color intensity in all cases, as follows: Malbec Cellulose pads then PES membranes, 11.0% Cellulose+DE pads then Nylon membranes, 17.5% RoséCellulose pads then PES membranes, 21.8% Cellulose+DE pads then Nylon membranes, 46.5% |
References
- 1. Holdich, R.G. (2002) Filtration of liquids, in Fundamentals of particle technology , Midland Information Technology and Publishing, Shepshed, UK, pp. 29–44.
- 2. Ripperger, S., Gösele, W., Alt, C., Loewe, T. (2013) Filtration, 1. Fundamentals, in Ullmann’s Encyclopedia of industrial chemistry , Wiley‐VCH Verlag GmbH & Co. KGaA, Weinheim, Germany, pp. 1–38.
- 3. Ripperger, S., Gösele, W., Alt, C., Loewe, T. (2013) Filtration, 2. Equipment, in Ullmann’s Encyclopedia of industrial chemistry , Wiley‐VCH Verlag GmbH & Co. KGaA, Weinheim, Germany, pp. 1–40.
- 4. Tilton, J.N. (2008) Fluid and particle dynamics, in Perry’s chemical engineers’ handbook , 8th edn (eds Green, D.W. and Perry, R.H.), McGraw‐Hill, New York.
- 5. Genck, W.J., Dickey, D.S., Baczek, F.A., et al. (2008) Liquid–solid operations and equipment, in Perry’s chemical engineers’ handbook , 8 edn (eds Green, D.W. and Perry, R.H.), McGraw‐Hill, New York.
- 6. Boulton, R.B., Singleton, V.L., Bisson, L.F., Kunkee, R.E. (1999) Principles and practices of winemaking , Kluwer Academic/Plenum Publishers, New York.
- 7. Zoecklein, B.W., Fugelsang, K.C., Gump, B.H., Nury, F.S. (1999) Wine analysis and production , Kluwer Academic/Plenum Publishers, New York.
- 8. El Rayess, Y., Albasi, C., Bacchin, P., et al. (2011) Cross‐flow microfiltration of wine: effect of colloids on critical fouling conditions. Journal of Membrane Science , 385–386, 177–186.
- 9. de la Garza, F. and Boulton, R. (1984) The modeling of wine filtrations. American Journal of Enology and Viticulture , 35 (4), 189–195.
- 10. Peleg, Y., Brown, R.C., Starcevich, P.W., Asher, R. (1979) Method for evaluating the filterability of wine and similar fluids. American Journal of Enology and Viticulture , 30 (3), 174–178.
- 11. Alarcon‐Mendez, A. and Boulton, R. (2001) Automated measurement and interpretation of wine filterability. American Journal of Enology and Viticulture , 52 (3), 191–197.
- 12. Bowyer, P., Edwards, G., Eyre, A. (2012) NTU vs wine filterability index – what does it mean for you? The Australian and New Zealand Grapegrower and Winemaker , 585, 76–80.
- 13. El Rayess, Y., Albasi, C., Bacchin, P., et al. (2011) Cross‐flow microfiltration applied to oenology: a review. Journal of Membrane Science , 382 (1–2), 1–19.
- 14. Salgado, C., Palacio, L., Carmona, F.J., et al. (2013) Influence of low and high molecular weight compounds on the permeate flux decline in nanofiltration of red grape must. Desalination , 315, 124–134.
- 15. Vernhet, A. and Moutounet, M. (2002) Fouling of organic microfiltration membranes by wine constituents: importance, relative impact of wine polysccharides and polyphenols and incidence of membrane properties. Journal of Membrane Science , 201 (1), 103–122.
- 16. Lee, N., Amy, G., Croué, J.‐P., Buisson, H. (2004) Identification and understanding of fouling in low‐pressure membrane (MF/UF) filtration by natural organic matter (NOM). Water Research , 38 (20), 4511–4523.
- 17. Belleville, M.P., Brillouet, J.M., De La Fuente, B.T., Moutounet, M. (1992) Fouling colloids during microporous alumina membrane filtration of wine. Journal of Food Science , 57 (2), 396–400.
- 18. Massot, A., Mietton‐Peuchot, M., Peuchot, C., Milisic, V. (2008) Nanofiltration and reverse osmosis in winemaking. Desalination , 231 (1–3), 283–289.
- 19. Wollan, D. (2010) Membrane and other techniques for the management of wine composition, in Managing wine quality (ed, Reynolds, A.G.), Woodhead Publishing, Cambridge, UK, pp. 133–163.
- 20. El Rayess, Y. and Mietton‐Peuchot, M. (2015) Membrane technologies in wine industry: an overview of applications and recent developments. Critical Reviews in Food Science and Nutrition. doi: 10.1080/10408398.2013.809566.
- 21. Bellona, C., Drewes, J.E., Xu, P., Amy, G. (2004) Factors affecting the rejection of organic solutes during NF/RO treatment – a literature review. Water Research , 38 (12), 2795–2809.
- 22. Kucera, J. (2010) Basic terms and definitions, in Reverse osmosis: design, processes, and applications for engineers , John Wiley & Sons, Inc., Hoboken, NJ, pp. 21–40.
- 23. Mietton‐Peuchot, M., Milisic, V., Noilet, P. (2002) Grape must concentration by using reverse osmosis. Comparison with chaptalization. Desalination , 148 (1–3), 125–129.
- 24. Kiss, I., Vatai, G., Bekassy‐Molnar, E. (2004) Must concentrate using membrane technology. Desalination , 162, 295–300.
- 25. Schmidtke, L.M., Blackman, J.W., Agboola, S.O. (2012) Production technologies for reduced alcoholic wines. Journal of Food Science , 77 (1), R25–R41.
- 26. Smith, C.R. (inventor) (1996) Apparatus and method for removing compounds from a solution. US Patent US5480665 A, 1996.
- 27. Ugarte, P., Agosin, E., Bordeu, E., Villalobos, J.I. (2005) Reduction of 4‐ethylphenol and 4‐ethylguaiacol concentration in red wines using reverse osmosis and adsorption. American Journal of Enology and Viticulture , 56 (1), 30–36.
- 28. Fudge, A.L., Ristic, R., Wollan, D., Wilkinson, K.L. (2011) Amelioration of smoke taint in wine by reverse osmosis and solid phase adsorption. Australian Journal of Grape and Wine Research , 17 (2), S41–S48.
- 29. Arriagada‐Carrazana, J.P., Sáez‐Navarrete, C., Bordeu, E. (2005) Membrane filtration effects on aromatic and phenolic quality of Cabernet Sauvignon wines. Journal of Food Engineering , 68 (3), 363–368.
- 30. Ulbricht, M., Ansorge, W., Danielzik, I., et al. (2009) Fouling in microfiltration of wine: the influence of the membrane polymer on adsorption of polyphenols and polysaccharides. Separation and Purification Technology , 68 (3), 335–342.
- 31. Bowyer, P., Edwards, G., Eyre, A. (2013) Wine filtration and filterability – a review of whatʼs new. The Australian and New Zealand Grapegrower and Winemaker , 599, 76–80.
- 32. Buffon, P., Heymann, H., Block, D.E. (2014) Sensory and chemical effects of cross‐flow filtration on white and red wines. American Journal of Enology and Viticulture , 65 (3), 305–314.