13
Key Metric Shenanigan No. 1: Showcasing Misleading Metrics That Overstate Performance
Above all, do no harm.
—HIPPOCRATES, THE FATHER OF WESTERN MEDICINE
Newly minted doctors are required to take the Hippocratic oath and pledge their commitment to practice medicine ethically. This oath is widely attributed to Hippocrates, the father of Western medicine, in the fourth century BC, and the gist of it can be boiled down to “Above all, do no harm.”
Perhaps corporate managers should be made to study this solemn oath taken by physicians and apply it in earnest when they communicate with investors. In so doing, they would pledge to never knowingly harm investors and always refrain from showcasing metrics that misrepresent performance. Based on what you have already seen in this book, that day seems way off in the horizon. Well, we can only dream that such a day will eventually come! Until it arrives, however, investors must be alert to the following three techniques that management can use to obfuscate company performance.
Techniques to Showcase Misleading Metrics That Overstate Performance
1. Highlighting a Misleading Metric as a Surrogate for Revenue
Many people consider revenue growth to be an important and straightforward measure of the overall growth of a business. Companies also frequently provide additional data points to supplement revenue, providing investors with more insight into product demand and pricing power. As discussed in the previous chapter, investors should welcome this additional information and analyze these supplemental non-GAAP revenue metrics to better assess the sustainable business performance. However, sometimes these revenue surrogates provided by management can be misleading and can harm investors if they have not put appropriate safeguards in place. In this first section, we highlight ways in which companies can be less than honest using common revenue surrogates and how careful investors can protect themselves.
Same-Store Sales
Revenue growth at retailers and restaurants is often fueled by the opening of additional stores. Logically, companies that are in the middle of a rapid store expansion show tremendous revenue growth, since they have many more stores this year than they had the prior one. While total company revenue growth may give some perspective on a company’s size, it gives little information on whether the individual stores are performing well. Investors should therefore focus more closely on a metric that measures how the company’s stores have been performing.
To provide investors with that insight, management often reports a metric called same-store sales (SSS) or comparable-store sales. This metric establishes a comparable base of stores (“comp base” for short) with which to calculate revenue growth, allowing for more relevant analysis of true operating performance. For example, a company may present its revenue growth for stores that have been open for at least one year. Companies often prominently disclose SSS in their Earnings Releases, and investors use it as a key indicator of company performance. Many consider same-store sales to be the most important metric in analyzing a retailer or restaurant. We agree that if it is reported in a logical and consistent manner, SSS is extremely valuable for investors.
However, because same-store sales (and the other metrics discussed in Part Four) fall outside of GAAP coverage, no universally accepted definition exists, and calculations may vary from company to company. Worse, a company’s own calculation of SSS in one quarter may differ from the one used in the previous period. While most companies compute their same-store sales honestly and disclose them consistently, “bad apples” try to dress up their results by routinely adjusting their definition of SSS. Investors, therefore, should always be alert to the presentation of same-store sales to ensure that it fairly represents a company’s operating performance.
Compare Same-Store Sales to the Change in Revenue per Store When a company experiences consistent growth, same-store sales should be trending up consistently with the average revenue at each store. By comparing SSS with the change in revenue per store (i.e., total revenue divided by average total stores), investors can quickly spot positive or negative changes in the business. For example, assume that a company’s SSS growth has been consistently tracking well with its revenue per store growth. If a material divergence in this trend suddenly appeared, with SSS accelerating and revenue per store shrinking, investors should be concerned. This divergence indicates one of two problems: (1) the company’s new stores are beginning to struggle (driving down revenue per store, but not affecting SSS because they are not yet in the comp base), or (2) the company has changed its definition of same-store sales (which affects the SSS calculation but not total revenue per store).
Watch for Changes in the Definition of Same-Store Sales Companies usually disclose how they define same-store sales. Once the definition is disclosed, investors should have little difficulty tracking it from period to period. Companies can manipulate same-store sales by adjusting the comp base in two possible ways. The first involves simply changing the length of time before a store enters the comp base (for example, requiring a store to be open for 18 months, versus 12 months previously). The second trick involves changing the types of stores included in the comp base (for example, excluding certain stores based on geography, size, businesses, remodeling, and so on).
Coach Inc., the New York City–based fashion company, made such a change in 2013. Historically, when Coach expanded a store’s square footage by at least 15 percent, it excluded these stores’ sales from the comp base until one year after completing the expansion. This made sense since larger stores generally have higher sales, and any growth related to a large store expansion should not really be considered same-store sales. Yet Coach decided that beginning in 2014 it would no longer exclude these store expansions from its comp base, meaning its same-store sales metric would include an unsustainable benefit related to growth in store size. Not surprisingly, this change came just as same-store sales was slowing and the company was embarking on a multiyear plan to expand some of its most productive stores.
Pay Close Attention to Which Parts of the Business Reported Growth Reflects In 2013, Thomson Reuters, the Toronto-based media juggernaut, reported “revenue growth before currency” of 2 percent. This figure stood in contrast to the more standard rate of change in reported sales versus the prior year, which was negative 3 percent. Which measure was more accurate? It turns out that not only did the headline figure adjust for the effects of currency, but it also only considered “ongoing businesses”; this was not a legal or accounting distinction the way that a “discontinued operation” is, but rather one that management made subjectively. The curious thing about this methodology was that in the 2013 Annual Report, the revenue from “ongoing businesses” in 2012 had fallen by almost $500 million compared with the revenue from “ongoing businesses” originally reported in 2012. It was only the retroactive recategorizing of certain businesses as non-“ongoing” that allowed Thomson Reuters to report positive sales growth in 2013, a period where by all objective measures the company declined. This clever scheme provided similar benefits in 2011 and 2012.
Average Revenue per User
When comparing key non-GAAP metrics across a peer group, it is important to ensure that these metrics are being calculated in the same way. For example, in the broadcast industry, a common metric analyzed is average revenue per user (ARPU), calculated as total subscription revenue divided by average subscribers. Calculating the average revenue per subscriber sounds like it should be simple; however, varying definitions of ARPU abound. Consider, for example, the different definitions at competitors Sirius Satellite Radio Inc. and XM Satellite Radio Holdings Inc. (before they merged in 2008). Sirius’s calculation of ARPU included revenue from subscriptions, advertising, and activation fees. XM Radio, on the other hand, calculated ARPU using only revenue from subscriptions; advertising revenue and activation fees were excluded. (See the accompanying box.) To compare ARPU at the two companies on an apples-to-apples basis, investors would have had to either adjust Sirius’s ARPU calculation to exclude advertising revenue and activation fees or adjust XM’s ARPU calculation to include these revenue sources.
Subscriber Additions and Churn
Let’s go back to our discussion of subscription-based businesses from earlier in this chapter. Since these types of companies (e.g., research providers, telephone companies, newspapers, fitness clubs, and so on) rely on new subscribers for growth, it is helpful for investors to monitor subscriber levels to get a sense of the latest trends in the business. Logically, the number of new subscriber additions each quarter is often a good leading indicator of upcoming revenue. Similarly, the level of cancellations (called “churn”) is important to know when assessing the business. If a company shows a healthy subscriber base with growth in new subscribers and shrinking churn, investors can expect strong revenue growth ahead. That is, unless the company is manipulating these metrics.
In the late 1990s, AOL, for example, found a clever way to inflate the number of subscribers to its online Internet service. One of the ways in which AOL sold subscriptions was to sell “bulk subscriptions” to corporations, which would then distribute these subscriptions to employees as a perk. AOL did not include these bulk subscription sales in its subscriber count because it knew that many of these subscriptions would never actually be activated. When employees did sign up, however, they rightfully entered the subscriber count.
In 2001, AOL was struggling to meet its subscriber targets. So the company began including the number of bulk subscriber sales in its subscriber count, even though most of these subscriptions were never activated. Moreover, AOL would ship these bulk subscription membership kits to customers immediately before the quarter end to meet targets for subscriber count.
Bookings and Backlog
Many companies disclose their quarterly “bookings” or “orders,” which are supposed to represent the amount of new business booked during the period. Companies may also disclose their backlog, which essentially represents their outstanding book of business or, in other words, all past orders that have yet to be filled (and recognized as revenue). “Book to bill” is also a common disclosure that compares current-period bookings to current-period revenue and is calculated as bookings divided by revenue.
If they are presented accurately, bookings and backlog are important indicators, as they provide investors with extra insight into upcoming revenue trends. However, since they are non-GAAP metrics, companies have plenty of leeway in how they define and disclose bookings and backlog. You would think the calculations would be straightforward, but indeed there are plenty of nuances in what should and should not be included. For example, different companies include the following types of orders differently in their presentation of bookings and backlog: cancelable orders, orders in which the quantity purchased is not defined, bookings for longer-term service or construction contracts, contracts with contingencies or extension clauses, bookings on noncore operations, and so on.
The varying definitions of bookings and backlog across companies make it extremely important for investors to understand exactly what the metric represents before putting any faith in it. Moreover, if the metric is a key performance indicator, investors should use extra diligence to ensure that the company does not change its own definition of bookings in a way that flatters the metric.
Some companies will present booking and backlog metrics that do not seem to accurately represent the underlying business economics. For example, First Solar, whose percentage-of-completion shenanigans you may remember from Chapter 3, played tricks with its bookings presentation as well. In its March 2014 earnings presentation, First Solar presented a “quarterly” bookings figure that included much more than a quarter’s worth of bookings. A close read of the fine print revealed that the bookings metric included all new bookings from the beginning of the quarter all the way through the date of the Earnings Release—a full 36 days after the quarter ended.
Consider also the unusual definition of backlog employed by electronic payments company ACI Worldwide. ACI presents a 60-month backlog metric in which all nonrecurring license arrangements are assumed to renew as recurring revenue streams. A better name for this metric would be “wishful thinking backlog.”
2. Highlighting a Misleading Metric as a Surrogate for Earnings
Warren Buffett has long poked fun at management teams that create dishonest pro forma metrics. He memorably compared this practice to an archer who shoots an arrow into a blank canvas and then draws a bull’s-eye around the implanted arrow.
EBITDA and Its Variations
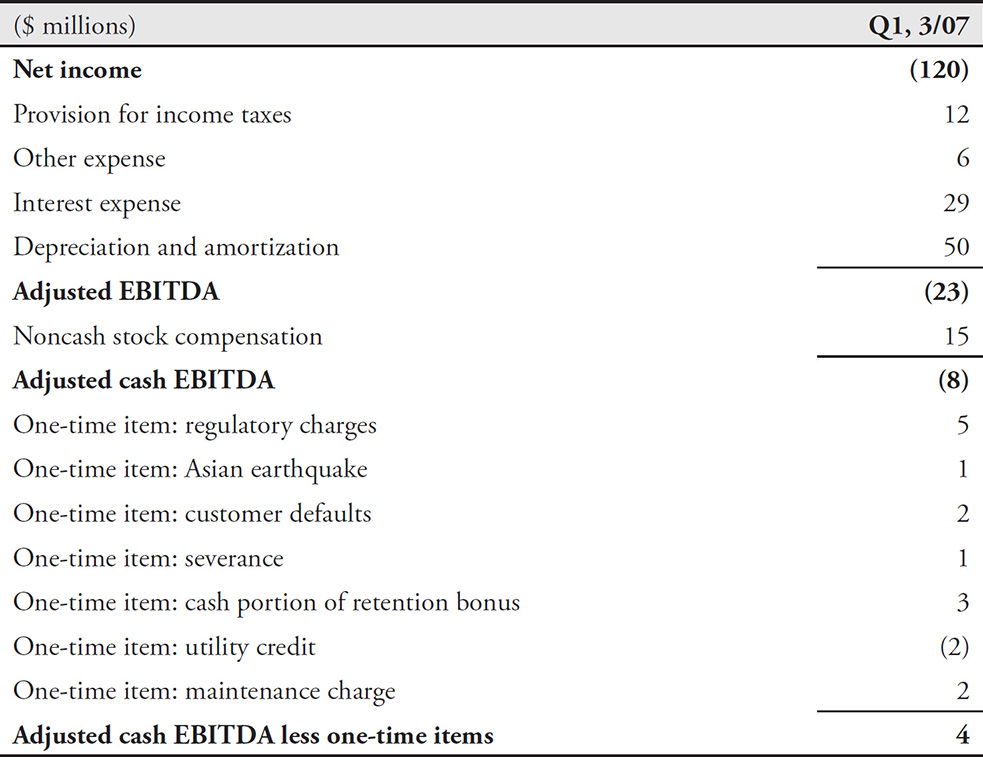
Consider the bull’s-eye drawn by the archers at Global Crossing. The company reported a net loss of $120 million in the March 2007 quarter. Desperate to show a profit, however, management removed expenses using a pro forma concoction reminiscent of its misdeeds during the dot-com bubble. First, management removed $97 million in expenses for interest, taxes, depreciation, and some other items to get to a metric it called adjusted EBITDA (earnings before interest, taxes, depreciation, and amortization). Then, it removed $15 million in noncash stock compensation expense, bringing the company to an adjusted cash EBITDA of negative $8 million. Close, but not all the way to profitability, management then removed a host of charges that it deemed one-time in nature, propelling the company to a positive $4 million in what it called adjusted cash EBITDA less one-time items. Bull’s-eye!
It is easy to be skeptical about Global Crossing’s three levels of pro forma, and it is hard not to laugh when looking at some of the “one-time” charges that the company removed. (See Table 13-1.) Last time we checked, expenses for “maintenance” were a normal cost of doing business and therefore should never be excluded from a pro forma calculation. Ditto for customer defaults (bad debts), employee retention bonuses, and routine regulatory charges. Do not be fooled into thinking these items will not recur just because management decides to present them as one-time in nature.
Table 13-1 Global Crossing’s Adjusted Cash EBITDA Less One-Time Items
Now You See It, Now You Don’t
On its June 2007 earnings call, flash memory manufacturer Spansion proudly stated that EBITDA grew to $72 million from $61 million the quarter before. The following quarter, Spansion reported that EBITDA fell to $71 million; however, the company soothed concerned investors by claiming that EBITDA increased by $8 million if you exclude a one-time real estate gain received in the previous quarter. Conveniently, this one-time gain was not excluded from EBITDA when earnings were reported the previous quarter. So Spansion essentially included the one-time gain to help show strong EBITDA growth in June, and then excluded the gain the next quarter to show strong EBITDA growth in September. You can’t have it both ways!
Watch for Clever Games to Inflate EBITDA
Travel technology company Sabre Corporation found a clever way to inflate its reported EBITDA by excluding an important component of its cost structure. Sabre often makes up-front payments to travel agencies in order to induce them to use the company’s travel reservation system; in 2016, these payments totaled $71 million. Because these up-front disbursements relate to multiyear contracts, the payments are capitalized and then amortized over the contract period. Since the costs hit the Income as an amortization expense, they are added back in the calculation of EBITDA. If EBITDA is meant to be a shorthand proxy for cash profitability, it’s hard to think of a justification for permanently excluding this type of cost that is paid in cash each and every period.
SEC Cracks Down on Groupon’s Misleading Operating Earnings Metrics
While Global Crossing, Spansion, and Sabre used interesting variations of EBITDA to make profits look more plentiful, other companies take it one step further—they create their own profitability metric. And that is exactly what Groupon did.
Recall in Chapter 4 that Groupon’s much-anticipated 2011 IPO ran into some early headwinds when the SEC forced the company to restate revenues. That restatement resulted in a massive cut in revenue previously reported in every period from 2009 through June 2011 by over 50 percent. Separately, the SEC also forced Groupon to stop reporting what the agency considered a very misleading non-GAAP metric, consolidated segment reporting operating income (CSOI). In Table 13-2, we show that Groupon tried to trick investors into believing the company was profitable by eliminating several items from income from operations: (1) online marketing expenses, (2) stock-based compensation, and (3) acquisition-related expenses. The non-GAAP metric that Groupon used, adjusted CSOI, transformed the GAAP-based losses to gains.
Table 13-2. Groupon’s Misleading Non-GAAP Metric
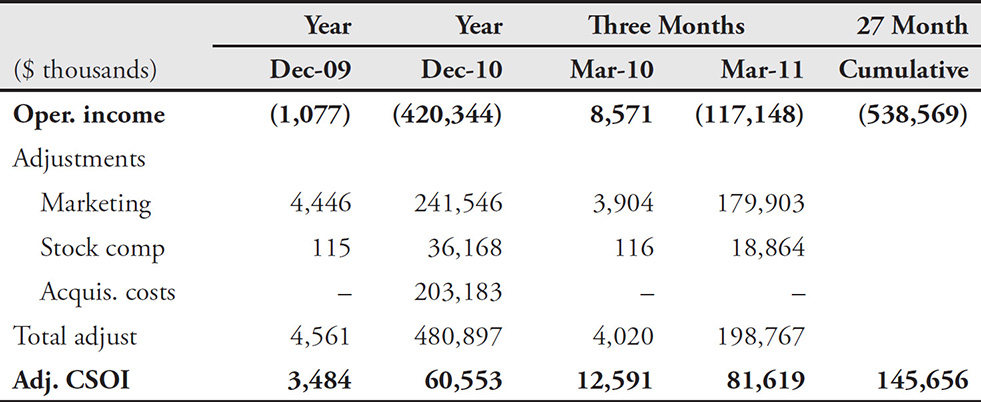
During the 27 months starting in January 2009, Groupon reported a cumulative GAAP-based operating loss totaling $536 million. However, the company wanted investors to instead use the misleading non-GAAP metric, adjusted CSOI, showing a cumulative profit of over $145 million. Fortunately, the SEC notified Groupon to stop using this misleading metric.
Pro Forma Earnings/Adjusted Earnings/Non-GAAP Earnings
What’s in a name? That which companies call earnings, by any other name would smell as sweet … or so management would like you to think. Sometimes management insists that a foul-smelling “pro forma” or “adjusted” earnings metric (or any other earnings metric with a qualifying name) is a sweet and pure measure of earnings.
Pretending That Recurring Charges Are One-Time in Nature You may recall that Peregrine Systems recorded bogus revenue and then tried to cover it up by fraudulently faking the sale of accounts receivable. Well, the company had so many bogus receivables that it also used pro forma tactics to hide the evidence of its chicanery. In addition to pretending to sell these receivables, Peregrine also took charges for these receivables, but it inappropriately classified those charges as nonrecurring and related to acquisitions. This classification gave Peregrine the cover to exclude these charges from its pro forma earnings presentation so investors would not be concerned (or at least those investors that always took the company at its word).
Whirlpool, one of the global leaders in large home appliances, reports a profitability metric called ongoing earnings that is meant to exclude the effects of nonrecurring and nonoperating items. One of the most common adjustments from GAAP earnings to “ongoing earnings” is restructuring charges that relate to a wide range of costs associated with the company’s M&A, plant closures, layoffs, and asset impairments, among others. However, restructuring charges have been on Whirlpool’s Income Statement in 23 of the past 27 years, hardly a “nonrecurring” cost! In October 2016, the SEC finally questioned the company’s perennial exclusion of these costs.
3. Highlighting a Misleading Metric as a Surrogate for Cash Flow
Non-GAAP cash flow metrics are less common than non-GAAP revenue and earnings disclosures; however, they do exist. Sometimes companies create a pro forma cash flow metric to exclude a nonrecurring activity, such as a large litigation settlement. However, other times, companies may look to artificially enhance their cash-generation profile.
“Cash Earnings” and EBITDA Are Not Cash Flow Metrics
Companies sometimes present metrics like “cash earnings” or “cash EBITDA” (as we just saw with Global Crossing). Do not confuse these metrics with substitutes for cash flow! Many companies and investors alike believe that these metrics (as well as plain old EBITDA) are good surrogates for cash flow simply because the calculation includes the adding back of noncash expenses such as depreciation. As you surely know by now, a company’s cash flow consists of much more than just net income plus noncash expenses. Calculating it in this way is just an abuse of using the indirect method of developing the Statement of Cash Flows (SCF) (refer to our discussion of cash flow presentation in the Part Three introduction). Ignoring working capital changes when calculating cash flow will provide you with a fictional portrait of a company’s cash-generation abilities, in the same way that ignoring accruals for expenses such as bad debts, impairments, and warranty expenses will give you an illusory sense of profitability. In truth, metrics such as EBITDA and cash earnings are poor representations of performance.
Moreover, for capital-intensive businesses, EBITDA is often a misleading measure of performance and profitability because all the major capital costs run through the Income Statement as depreciation, and therefore they are excluded from EBITDA. Some companies abuse the investment community’s acceptance of EBITDA and use the metric even though it is completely unwarranted.
Take, for example, the non-GAAP reporting at Gogo Inc., provider of in-flight Internet access. Gogo’s non-GAAP adjusted EBITDA metric ignores some basic costs of delivering its in-flight services including the production and installation of network equipment and system software. Gogo treats these costs appropriately for GAAP purposes: they are capitalized on the Balance Sheet and depreciated through the P&L. However, since these expenses are categorized as “depreciation and amortization,” they are eliminated from Gogo’s non-GAAP adjusted EBITDA. No surprise that Gogo has been able to show positive adjusted EBITDA every year since its 2013 IPO despite deeply negative GAAP net income.
Non-GAAP Cash Flow Metrics May Be Put There to Confuse
In Chapter 10, “Cash Flow Shenanigan No. 1: Shifting Financing Cash Inflows to the Operating Section,” we discussed how in 2000 Delphi Corp. improperly recorded a loan from the bank as the sale of inventory and in doing so boosted cash flow from operations by $200 million. Well, management at Delphi also liked to mislead investors by presenting tricky cash flow metrics. For example, Delphi routinely headlined its “Operating Cash Flow” in its Earnings Releases. No doubt, many people thought that Delphi was discussing its CFFO; however, this was not the case. “Operating Cash Flow” was actually Delphi’s deceptively named surrogate for GAAP cash flow from operations. Since the name is so close to its GAAP compadre, you can imagine how many investors were confused into thinking that this pro forma metric was Delphi’s actual CFFO. In truth, this surrogate barely resembled GAAP cash flow from operations. As shown in Table 13-3, it was calculated as net income plus depreciation and other noncash charges minus capital expenditures plus some huge mystery item labeled “other.”
Table 13-3 Delphi’s GAAP Cash Flow Versus Pro Forma Cash Flow, 2000
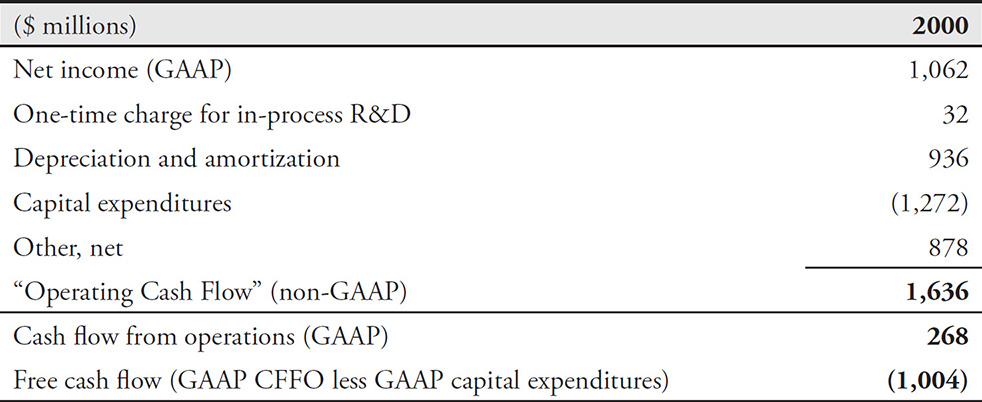
We mentioned earlier that Delphi’s actual CFFO (as reported on the SCF) was $268 million, but its self-defined “Operating Cash Flow” (as presented in the Earnings Release) was $1.6 billion—an astonishing differential of almost $1.4 billion. Since this cash flow surrogate includes the impact of capital expenditures, it may be more relevant to compare it with Delphi’s free cash flow (CFFO less capital expenditures) of negative $1.0 billion—bringing our differential to an outrageous $2.6 billion. (Oh, by the way, that $268 million in CFFO reported on the SCF was only $68 million if you exclude the sham sale of inventory that we discussed in Chapter 10.)
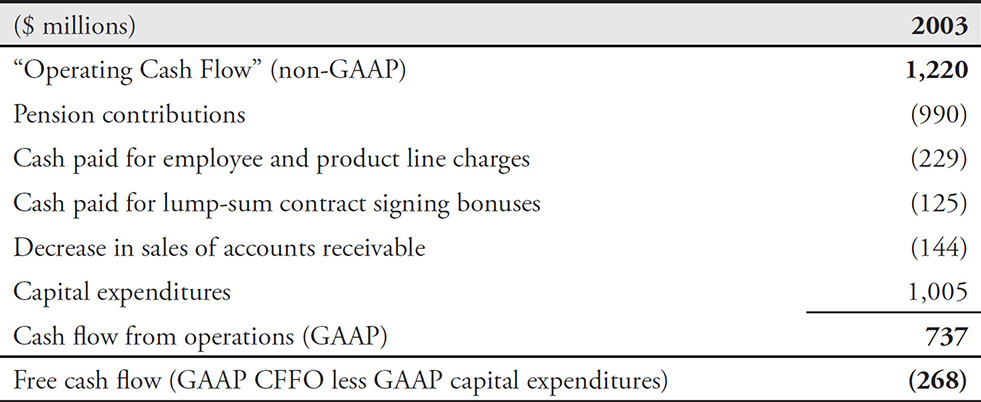
In 2003, Delphi was still up to the same tricks, but the company was now showing a reconciliation between its “Operating Cash Flow” and CFFO as reported on the Statement of Cash Flows. Delphi’s “Operating Cash Flow” was $1.2 billion in 2003, versus $737 million in CFFO and negative $268 million in free cash flow. As shown in Table 13-4, the primary differences included routine operating uses of cash flow, including pension plan contributions, payments to employees, and a decline in the sales of accounts receivable.
Any serious investor who looked at this presentation would be aghast at seeing such normal operating expenditures excluded from the calculation of “Operating Cash Flow.” The adage “Where there’s smoke, there’s fire” is very applicable when searching for shenanigans. Delphi’s ridiculous cash flow surrogate deception was the smoke. The fraudulent revenue and cash flow was the fire.
Table 13-4 Delphi’s GAAP Cash Flow Versus Pro Forma Cash Flow, 2003
Similarly, IBM showcased a free cash flow metric with an unusual and opportunistic definition. Free cash flow is a non-GAAP metric that is widely used and traditionally calculated as cash flow from operations minus capital expenditures. IBM adjusted this definition to also exclude changes in its financing receivables. This is problematic, since IBM’s financing receivables are really just long-term loans to its own customers, in other words, accounts receivable. From 2010 to 2013, higher levels of financing to customers created a large drag on CFFO; however, IBM’s tricky free cash flow metric made it seem as if these payments had been collected. In 2012 alone, the increase in financing receivables was nearly $3 billion, representing 16 percent of IBM’s self-defined free cash flow.
What to Do When Non-GAAP Metrics Become Pervasive in an Industry?
Sometimes certain industries use non-GAAP metrics as the standard way to value companies or to calculate an appropriate dividend distribution to investors. Energy companies, structured as master limited partnerships (MLPs), stand out in eschewing GAAP-based numbers for non-GAAP ones.
With historically low interest rates since the 2008 financial crisis, investors have searched far and wide for securities offering an annual yield higher than the miserly interest on bonds. Wall Street took notice and began singing the praises of the high yields and tax-advantaged status of MLPs.
Houston-based Linn Energy quickly became a darling MLP for its ability to consistently grow its dividend payments. In 2012 the company paid investors $680 million in dividends, an increase of 15 percent from 2011. While impressive, these figures seem strange alongside the company’s free cash flow, which fell by more than half a billion dollars to negative $694 million in 2012. How could the board have approved such a rich dividend payment when business required so much of Linn’s available cash? The company actually had to borrow money in order to fund these payments. The answer lies in the way that Linn (and many other MLPs) reported their cash flow. The company emphasized “distributable cash flow”—this is a metric that has no standardized definition, but for Linn Energy it was derived from adjusted EBITDA, and it only took into account a portion of the company’s capital expenditures. The methodology resulted in a much more favorable metric that was used to justify a higher dividend payment.
Table 13-5 shows Linn’s GAAP and non-GAAP earnings and cash flow metrics, and Table 13-6 shows how Linn calculated “distributable cash flow” and the many costs that are not included.
Table 13-5 Linn Energy GAAP-Based and Non-GAAP-Based Earnings and Cash Flow
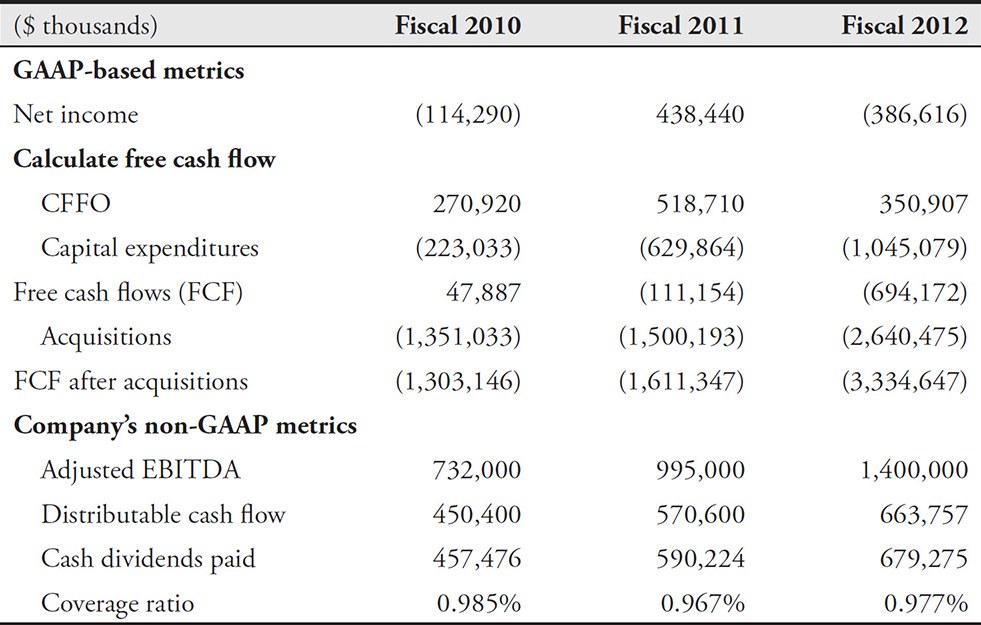
Table 13-6 Linn Energy Non-GAAP Metrics Used to Determine Dividend Payout
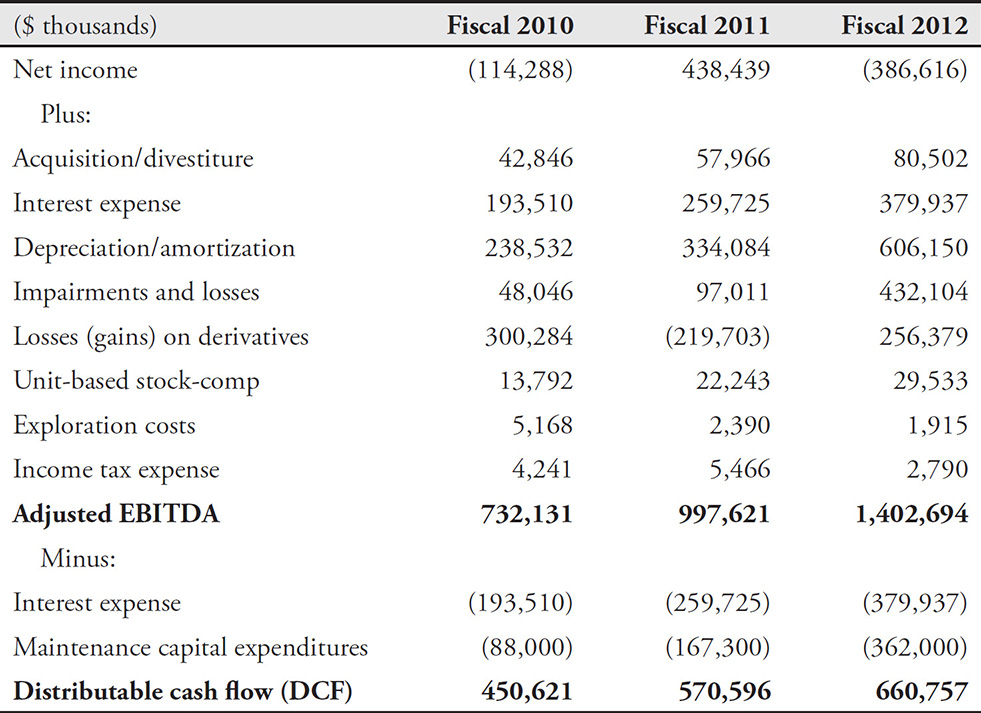
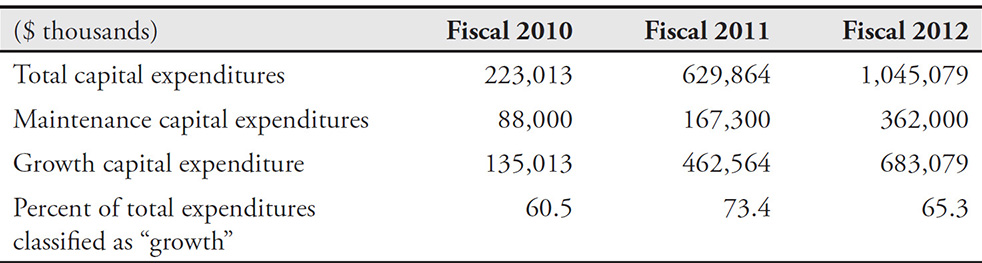
You’ll notice that Linn Energy deducted maintenance capital expenditures in arriving at distributable cash flow, while total capital expenditures on a GAAP basis were nearly double that amount. This follows an approach that some companies (and investors) take to consider capital expenditures in two distinct buckets: (1) maintenance—capital spent on existing facilities that do not increase capacity—and (2) growth—capital spent to expand the business at either existing facilities or new ones. Clearly, management has quite a bit of discretion in what it includes in each grouping. Table 13-7 shows how much Linn allocated to maintenance and growth. Naturally, the more Linn classifies as growth, the higher the DCF—as growth capital expenditures are excluded in the calculation.
Table 13-7 Linn Energy Allocation to Maintenance and Growth Capital Expenditures
The subsequent years proved to be quite challenging for Linn. First, the SEC raised questions about the company’s calculations of the distributable cash flow. By the following year, the energy market had collapsed, causing Linn’s business to fall on tough times. But following years of imprudently high dividends (paid largely with borrowing), Linn faced a severe cash crunch, leading to its 2016 bankruptcy filing. And with its $8.3 billion debt load, Linn earned the dubious distinction as the largest energy MLP bankruptcy.
Could investors have avoided suffering big losses from Linn’s demise? We think so. Paying out enormous dividends while generating negative free cash flows was simply not a sustainable strategy—and should have been a strong warning sign. The fact that most shareholders were paying attention to a non-GAAP surrogate for free cash flow that didn’t include many of the most significant costs of the business explained why the market had valued the company so richly, while more careful (and skeptical) investors would have stayed away.
Looking Ahead
In Chapter 14, we shift from key metrics that present an overly optimistic view of a company’s performance to those metrics that mislead investors about a potentially imminent deterioration in the Balance Sheet and the company’s economic health.