2. Why are house prices so high?
While it is easy to observe rising house prices, it is much more difficult to identify the drivers of these increases. The demand, supply and enabling elements are often unseen; other factors, like cultural pressures, can be difficult to pin down. It is helpful to examine each factor separately, as we do in this chapter, but it is also important to acknowledge that it is the relationship of these factors to one another that drives rising prices. There is a complex system at play in markets like Auckland and any account of rising house prices must be holistic and wide-ranging.
International factors, for example, are often overlooked. The Dallas Fed, a regional central bank in the US, tracks the house prices of twenty-three international markets.1 In twenty out of these twenty-three countries, house prices rose between 312002 and 2007 by an average of 10 per cent per year. Since then house-price gains have been modest (2 per cent a year) but we have seen a big change – marked by divergences – in how the real-estate markets in each of these countries have performed.
These international figures suggest there are, broadly speaking, four different groups of housing markets. The two main groups are those that had a boom and a bust (the US, Ireland and Spain, for example) and those whose boom has continued with only a mild dip during the recession following the GFC (others in this group, apart from New Zealand, include Australia, the UK, Canada, Belgium and Norway). There are also two smaller groups: one that is in persistent decline, so that house prices are falling relative to incomes (Japan and South Korea), and one whose house prices are moving in the opposite direction to most other countries, and so becoming more affordable (Switzerland, Germany and others).
The close correspondence of house prices across regional and national markets through the 2000s suggest there are some common global factors at play. However, the more recent divergences indicate that there are also local influences that matter a great deal. We must therefore look at this mix of both global and local factors to understand why house prices have risen and what steps we need to take to restore housing affordability.32

Figure 2.1 New Zealand housing costs relative to income, 1992–2014
Note: Figure 2.1 shows the different components of housing costs relative to income. For easy comparability each has been indexed to a value of 100 in 1995. This way we can see the cumulative increase in costs relative to incomes since 1995.
Source: Data from REINZ, MBIE, Statistics New Zealand and RBNZ.
As Figure 2.1 shows (and as we have seen already), house prices in New Zealand have risen sharply relative to incomes. But within this rise, not all the components that contribute to house prices have increased to the same extent. Rents, for example, have kept pace with incomes, suggesting there is no significant shortage of housing. Construction costs, meanwhile, have risen slightly relative to incomes, suggesting these costs have been a small contributor to housing unaffordability. But by far the biggest culprit behind higher house prices, as we shall explore, is the cost of land. This chapter examines each of these factors in turn to draw a comprehensive picture detailing the 33reasons houses in New Zealand have become so unaffordable.
Demand influences on house prices
The demand influences on house prices include demographics, investor demand, easy finance and a favourable tax environment.
Demographic demand refers to the way that the changing make-up of the population alters the need for housing. For instance, demand for housing can increase with population growth or because of changing family structures.
These kinds of changes, with the exception of migration, tend to be slow-moving. The number of households in New Zealand grew by just over one million between the 1961 and 2013 Censuses. The major cause of the increase was natural population growth (that is, births exceeding deaths), which contributed 61 per cent of those one million extra households. An additional 30 per cent of the increase was due to families becoming smaller, meaning a more dispersed population requiring more houses. The number of people per household has reduced over time, from around 4 people in 1961 to 2.7 people in 2013. The remaining 9 per cent of the demand came from net migration. The changes between census years are illustrated in Figure 2.2.34
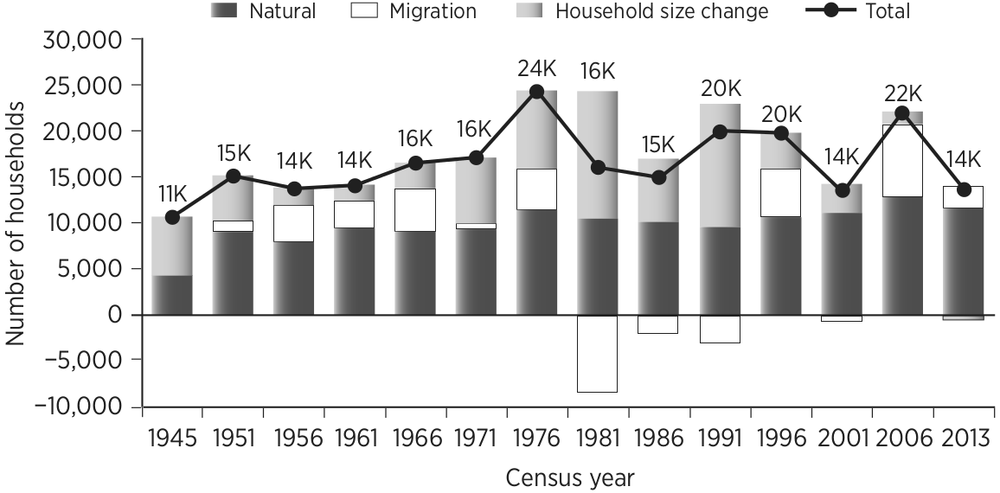
Figure 2.2 Sources of housing demand (changes in number of households per year between censuses)
Note: For example, in 1986 the number of households had grown by 15,000 per year since 1981. The stacked bars show the main components of that increase. Of the 15,000-household increase, around 10,000 came from natural population increase (births exceeding deaths). A further 7,000 came from reduction in household size. This was counterbalanced by a reduction in demand of around 2,000 houses due to net outward migration. The 2013 Census was unusual in that the increase overwhelmingly came from natural population growth.
Source: Data from Statistics New Zealand censuses and New Zealand Official Yearbook, and NZIER.
While changing household size and net migration are smaller drivers of demand growth, they are more variable than natural population increase. This means that they can add to or reduce demand in unexpected ways. Natural population growth, on the other hand, is relatively predictable, as birth and mortality rates tend to change only gradually.
Household size has shrunk over time as people have fewer children and live longer. (Living longer also means a higher likelihood of living alone.) The 35fertility rate has been falling over time, from 4.3 children per mother in 1961 (the year that recorded fertility rates peaked) to 1.9 children in 2014. The fertility rate matters because, traditionally, many of the country’s new households have been family units (as opposed to single people or childless couples).
Because family sizes have become smaller, increases in population need more houses. A 100,000 population increase in 1961 would have needed just 15,900 homes, while today it is 25,600 – a difference of 10,000 homes. Housing demand is also increased by more people living alone.
The assumptions that planners make about household size are critical, because small variations can make big differences to long-term needs. For example, the 2013 Auckland Plan assumed that the city would need 400,000 extra houses to cater for population growth of 1 million over the coming thirty years. This was based on a predicted scenario of high growth, which Auckland has generally followed, and made provision for 2.5 people per household.2 Yet the history of Auckland suggests a different calculation should have been made. Since 1981, the average household size in the city has consistently been just over three people. Auckland tends to have larger households because it is home to many young people, families and extended families. Basing calculations on this 36historical figure changes the picture considerably. The difference between assumed household sizes of 2.5 and 3 people, projected over thirty years, is 67,000 houses, or a town the size of Kawerau (which has an area of 22 square kilometres).3 The assumptions in the council’s planning may still prove to be correct, but what is clear is that the composition of demographic demand matters a great deal.
Part of the reason for shrinking household size is that our population is ageing. Living arrangements change throughout our life: from living with parents in childhood, to possibly finding a flat with several other people, to living with a partner, having a family, seeing children leave, moving into retirement, and perhaps even being widowed. As New Zealand’s population gets older, more of the new households created will be older couples or widows, meaning that one- or two-person households will become increasingly common.
An ageing population will therefore decrease average household size, and increase demand for housing. But there is a growing mismatch between the types of houses needed and what is available. Much of the current housing stock is in three-bedroom homes, and many of the new houses being built have four bedrooms or more. In the 2013 Census, around 70 per cent of new households had just one or two members, but just over 70 per cent 37of the new supply had four or more bedrooms. This is a serious mismatch.
There is also a mismatch between housing stock and the location of new housing demand. In future, people will not want houses in the places in which they are currently available. Many provinces in New Zealand have stagnating or shrinking populations. A handful – like Auckland, Hamilton, Tauranga, Selwyn and Queenstown – are growing fast, for reasons linked to economic growth, job opportunities and lifestyle choices. Thus, while there may be an excess of (affordable) housing stock in places like Kawerau, the demand for housing will not be there: it will be in places that offer access to work and other amenities.
Some of the strong growth in housing demand in places like Auckland is coming from changes in net migration – the difference in the numbers of people leaving and coming to live in New Zealand. At the national level, net migration can vary dramatically. For example, New Zealand’s population was reduced by 3,400 people in 2012 due to net migration, but a reversal in migration flows led to a net gain of 50,900 people in 2014. In that time, natural population growth changed very little. Given that between 2012 and 2014, the demand for housing rose from around 9,000 units to some 25,000–30,000 units, net migration must have increased housing demand significantly. There 38is, however, some uncertainty around how many houses are required for migrants, as the number depends on the migrants’ age, financial condition and cultural norms. In periods of migration-driven population growth, new households tend to be larger than the typical or average existing household size, suggesting migrants have larger than average families and therefore create less demand for housing than would otherwise be expected.
In addition, even when there are big swings in net migration, the demand for housing is not always the same. In the early 2000s there was a surge in net migration that soaked up vacant homes around Auckland, and demand was so high for rental properties that they were routinely auctioned to the highest bidder. The net migration then was principally due to an influx of families coming to live in New Zealand, mainly in Auckland.
The latest surge in net migration has been a little different. The biggest driver has been fewer New Zealanders leaving – and from all over the country, not just Auckland. In addition, increasing numbers of New Zealanders are returning home from Australia, fleeing an economy that is slowing and a political system that denies them access to welfare and other social safety nets. Returning New Zealanders are more likely to disperse through the regions than are other migrants, who tend to prefer 39Auckland because it has the best employment and income prospects, and is also New Zealand’s most multicultural city. In the recent influx of migrants, there have also been more people coming for work or study reasons (rather than migrating for residence).
Because of the changing factors affecting net migration, its impact on housing demand tends to be variable and is not always comparable over time. Moreover, net migration can often generate ‘boom-bust’ effects, creating big swings in housing demand. Because the supply of housing is slow to change, the swings in demand can also lead to big swings in house prices and rents – at least until supply catches up.
Overall, then, demographic demand is a major player in driving housing demand. If supply does not keep pace in the right places (since only a few locations enjoy strong population growth) and the right form (since an ageing population will not live in four- and five-bedroom houses), prices will rise unacceptably in some places to reflect shortages, while falling in others to reflect excess.
From our analysis of demographic demand, we discern two issues that deserve policy attention. The first is the issue of population migration. This is, for many, a taboo subject, even though migration has been at the core of New Zealand’s history. New Zealand has no clearly articulated population 40strategy: we do not know how big a population we want, or why and how to manage migration in order to attain it. As a result, immigration is the topic of much discussion, often conducted without a guiding principle stipulating what we are trying to achieve with it. We urgently need a policy discussion around creating a population strategy that sets out how many people we, as a democracy, want living in New Zealand and how immigration aids or abets that target.
The second main issue is that housing supply is slow to respond to rapid changes in population (which are usually driven by migration cycles). The policy response to this must be to examine what could be done to speed up housing supply, spanning issues around land supply, infrastructure, infilling, building, consenting and inspecting.
Investor demand
Investor demand is another big driver of house prices. We know that more people are renting, which implies that there are more houses owned by investors. In addition, data from CoreLogic, a leading property information provider, shows that in 2015 41 per cent of house purchases were from investors in Auckland (up from 32 per cent in 2005, when the data begin). Just 25 per cent were from households moving, and 20 per cent were first home buyers. Unaccounted cash purchasers, 41a category that is likely to encompass cashed up foreign buyers, made up less than 10 per cent of house sales.4
There are a number of reasons why New Zealanders invest so heavily in housing. The first is that it has been a spectacular investment in the past. As a total, housing assets increased in value by $240 billion in the decade to 2014.5 In comparison, the value of farms and businesses rose by $135 billion and financial investments by $139 billion in the same period. (These increases reflect the accumulation of savings, which leads to new investments, as well as increases in the value of existing capital.) As a result, half of all household assets are in houses, with the remainder split between financial savings (deposits, managed funds, listed equities, and so on) and investments in businesses and farms (whether directly or through unlisted share holdings).
The second reason for the heavy investment in housing is cultural. New Zealand has a deep and embedded belief that housing is a good investment. Home ownership is also a safety net in retirement. A retiree could essentially run down a house – that is, borrow against its value – if faced with financial difficulty, but they would not be able to do that if they rented.
New Zealand’s cultural norms are so strong that many investors do not give much thought to 42their investment property purchases. Many are accidental landlords – their main purpose is to profit from accumulated savings and capital gains. In a recent survey of landlords, 40 per cent did not know if their tenants wanted or needed different features.6 Many investors, from our experience, do not even do the sums on whether the cash-flows from their rental property will stack up over time – or result in losses. Rather, their expectation is that house prices, having always risen, will continue to do so forever.
And indeed, when we look at history, New Zealand house prices have consistently increased over time and in excess of general prices. Real (that is, inflation-adjusted) house-price increases are around 2 per cent a year if we take a very long view, or around 4 per cent if we look at more recent history.7 With inflation averaging 2 per cent a year, history suggests house prices should rise by 4–6 per cent a year in future. (Although New Zealand house prices, as we will see in Chapter 3, have declined more often in the past than people might think.)
The problem for investors is that they appear to be betting on securing ever-higher capital gains. We calculate that given current rents and costs, investors are probably anticipating capital gains of 8 per cent or more per year forever in places like Auckland.8 Such expectations are extreme, compared to what history suggests is possible. But 43if they are realised, one corollary is that few people in future will be able to buy a house. Currently, a young couple in Auckland needs to spend nearly half their income on mortgage payments to buy a modest home.9 If household incomes continue to rise at their historical rate of 3.5 per cent per year and house prices rise at the 8 per cent a year that investors expect, mortgage payments will be a staggering 80 per cent of a young couple’s income by 2020 – and more than their annual income by 2031. Young people who did buy homes would be ‘mortgage slaves’ for most of their lives, spending far more of their income on debt repayment than previous generations. Having thus excluded first home buyers, the housing market would be left to those who are already property owners, swapping assets with each other at higher and higher prices.
At present, investors – and indeed first-home buyers – are able to pay higher prices on relatively slim incomes, because of loosening financial settings and falling interest rates. In the 1990s, banks required a minimum 20 per cent deposit. But now smaller deposits, or even none at all, are possible (albeit with higher interest rates and insurance costs). Banks would once have balked at mortgage payments exceeding a third of household income, but now they are happy for mortgages to take a much larger share. Mortgage rates have also trended lower over time. For example, mortgage 44rates averaged 6 per cent in the five years to 2014, but had averaged closer to 8 per cent in the previous twenty years. Once we account for lower inflation over time, we see that mortgage rates were very low until the early 1980s, then rather high, before easing in the 2000s. This is illustrated in Figure 2.3.

Figure 2.3 The evolution of floating mortgage interest rates in New Zealand over time, 1964–2015 (%, per year)
Note: There are two series: the first is the observed interest rate, and the second is the rate that would have been observed if the inflation environment had been stable, as it has been in New Zealand since the mid-1990s. During very high inflation periods through the 1970s and 1980s, floating mortgage rates were well in excess of 10 per cent per year. But because inflation was high and expected to remain high, and workers were expected to be compensated through higher future wages, a comparison with current interest rates (when inflation is generally contained close to 2 per cent) is comparing apples with truffles.
Source: Data from RBNZ and Statistics New Zealand.
The combination of loosening financial standards and falling interest rates has meant 45that every dollar of income can borrow more. For a $100,000 gross annual income, an individual’s house purchasing capacity has increased from around $470,000 two decades ago to somewhere between $600,000 and $690,000 today.
So purchasing capacity has increased by some 30–50 per cent because of changes in lending standards and interest rates. But this in turn reflects shifts in wider economic and financial policy.
The rules and regulations around bank lending standards are largely set internationally by the Basel Committee for Banking Supervision, under the auspices of the Bank for International Settlement, which is essentially the global central bank for national central banks. Basel’s initial set of rules, adopted in 1988 and known as Basel I, allowed banks to treat mortgages differently to other lending. (Additional rules and regulations followed in Basel II and Basel III.10) Mortgages were deemed to be half as risky as corporate loans, a clear signal to lend more in that area.
As a result, an increasing share of bank lending now goes to mortgages, both in New Zealand and internationally. In New Zealand the mortgage share of bank lending rose from under 10 per cent in the 1970s to 25 per cent in the mid-1990s, and over 50 per cent in 2015, as shown in Figure 2.4. Banks are still to some extent playing their textbook role, that of matching private savings to entrepreneurs and 46businesses needing capital in order to grow fast. But increasingly they are also lending on houses, rather than growing businesses that create jobs and higher incomes.

Figure 2.4 Percentage share of total bank lending for housing
Note: There is no reliable data for the period 1986–90.
Source: Data from Statistics New Zealand, New Zealand Official Yearbook, and RBNZ.
Another benefit that drives demand for housing investment is its tax treatment. In tax terms, the greatest advantage for house owners is that they can offset tax losses on investment properties against other income, reducing the amount of income that has to be declared to the Inland Revenue Department (IRD) and thus the amount of tax they pay. In addition, most property transactions do not attract a tax on the capital gains they create for their owners. New policies will tighten these rules from October 2015, but only for investment properties 47turned over within two years.11 A third, less well-understood advantage is that owner-occupiers get a benefit from home ownership equivalent to the amount of rent they would be paying if they rented their property – but they do not have to pay tax on that ‘income’. (Taxing that imputed income is rare internationally, however, so New Zealand housing owners are not alone in enjoying that advantage.)
Taking these three advantages in turn, the first of them, the tax offset against other income, is especially important for rental property owners. Many rental properties, particularly in the very expensive Auckland market, do not return sufficient rental income to pay for the usual outgoings – rates, insurance, maintenance, mortgage interest payments, and so on. But these losses can, as stated above, be counted alongside other personal income, which partly compensates for the top-up payments an investor has to make to operate the property.12 This reduces the financial impact on the house owner while they wait for the real returns to come from house-price (or more accurately land-price) increases. This advantage is available only to non-commercial investors: if a rental property were owned by a company, the offsetting against personal income would not be possible.
When it comes to capital gains, house owners benefit enormously, because increases in house and land prices are not explicitly taxed. The tax 48regulation in this area is vague. If a property is purchased with the intention of selling it at a profit, then the profit is taxable. But there is no requirement to register intent at the time of the purchase; it is only assessed at the time of sale and there are no set rules for assessing intent. In reality, the IRD collects very little revenue from this source. (In contrast, those with businesses based around trading properties are subject to taxes like any other business.)
Third, there is the absence of a tax on imputed rentals. As detailed above, this would be a tax on the money an owner-occupier would pay if they were renting.13 To understand how this would work, try the following thought experiment. Suppose two owner-occupiers with identical homes move into the other’s house, while retaining ownership of their own property. They pay each other rent. In this scenario, the rent received by each landlord would of course be taxable, and the IRD would collect the appropriate amount of tax. But in real life, the owner-occupiers do not pay this tax. Currently, the total contribution made by rents to the economy is around $8.5 billion a year, but the ‘imputed rent’ on owner-occupied houses would be at least $26 billion (because owner-occupied houses tend to be larger and better quality, and therefore likely to earn more rent than the existing rental stock). It is difficult to quantify the financial impact that 49taxing these imputed rents would have. If nothing else changed, doing so would probably increase the tax take by around $6 billion. But behaviour would change, and if mortgage payments could be offset against the imputed rent, home owners would hold on to more debt to reduce their tax bill (having a larger mortgage, and therefore larger interest payments, would reduce their reported income). Nonetheless, a sharp reduction in the favourable tax treatment of owner-occupied housing would result in a significant increase in the tax take.
In short, while tax settings may appear mundane, they are in fact a strong incentive at the margin to invest in rental properties.
Foreign purchases
The final element of investor demand comes from foreign purchases. New Zealand has no readily available and reliable data on these purchases. This is because there are no explicit restrictions on foreign investment in New Zealand, with the exception of the Overseas Investment Office’s involvement in assessing ‘large’ investments and investments in ‘sensitive’ assets (such as airports).
Foreign investment can lift house prices, and in places such as London, Vancouver, New York, Sydney and Singapore it has been a source of considerable angst.14 The fear is that money coming 50in from outside the country is used to purchase houses and leave them empty. Foreign investors are using these properties as a store of wealth, a safe investment away from places where there are greater uncertainties, such as Russia, China or parts of the Middle East. Sometimes there are accusations that the funds pouring in are ill-gotten gains or even derived from money laundering. In places such as London there are high-end streets that are empty much of the time and have a notable absence of lit windows at night. In most of these markets, foreign buyers tend to account for a small share of houses sold, but they add to the pressures in the housing market by leaving some homes empty.
There is little evidence, however, of this happening on a large scale in New Zealand. Foreign purchases are difficult to quantify, but using partial data from CoreLogic we estimate that they comprised at most 9 per cent of all Auckland houses sold in 2015.15 When we look at cash buyers who are new to the market, they are a very small number of buyers. The data simply do not support the anecdotal observations around foreign buyers. We have also not seen a big increase in the stock of vacant homes in the official census data from Statistics New Zealand.
But the fears around foreign buyers are persistent – and they grow uglier in the absence of facts. There 51is simply no reliable data source to understand who is actually buying houses, whether they are New Zealand-based, or if the money is ‘dirty’. Yet this lack of data – and, simultaneously, the questions about people’s intent when purchasing properties – could be resolved by additional requirements enforced at the time of house purchase. Our ideas around this are outlined in Chapter 4. The need for better data on this topic has recently been echoed by the Reserve Bank of New Zealand.16 New requirements to disclose tax residency status and a local bank account will go some way in shedding light on the scale and nature of foreign buying in the New Zealand property market.17
Supply, location and building influences
As we have already seen, when it comes to supply costs, it is the price of land that is the critical issue. The cost of construction also plays a part, but only a small one.
Over time, house prices can fluctuate considerably but, in the normal scheme of things, only in a transitory way. Prices will rise to signal the market to make more houses and then fall back when supply matches demand. But house prices can rise continuously, relative to incomes and rents, if there are physical or regulatory constraints that stop supply. And the most important supply is that of land – land that is ready to build on, with 52good access to places of work, transport and other infrastructure.
The price of land has increased significantly in excess of incomes. Since 1995, land costs have risen 73 per cent faster than incomes, while the construction cost of a 135 square metre home has risen by just 13 per cent in excess of income. Typically land in areas where there are good work and income opportunities will cost more, because the land is worth more to the person living there. But the main driver of land-price increases tends to be scarcity.
By definition, it is impossible to ‘make’ more land (except perhaps through reclamation), so we must use what land we have as effectively as possible. This matters especially in Auckland, where land is even more restricted than in other places because the city is squeezed between two harbours. But if anything we are ‘making’ less land, by increasing regulatory and other barriers to using the land that does exist. This is the problem – not that land is in limited supply, but that we use hardly any of the land that is already there. Even if every household in New Zealand had a quarter-acre section, we could all fit into the Kaikoura District area (2,050 square kilometres).18 The scarcity of land is entirely artificial and of our own making, because we restrict land use so heavily.
There are, of course, good reasons for planning 53rules and other restrictions on land supply and building proposals. Some of the rules are designed to protect the environment, or minimise actions by one property owner that could negatively affect others; other rules make provision for parks and other public amenities that would not be built if urban planning were left to individuals transacting in the market.
The rules also aim to mitigate the effects of density. The Dickensian industrial centres of northern Britain and the London of Sherlock Holmes were crowded, filthy, polluted, crime-ridden, and prone to infectious disease epidemics. The term ‘the Big Smoke’, now an unremarkable cliché, was originally used to describe the intense pollution of Victorian London.19 Planning rules have therefore understandably aimed to limit what might be regarded as over-dense housing.
But new rules have accumulated over time, expanding the regulatory system’s reach and scope. They have widened to take account of things like green belts, urban limits, height restrictions, building designs, maximum densities, minimum parking requirements, historic buildings and character preservation. Rules and principles originally designed to make cities better places by stopping bad things from happening have now become the shackles that are preventing cities from reaching their potential. This is true both in the 54city centre, for those wanting to live up close to the bright lights, and further out, for those living in suburban housing because they want space and distance from the city.
Building regulations have become so detailed that they address issues such as minimum ceiling heights and mandatory balconies. Some of these regulations may be necessary to maintain a minimum quality of housing, but developers interviewed in a recent study argue that the costs they add are substantial.20 Eric Crampton, the policy director of the New Zealand Initiative think-tank, summarises the developers’ views thus:
[M]andatory ceiling heights add about $20,000 per apartment. Mandatory balcony areas tack on another $40,000 to $70,000. At the same time as [the Auckland] Council has made it hard to expand on the Auckland’s fringes, they’ve also banned building tall buildings: building height limits add $18,000 to $32,000 per apartment.21
The point here is not to offer judgement on whether these costs are accurate or justifiable, but to underline the fact that regulatory requirements add costs to building.
Auckland offers obvious illustrations of how regulations have increased over time. In Ponsonby, a sought-after neighbourhood, the houses are placed close together and few have off-street 55parking. In May 2015, the cheapest asking price on a real-estate listing site for a three-bedroom house in Ponsonby was $1.2 million; the suburb is clearly desirable. But it would be impossible to build such homes today. Numerous rules, including those on density, minimum distance from neighbours, parking requirements and heritage restrictions, would prevent such neighbourhoods from developing now.
These regulatory structures are fairly uniform throughout New Zealand, although their local applications can vary greatly. ‘Volcanic viewshafts’ (protecting views of Auckland’s iconic volcanic cones), heritage protection, minimum lot size and height restrictions are just a few examples of policies that exhibit local differences. Historically, regulators that constrain growth have not been much of a problem, because there has been little population growth to test them. But in strongly or suddenly growing markets, restrictions on land use constrict the supply of new homes. This pushes up house prices until the market reaches a new equilibrium – but one that prices many people out.
The most acute pressures are felt in our two largest cities, Auckland and Wellington. It is often argued that, right across the world, large, dense and geographically constrained locations will find it harder to grow than other places. Successful cities tend to be more expensive, because so much more 56economic activity is possible in a small space.22 High-value jobs concentrate in a small area. In short, in urban centres like Auckland, the land is valuable because its economic potential is so large – and so it is inevitable that Auckland house prices will be high.
But there are also reasons to question this line of argument. For example, when we compare Auckland to Sydney, Auckland prices appear well out of step. Auckland has a population of just 1.5 million, smaller than Sydney’s in the 1950s, yet house prices in the two cities are similar. As of early 2015, the median house price in Sydney is A$750,000 and the median house price in Auckland NZ$720,000.23 (We use the median price here rather than the average price, which is $810,000 for Auckland, to ensure we are comparing like with like.) This similarity is despite the fact that we would expect house prices to be lower in New Zealand than in a major Australian city. Compared with Sydney, Auckland has 30 per cent lower incomes, 27 per cent lower population density and a 66 per cent smaller population – yet only 10 per cent lower house prices.
Two factors play particularly important roles in creating Auckland’s high house prices: the city’s geography, and the rules that aim to restrict its density. Auckland’s location on an isthmus, between two bays, creates natural bottlenecks in 57moving goods and people, and limits usable land close to the city centre or other centres of work. This constrained geography reduces the city’s potential population by around 900,000 people relative to a less geographically constrained city like Brisbane.24
These geographical barriers could be overcome through better land use and planning regulation, infrastructure provision (transport, water, sewerage, power, and so on) and the proper funding of that infrastructure. (Builders and developers could also play a part, by maintaining the capacity and capability to supply housing when demand surges.) If we relaxed some of our planning and building rules, without losing the important parts of them that reduce the costs of density, we would need less land to house our population. Close to the city, density is destiny. We see this in cities that are unconstrained by such policies, like Houston, Texas. There, the height of buildings tends to reduce the further one gets from the city, but only gradually. In Auckland, however, buildings are tall in the centre of the city, but fall dramatically in height outside the CBD, so that inner-city Ponsonby consists almost entirely of one- or two-storey suburban homes. This sharp boundary reflects the regulatory constraints that are clearly leading to less housing being supplied than would otherwise be possible. (Auckland is not 58alone in this, however: London is a similarly low-rise city, compared with other large metropolises like New York, Shanghai or Hong Kong. Differences in density are driven by geography, public transport and other infrastructure, and traditions of urban culture and development.25)
In short, the rules that were designed to reduce the costs of density have now gone so far that they are reducing the capacity of cities to grow effectively. Auckland has ambitions to be a global city, but limits on increases in density and slow land supply in areas where people want to live could thwart those ambitions. A high cost of living, mainly due to housing, and the cost of congestion – that is, time lost sitting in traffic – can be deterrents to businesses and residents alike. We already see some Aucklanders voting with their feet. They are increasingly likely to move to neighbouring areas such as Waikato and the Bay of Plenty, or overseas – both for work and to raise families.
Who is to blame? Pointing the finger at regulators, councils or planners is easy. But doing so is also unfair. Auckland Council tried to make progress on this issue by suggesting fewer planning restrictions in its 2013 Draft Unitary Plan. In particular, it wanted to make it easier to build taller buildings in selected suburban centres. But the plan was severely pared back during the community consultation phase. The community, or 59at least its most engaged parts, did not want those changes. Indeed, the revised Unitary Plan has more restrictions on building than currently exist. In the end, current vested interests have clearly taken a ‘not in my backyard’ (‘Nimby’) approach in their voting.
The costs from regulation are high, and they are man-made. Those who benefit are, from our experience, often those who have already benefited. They are typically rich and influential and will do what is needed to protect their interest. This political economy of housing has to be confronted.
Infrastructure
The costs of living in urban centres can be compounded by transport. One benefit of city living is supposed to be the ability to get to work and play easily and quickly. This ease can be mimicked through better transport – whether this be by car, bike, bus or train – to allow those who live in the suburbs a relatively painless journey into the centre. But transport, its funding and its related policies are not always joined up, especially in New Zealand. For example, Auckland’s Northern Express bus route, which connects the North Shore to the CBD, is highly successful. Its patronage has exceeded growth expectations, rising by 17 per cent in the year to March 2015 – well in excess of forecasts.26 But the stations serving it don’t have 60enough car parks for those wishing to park and ride. The council’s target of increasing public transport use is being jeopardised by its unwillingness to build enough facilities.
Conversely, transport plans often prioritise the need to build more roads. For example, much of the land transport funding growth planned for 2015–25 is geared to roads ($55–$113 million growth per year), while more modest sums are allocated to public transport, cycling and walking ($10–$17 million growth per year).27 Yet the evidence is clear: the more roads you build, the more people will drive, and the more the roads will fill up again.28 A portfolio of transport options, spread over road, rail, buses, cycling and walking, is necessary to ensure that no one part of the system is overloaded. In addition, dense housing should be built around transport nodes – bus and train stops, major intersections for arterial routes, and so on – so that people can easily access transport to any part of the city.
But quite apart from the planning issues this raises, the funding for infrastructure is not always straightforward. Large and long-term investments need to be matched up with long-term funding. Often, transport assets are built and maintained by different authorities and there is not always harmonious coordination between them. Highways and bridges tend to be the responsibility 61of central government, while local roads and water infrastructure (drinking water, sewerage and storm water) are the domain of local government – and there are often fights about who should pay for what.
Partly for this reason, major local projects often do not have sufficient resources behind them. Auckland’s Central Rail Loop, a project that will remove a terminus on one part of the rail line that forces trains to waste large amounts of time backtracking, has been held up because local authorities do not want to or cannot pay for the whole project and central government does not want to prioritise it.
In part, this problem stems from a failure to think long term. Local authorities use little targeted debt – something that could help transfer the cost of current investment to future generations who will also benefit from the asset. Instead, much of their funding is short term and prone to political management. This is a shame, because local authorities do prepare long-term plans for the decade ahead. In successive plans, New Zealand’s local authorities have identified the investments that are needed and what kind of funding increases are needed to fund them. But a plan is one thing – political reality is another. And the political reality is that borrowing is often unpopular. Few councils follow through with rates increases to match their 62plans and consequently they simply do not have the money to invest in infrastructure for future generations. Actual investment in infrastructure tends to persistently undershoot forecasts by local authorities.29 Politics trumps economics – and it is the politics of dealing with the realities of today, to the cost of those losing out, the future generations.
The building industry
Some of the problems around constrained housing supply are to do with the nature of the building industry itself. One of the reasons that the development of new houses is relatively slow to respond to demand and price signals – some estimates suggest it can take seven years for enough homes to be built after a surge in demand – is that some developers hold on to land, hoping to maximise their returns from rising land prices. In some countries there are taxes on bare land that is zoned for other use, to incentivise the landowner to do something with it – but New Zealand has no such taxes.
The building industry also faces the problem that finance is not always easy to secure for risky ventures like property developments, as banks would rather lend to property buyers than property developers. For instance, banks lent an additional $51 billion towards mortgages in the seven years to 2014 and just $8 billion extra to property and 63business services. Despite this discrepancy, the industry has not always been short of capital. Until the mid-2000s, New Zealand had a fairly large non-bank financial sector, comprised of finance companies. At the peak of the housing cycle in 2007, finance companies had lent over $5 billion for property development. Often this lending was at the riskiest end of the spectrum, the upfront financing that was unsecured in the case of loss. Banks lent on top of this financing, but their lending was more secure and had greater likelihood of repayment.
However, the recession took a heavy toll on property developers, many of whom were badly burnt in the bust. Finance companies were weakened, having already been damaged by the failure of several of their number due to mismanagement and, in some cases, fraud.30 Today finance companies lend around $3 billion to property development, $2 billion down from lending levels peak. Much less development is possible as a result. Other investors are becoming interested, but the money is not yet flowing easily. This is holding up the pace of new developments, particularly the larger, more risky projects.
A further problem is that builders are generally small-scale in New Zealand, and tend not to have the capacity to increase production quickly. New Zealand is a small country and, in economic terms, is effectively a collection of even smaller regional 64markets. As a result, there are a lot of small firms.31 This ‘cottage industry’ make-up means that most firms are set up to build only a few homes a year. There are only five home-builders in New Zealand with more than 100 staff, and two-thirds of all house building is done by micro-firms (those that have fewer than five employees or are sole traders).32 When demand increases rapidly they simply do not have the resources – labour, finances or management know-how – to meet that demand. As a result, construction costs typically spike during booms, and supply takes a long time to catch up with changes in demand.
Beware simple explanations
There are no neat and tidy reasons why house prices, and particularly land prices, have risen so much relative to incomes. Nor is there one reason for rising prices, as is so often claimed. Often we hear if we just cracked down on foreign buyers, or if we just reduced immigration, or if we just fixed bad council planning rules, Auckland houses would become more affordable. Instead the reality, as this chapter has shown, is that there are many drivers behind house-price changes. So a broad view of the housing market is always critical.
On the demand side, as we have seen, the bulk of the demand comes from natural population growth, reductions in family size, and the actions 65of investors, which are driven by culture and favourable tax and finance settings. The volatility in demand comes from net migration cycles, which can create massive swings in population growth and thus housing demand.
On the supply side, land supply is restricted through land use and related policies, including transport, underground infrastructure, funding allocation, and so on. Financing for developers can be difficult to get, and the construction sector is small and slow to respond to sudden changes in demand. Those wishing to increase the pace of house building must acknowledge the wide range of factors driving up house prices in New Zealand.