BASICS
BASICS
GLOSSARY
algorithm Set of instructions or calculations designed for a computer to follow. Writing algorithms is called ‘coding’ or ‘computer programming’. The result of an algorithm could be anything from the sum of two numbers to the movement of a self-driving car.
automation Repetitive tasks or calculations carried out faster and more efficiently by computers than by humans.
Bayesian analysis Statistical method for estimating probabilities based on observed data and prior knowledge, making it possible to answer questions such as ‘What is the probability that a person will develop lung cancer if they are a smoker?’
binary Representation of information as a string of 1s and 0s – an easy format for computers to understand, and so is fundamental to modern computing.
bivariate analysis Restricted to one output or dependent variable.
causal inference Determining whether a change in one variable directly causes a change in another variable. For example, if increased coffee consumption was found to directly cause an improvement in exam scores, the two variables would have a causal relationship.
cluster A group of computers working in parallel to perform a task. It is often more efficient for complex computation tasks to be performed on a cluster rather than a single computer.
core (computer/machine) Central processing unit (CPU) of a computer, where instructions and calculations are executed; communicates with other parts of a computer. Many modern computers use multi-core processors, where a single chip contains multiple CPUs for improved performance.
data set A set of information stored in a structured and standardized format; might contain numbers, text, images or videos.
Enigma code Method of scrambling or encrypting messages employed by the German armed forces during the Second World War which was cracked by Alan Turing and his colleagues at Bletchley Park.
epidemiology The study of the incidence of health conditions and diseases, which populations are most vulnerable and how the associated risks can be managed.
interpretability Extent to which a human can understand and explain the predictions or decisions made by a mathematical model.
model/modelling Real world processes or problems in mathematical terms; can be simple or very complex, and are often used to make predictions or forecasts.
multivariate analysis Measures the effect of one or more inputs, or independent variables, on more than one output, or dependent variable. For example, a study that models the effect of coffee consumption on heart rate and blood pressure would be a multivariate analysis.
normal (Gaussian) distribution Bell-shaped curve describing the spread or distribution of data across different values. Data sets that are often normally distributed include exam scores, the heights of humans and blood pressure measurements. Normal distribution shows the probability of a random variable taking different values. Many statistical analyses assume the data is normally distributed.
statistical association The strength of relationship between two variables or measurements, e.g. there is an association between human age and height. One commonly used measure of association is Pearson’s correlation coefficient.
terabyte A measure of a computer or hard drive’s storage capacity, abbreviated to TB. One TB is equal to one trillion bytes.
DATA COLLECTION
the 30-second data
Data science was born as a subject when modern computing advances allowed us to suddenly capture information in huge amounts. Previously, collecting and analysing data was limited to what could done by hand. Modern advances now mean that information is collected in every part of our lives, from buying groceries to smart watches that track every movement. The vast amount now collected is set to revolutionize every aspect of our lives, and massive companies have emerged that collect data in almost unimaginable quantities. Facebook and Google, to name just a couple, collect so much information about each of us that they could probably work out things about us that even closest friends and family don’t know. Every time we click on a link on Google or like a post on Facebook, this data is collected and these companies gain extra knowledge about us. Combining this knowledge with what they know about other people with similar profiles to ourselves means that these companies can target us with advertising and predict things about us that we would never think possible, such as our political allegiances.
3-SECOND SAMPLE
Since the invention of modern computing, ‘big data’ has become a new currency, helping companies grow from conception to corporate giants within a decade.
3-MINUTE ANALYSIS
The amount of data that we now collect is so massive that the data itself has its own term – big data. The big data collected in the modern era is so huge that companies and researchers are in a constant race to keep up with the ever-increasing requirements of data storage, analysis and privacy. Facebook supposedly collects 500+ terabytes of data every day – it would take over 15,000 MacBook Pros per day to store it all.
RELATED TOPICS
See also
3-SECOND BIOGRAPHIES
GOTTFRIED LEIBNIZ
1646–1716
Helped develop the binary number system, the foundation of modern computing.
MARK ZUCKERBERG
1984–
Co-founded Facebook with his college room-mates in 2004, and is now CEO and chairman.
30-SECOND TEXT
Vinny Davies
Personal data has become the sought-after commodity of the technical age.

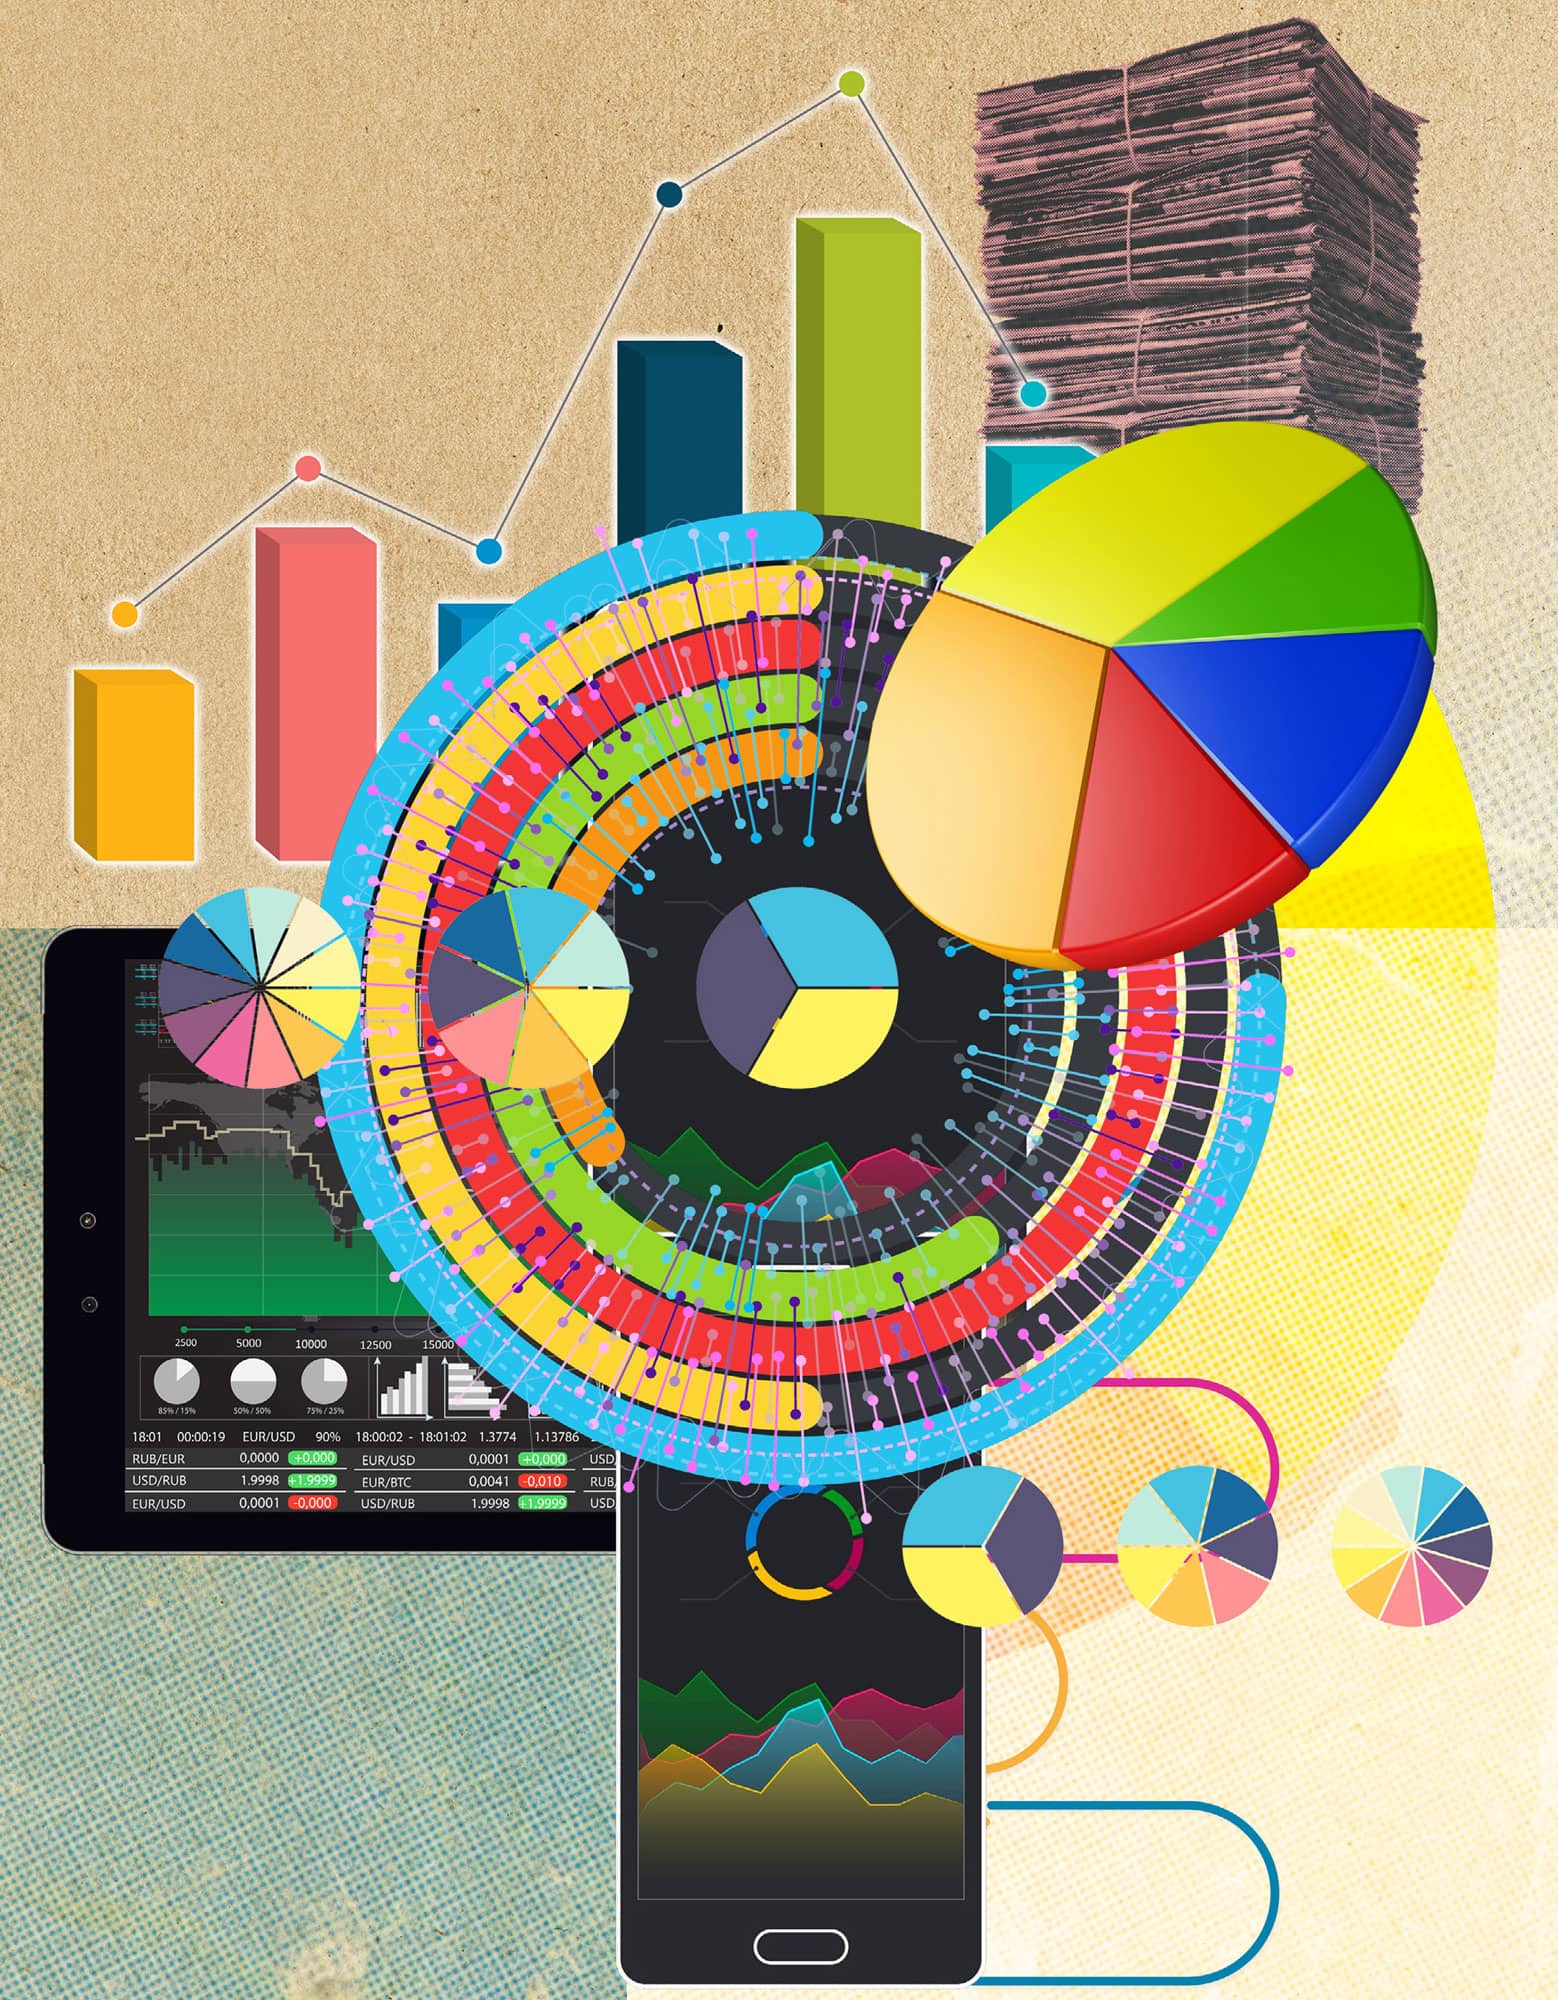
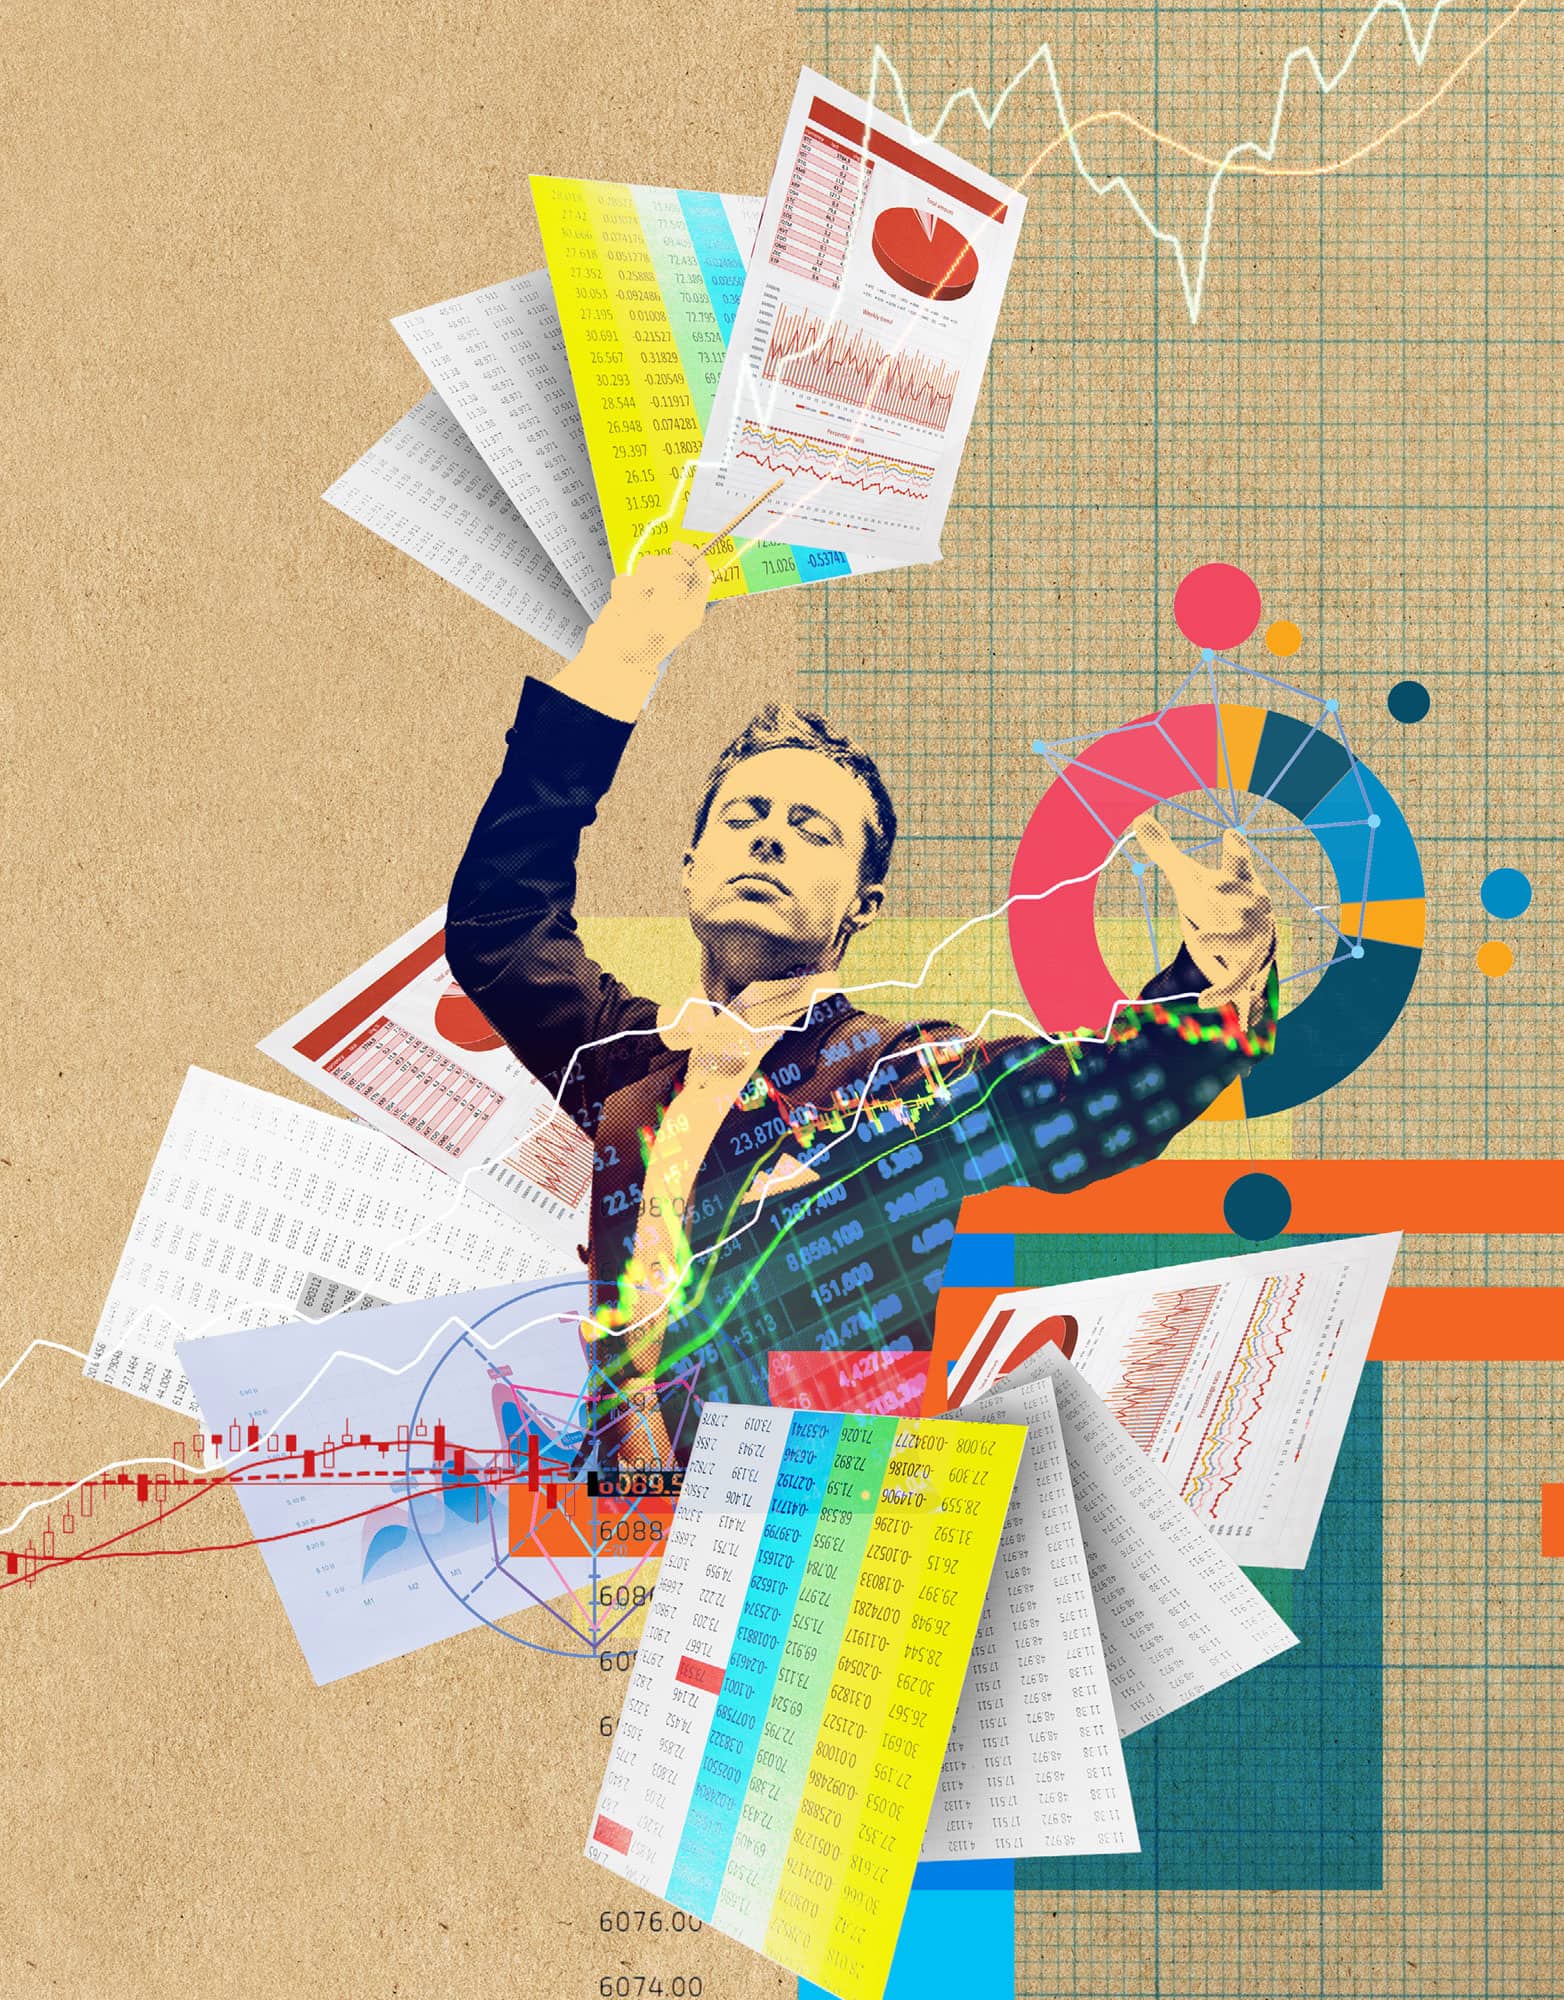
HOW WE VISUALIZE DATA
the 30-second data
Where does the quote ‘ninety per cent of politicians lie’ come from, and more importantly, is it true? In everyday life, summaries of data can be seen in many forms, from pie charts telling us the nation’s favourite chocolate bar, to news articles telling us the chance of getting cancer in our lifetime. All these summaries come from, or are based on, information that has been collected, but so often summaries seem to contradict each other. Why is this the case? Well, data isn’t usually simple and nor is summarizing it; I may summarize it one way, you another. But who is right? Therein lies the problem: it is possible to be manipulated by the data summaries we are shown. Even summaries that are true may not provide information that is a fair and accurate representation of the data which that summary represents. For instance, did you know that teenage pregnancies dramatically reduce when girls reach 20 years of age? Technically true, but realistically not a useful summary. The next time you see a summary, think about how it could have been manipulated, and then consider the results of the summary accordingly.
3-SECOND SAMPLE
Data is everywhere in everyday life, but most of us don’t work in data science; so how is that data seen and what beliefs are formed from it?
3-MINUTE ANALYSIS
Physically visualizing the massive amounts of complex data collected is a challenge in itself. Most modern data sets are almost impossible to visualize in any sensible way and therefore any visual summaries are usually a very simplified interpretation of the data. This also means that visual summaries can easily be misrepresented, and what is seen isn’t always as straightforward as it seems.
RELATED TOPICS
See also
3-SECOND BIOGRAPHIES
BENJAMIN DISRAELI
1804–81
Former British Prime Minister to whom the quote ‘there are three types of lies: lies, damned lies and statistics’ is often attributed.
STEPHAN SHAKESPEARE
1957–
Co-founder and CEO of opinion polls company YouGov, which collects and summarizes data related to world politics.
30-SECOND TEXT
Vinny Davies
In the realm of data science, seeing is not necessarily believing – it’s always wise to look beyond the summary presented.
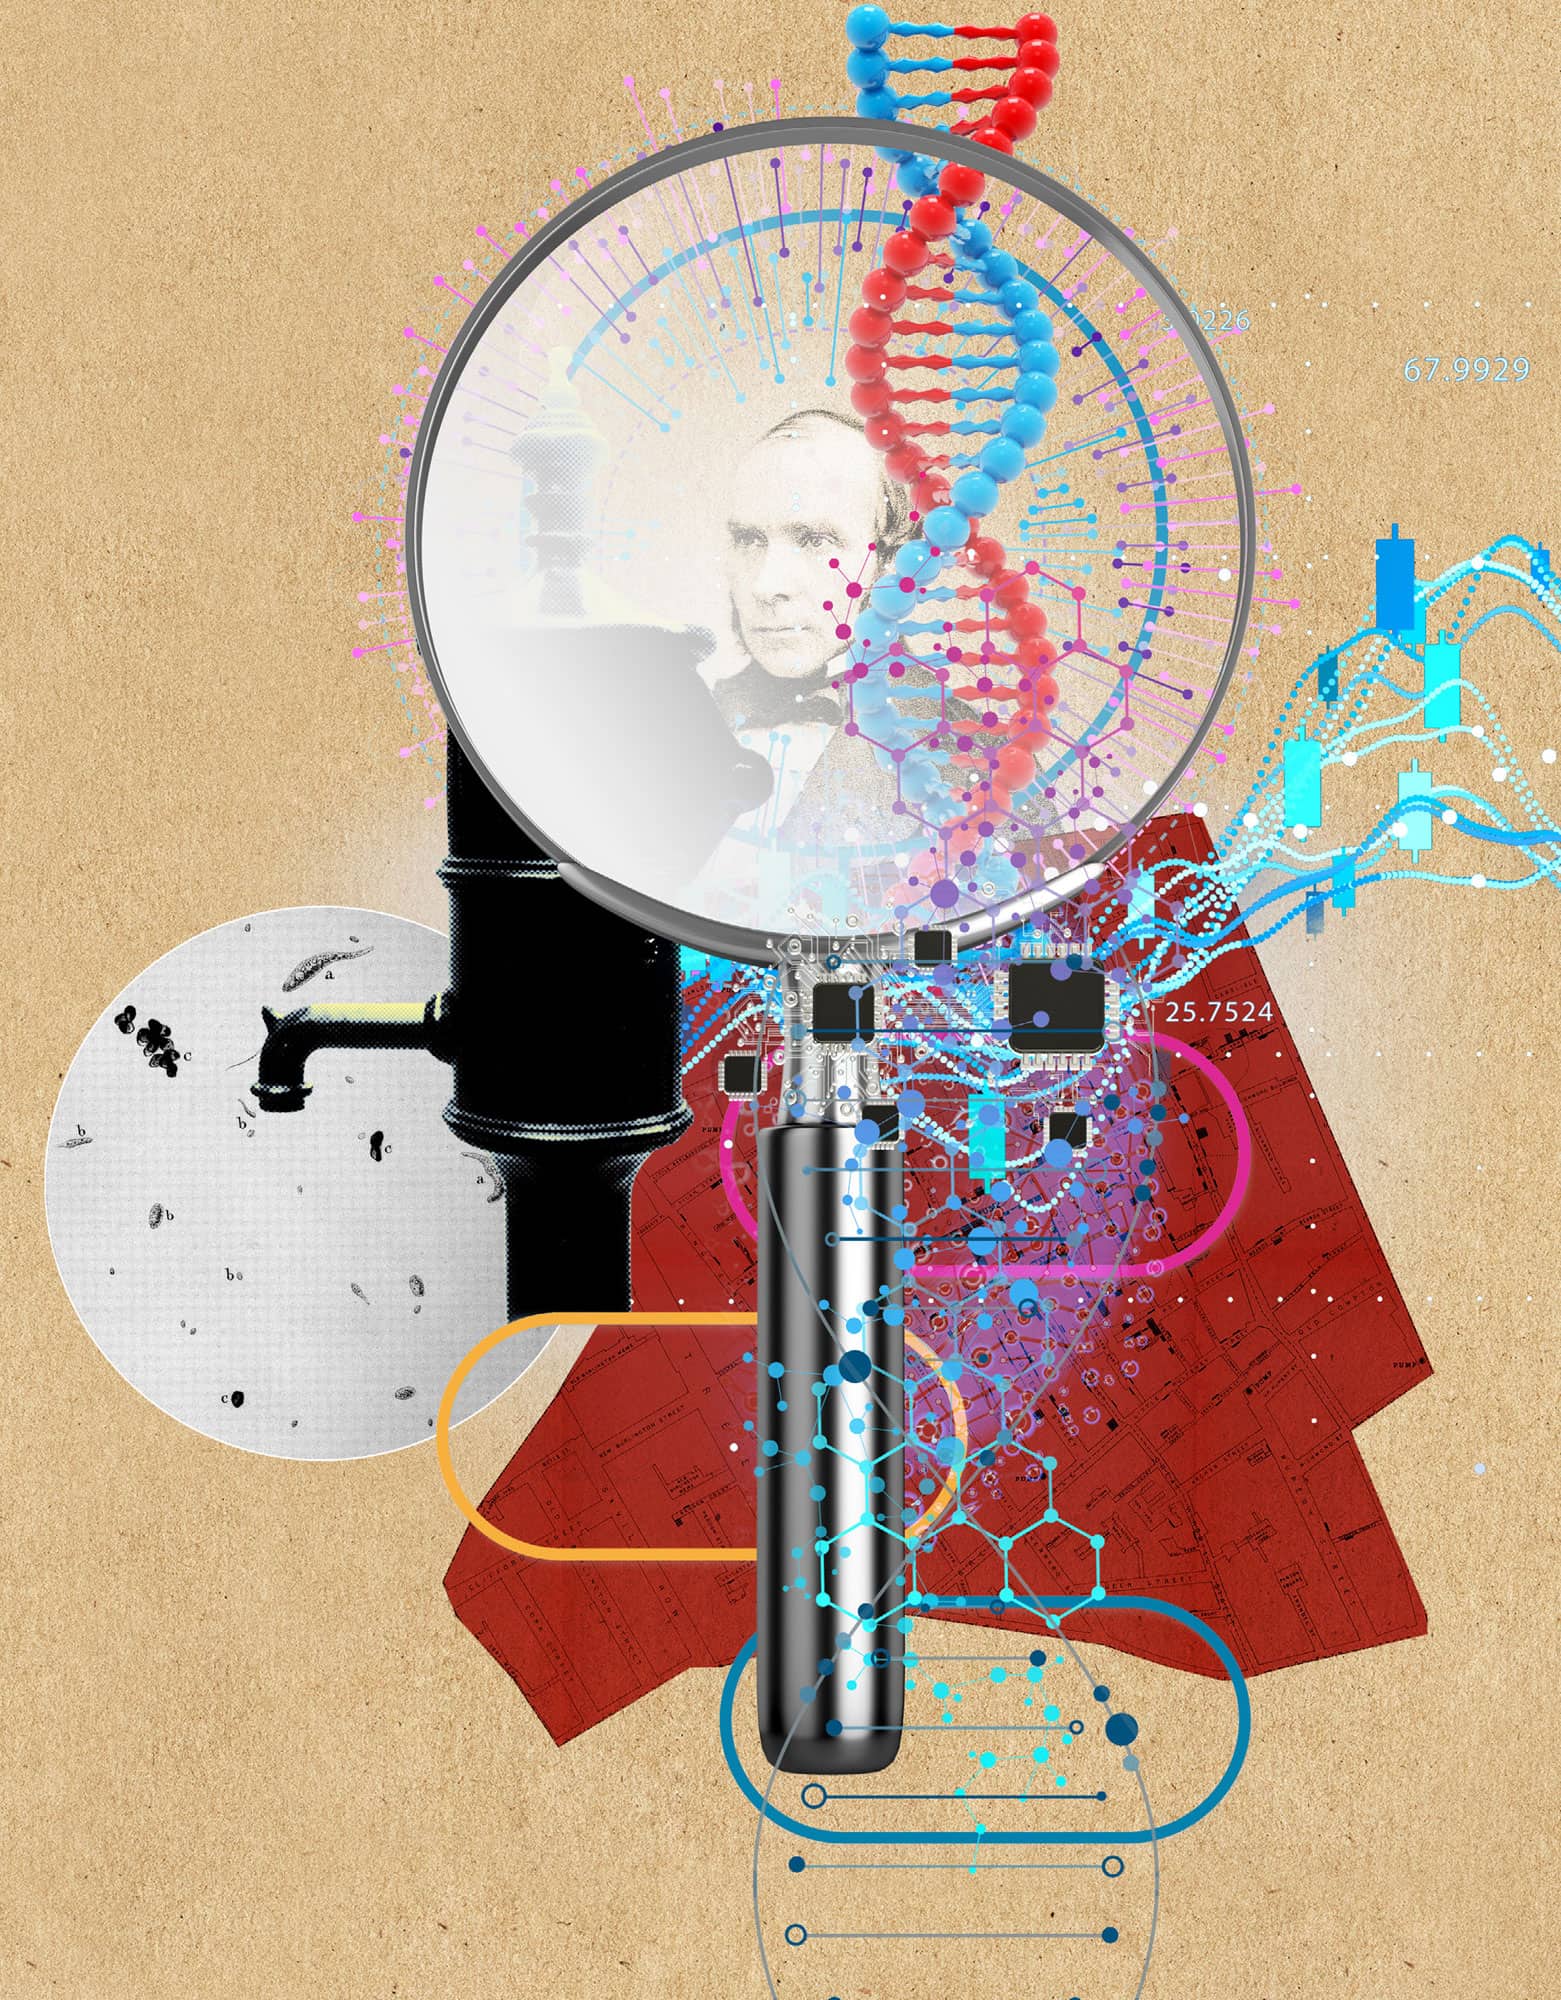
LEARNING FROM DATA
the 30-second data
Collecting data is all very well, but once collected, can more be done with it than just summarizing it? Using models, attempts can be made to gain information from the data in a more complex and useful way than before. Models effectively allow data scientists to use one or more pieces of data to predict an outcome (another piece of data) in which they are interested. For instance, age and gender data could be used to predict whether someone will get arthritis in the next five years. Creating a model with age and gender from previous individuals (knowing whether they got arthritis or not) allows us to predict what could happen to a new individual. As well as simply trying to predict future data, data can also be used to try to establish the cause of a particular outcome. This process is called ‘causal inference’ and is often used to help understand disease, for example via analysing DNA. However, even though both examples mentioned are trying to predict cases of arthritis, the modelling problems they represent are subtly different and are likely to require vastly different modelling processes. Choosing the best model based on the data and aims associated with a particular project is one of the major skills all data scientists must have.
3-SECOND SAMPLE
Analysing and modelling data can highlight information not obvious in data summaries, revealing anything from social media trends to causes of cancer.
3-MINUTE ANALYSIS
Learning from data is not a modern phenomenon. In 1854, during an outbreak of cholera in London, Dr John Snow collected and used data to show the source of the disease. He recorded where cholera cases occurred and used the data to map them back to the Broad Street Pump. Residents then avoided the pump, helping to end the outbreak of the disease. The pump remains as a landmark in London to this day.
RELATED TOPICS
See also
3-SECOND BIOGRAPHIES
JOHN SNOW
1813–58
British physician considered the founding father of epidemiology who is known for tracing the source of a cholera outbreak in London in 1854.
ALAN TURING
1912–54
British mathematician who used data from messages to help crack the Enigma code in the Second World War.
30-SECOND TEXT
Vinny Davies
Once gathered, data can be put through modelling processes, which can enhance understanding.
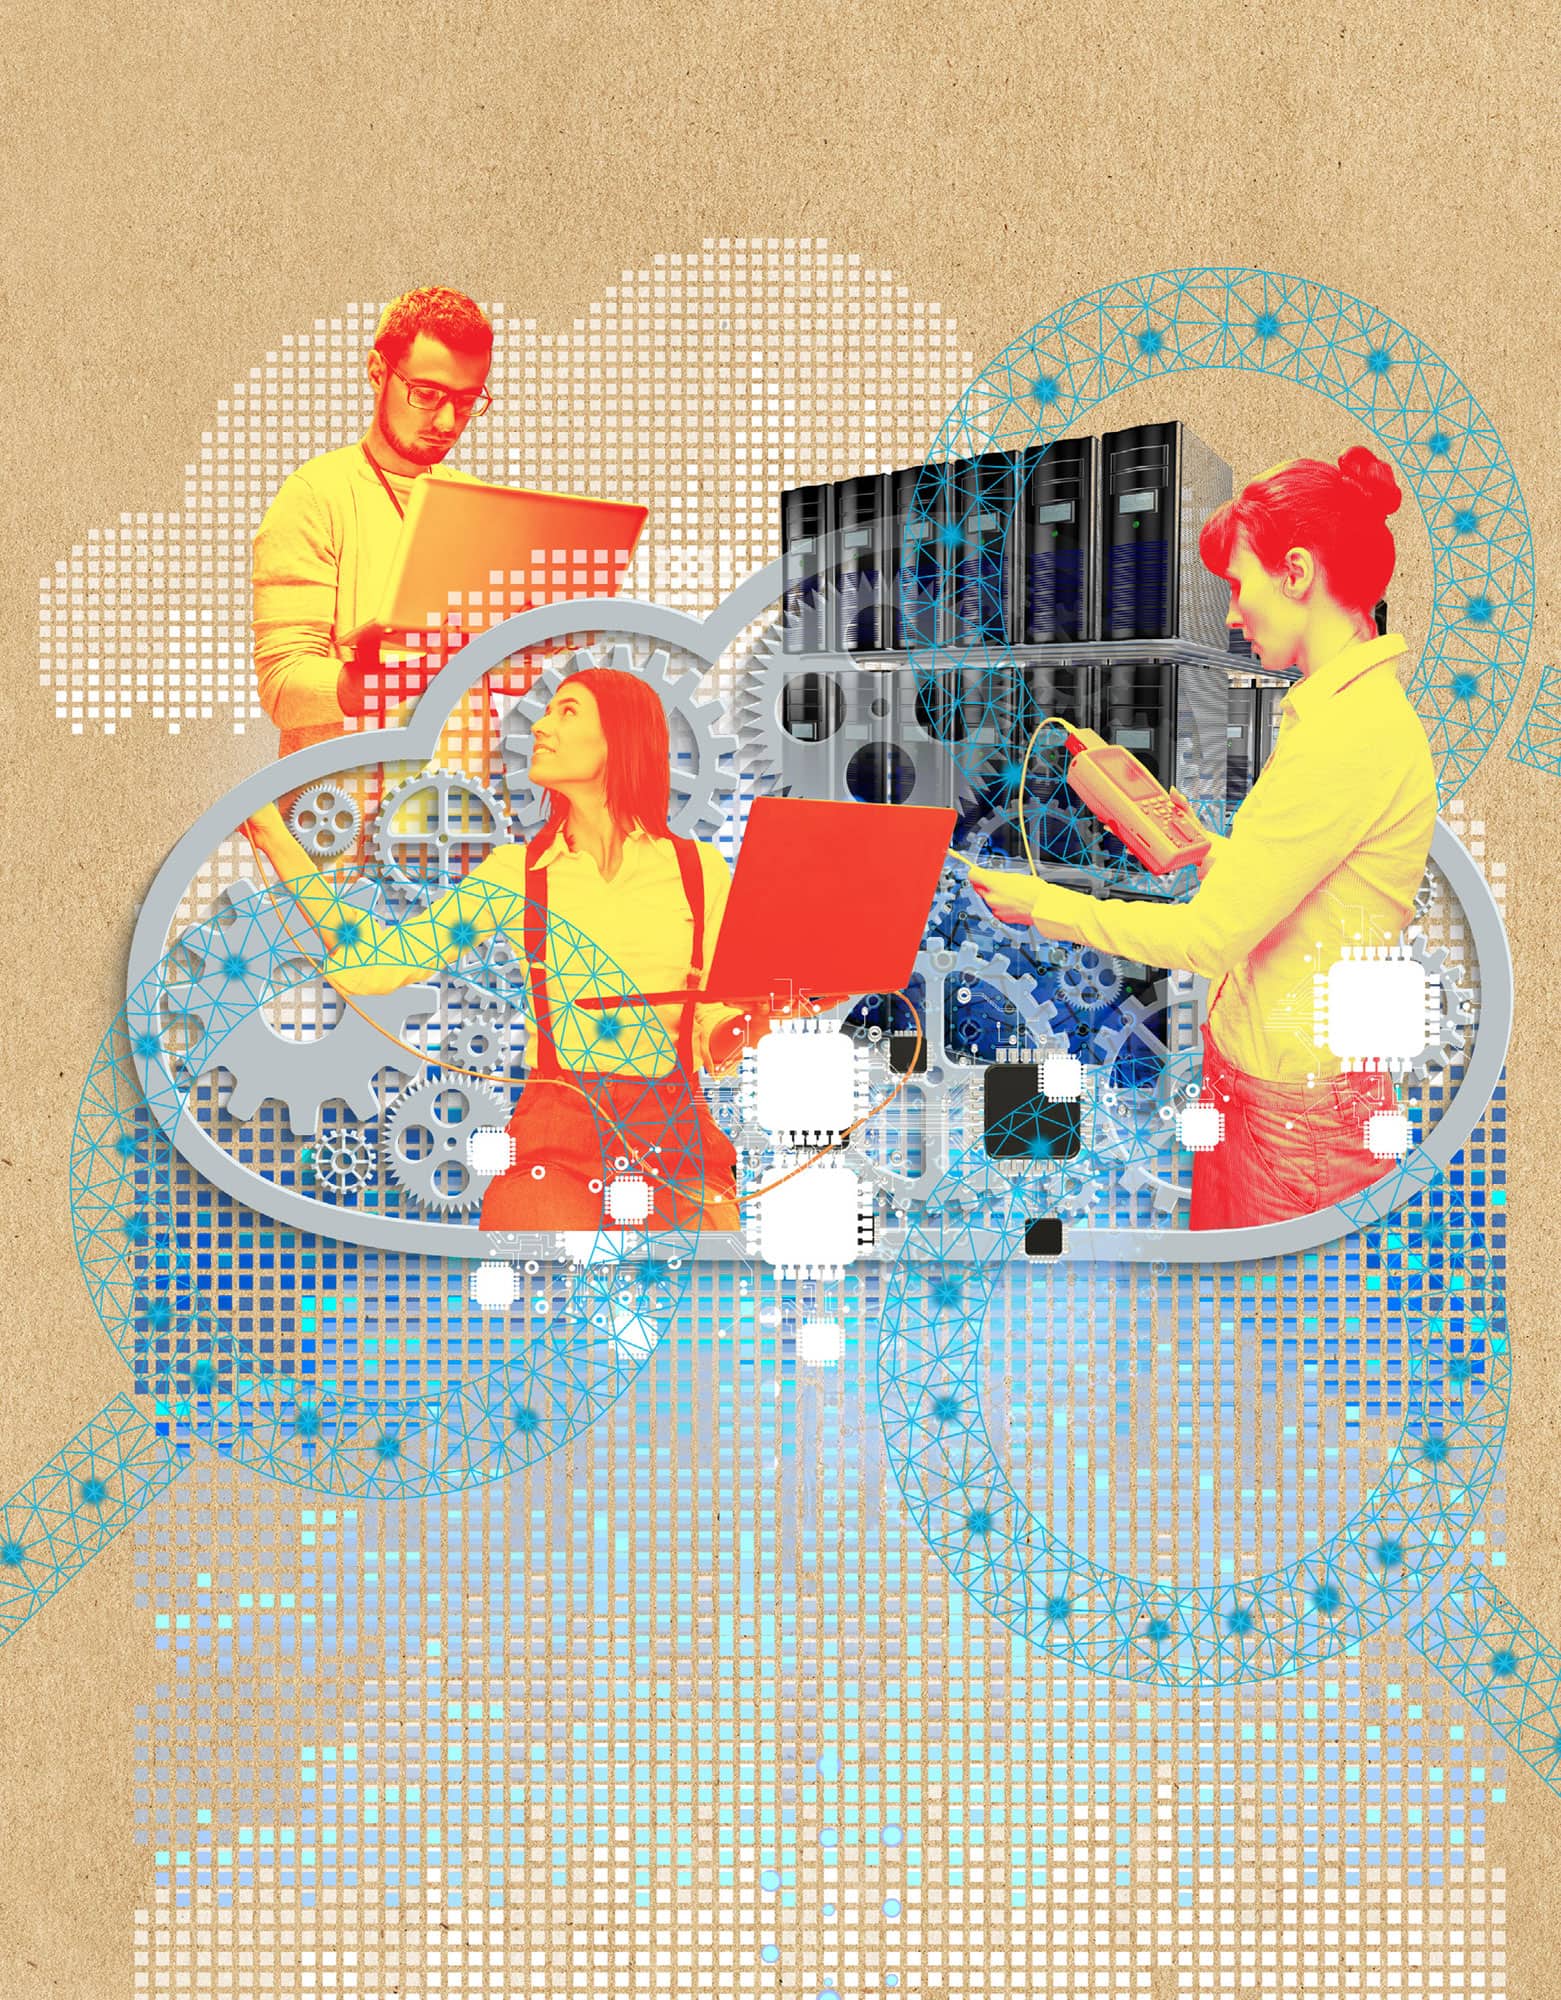
TOOLS
the 30-second data
Dealing with the massive data sets that are collected and the complex processes needed to understand them requires specialist tools. Data scientists use a wide variety of tools to do this, often using multiple different tools depending on the specific problem. Most of these tools are used on a standard computer, but in the modern era of cloud computing, work is beginning to be done on large clusters of computers available via the internet. A lot of large tech companies offer this service, and these tools are often available to data scientists. In terms of the more standard options in a data scientist’s toolbox, they can generally be divided into tools for managing data and tools for analysing data. Often, data is simply stored in spreadsheets, but sometimes, when data gets larger and more complex, better solutions are required, normally SQL or Hadoop. There is a much larger variety of tools used for analysing data, as the methods used often come from different communities, for instance statistics, machine learning and AI, with each community tending to use different programming languages. The most common programming languages used to analyse data tend to be R, Python and MATLAB, although often data scientists will know multiple languages.
3-SECOND SAMPLE
Data is big, models are complex, so data scientists have to use all the computational tools at their disposal. But what are these tools?
3-MINUTE ANALYSIS
While not explicitly a tool in the same sense as Python, SQL, etc, parallel computing is an important part of modern data science. When you buy a computer, you will likely have bought either a dual or quad core machine, meaning that your computer is capable of processing two or four things simultaneously. Many data science processes are designed to use multiple cores in parallel (simultaneously), giving faster performance and increased processing capabilities.
RELATED TOPICS
See also
3-SECOND BIOGRAPHIES
WES MCKINNEY
1985–
Python software developer who founded multiple companies associated with the development of Python.
HADLEY WICKHAM
fl. 2006–
Researcher and Chief Scientist at RStudio, known for the development of a number of key tools within the R programming language.
30-SECOND TEXT
Vinny Davies
Data scientists will choose a tool or programming language to suit the task at hand.
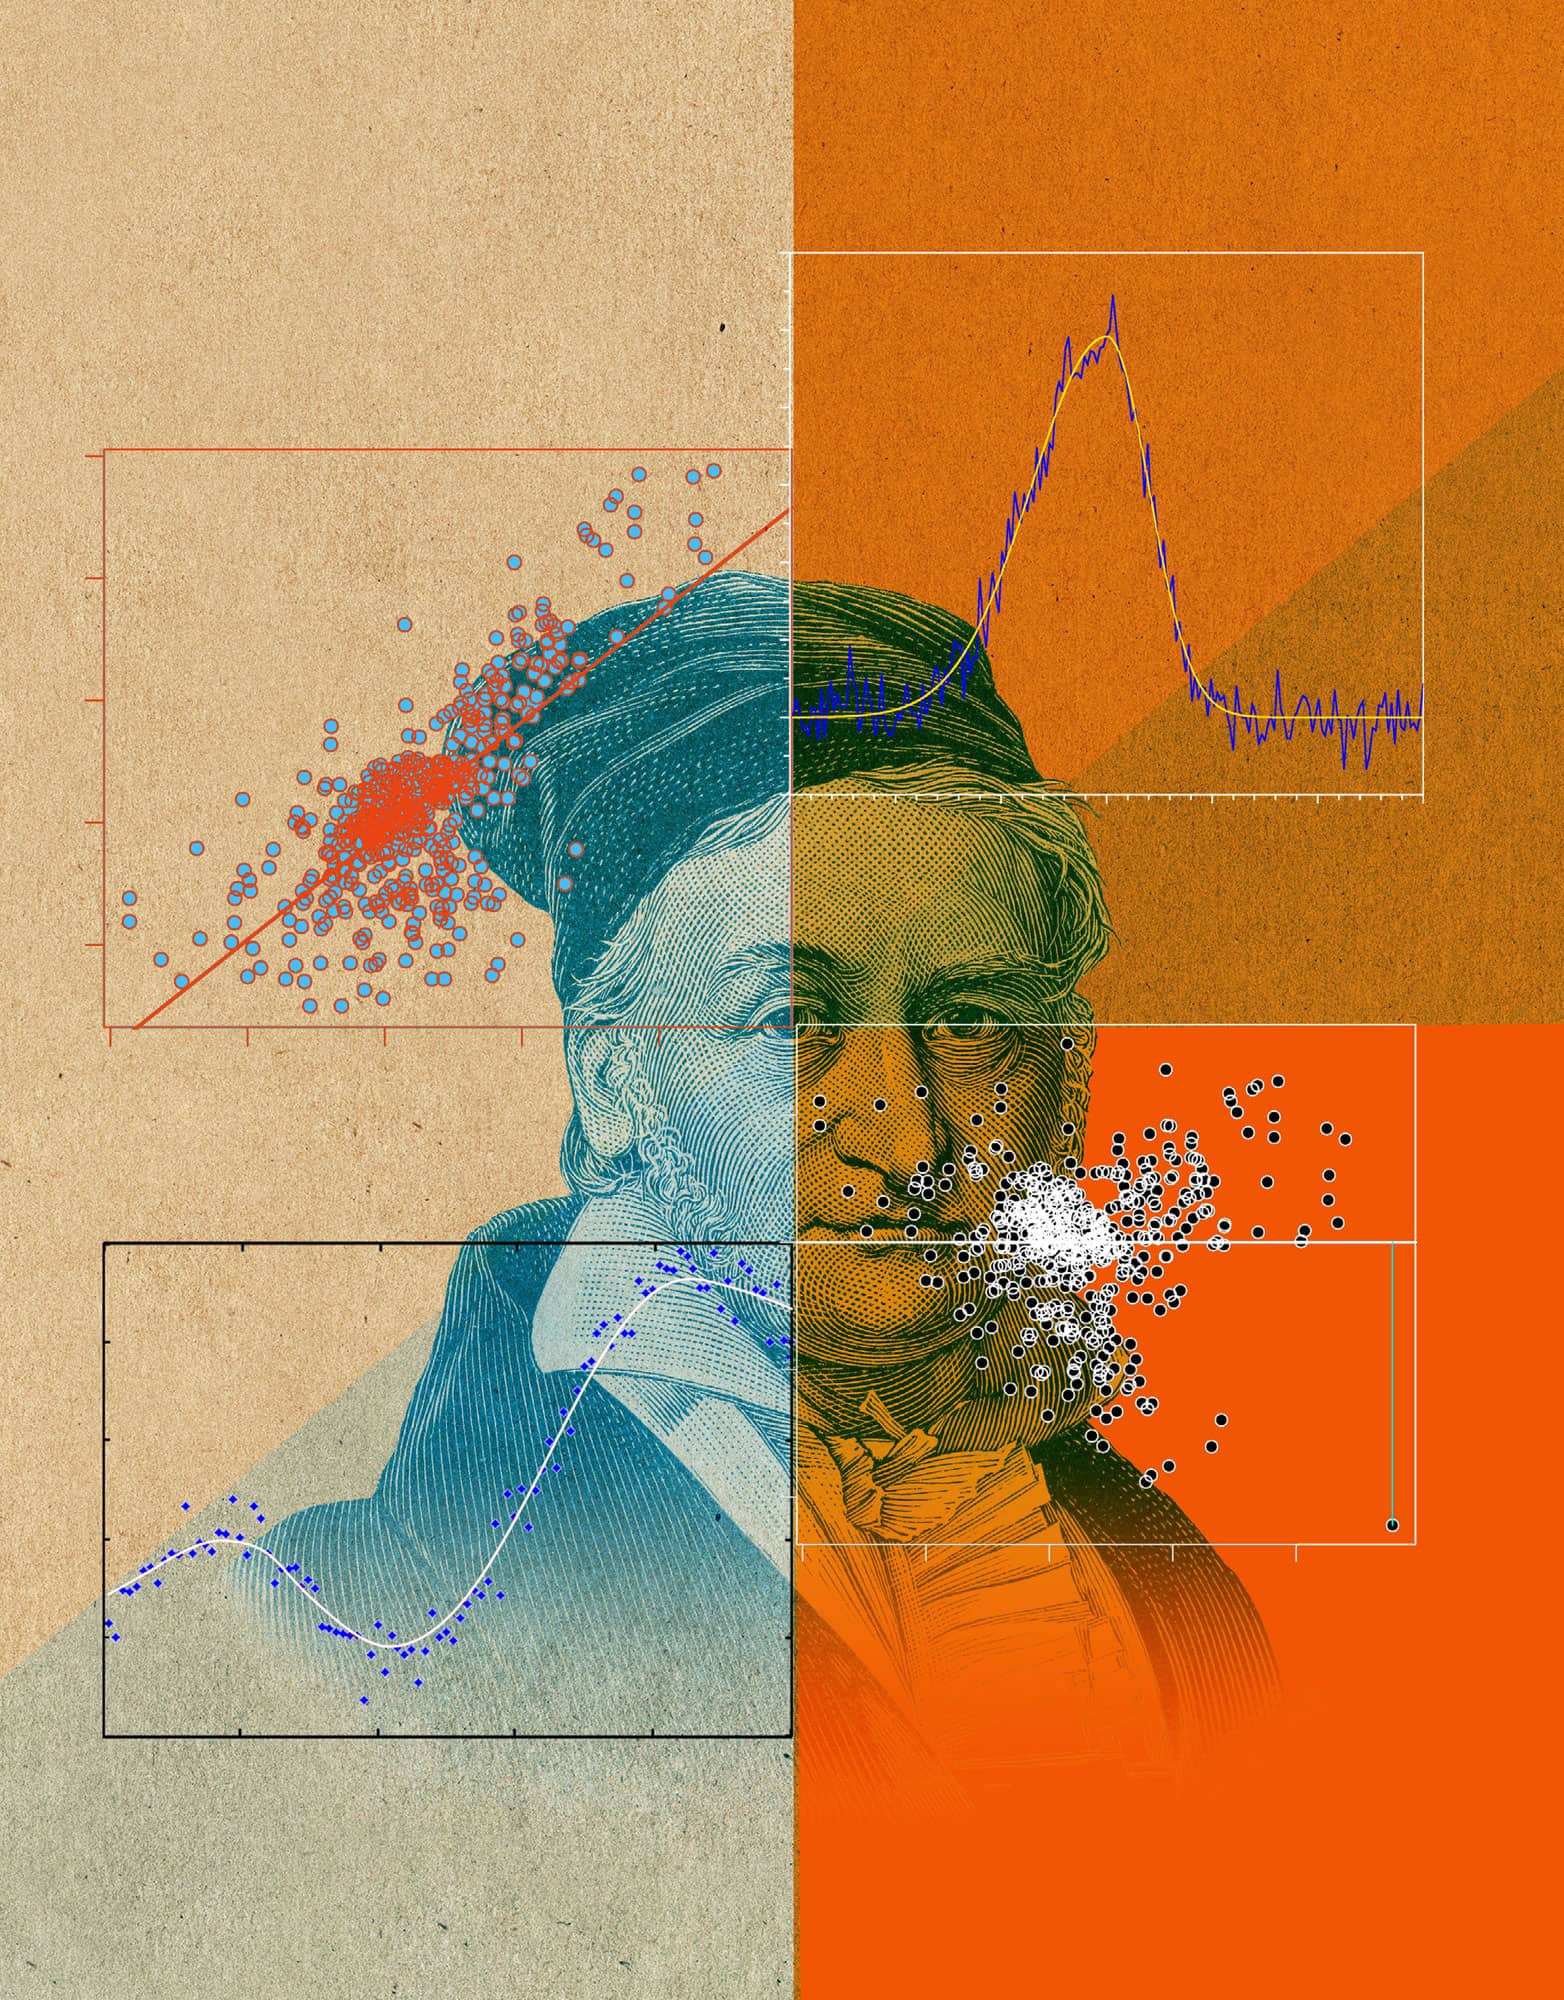
REGRESSION
the 30-second data
Regression is a method used to explain the relationship between two or more measurements of interest, for example height and weight. Based on previously collected data, regression can be used to explain how the value observed for one measurement is related to the value observed for another quantity of interest. Generally, regression allows for a simple relationship between the different types of measurements, such that as the value of one measurement changes, then we would expect the other measurement to change proportionally. Regression allows data scientists to do a couple of useful things. Firstly, it enables them to interpret data, potentially providing the chance to understand the cause of the relationship behind the measurements of interest. For instance, a relationship between data related to smoking and cancer could be identified, which would help to identify that smoking increases the risk of cancer. Secondly, it allows for predictions of future measurements based on observing just some of the measurements. If we know how much someone smokes, we can use regression to predict their chances of getting cancer in the future. This is based on the data we have seen before from other people, including how much they smoked and whether they went on to develop cancer.
3-SECOND SAMPLE
Regression predicts values based on the data collected and is one of the most important tasks in data science.
3-MINUTE ANALYSIS
Regression is not always as simple as predicting one measurement from another. Sometimes there are millions of pieces of related data that need to go into the regression model, for example DNA data, and sometimes the different pieces of data have complex relationships with each other. More complex regression methods allow for situations such as this, but often require much more complex mathematics. A big part of data science is choosing the best regression model for the data available.
RELATED TOPICS
See also
3-SECOND BIOGRAPHIES
CARL FRIEDRICH GAUSS
1777–1855
German mathematician who discovered the normal (Gaussian) distribution in 1809, a critical part of most regression methods.
FRANK E. HARRELL
fl. 2003–
Professor of Biostatistics at the Vanderbilt University, Nashville, and author of renowned textbook Regression Modelling Strategies.
30-SECOND TEXT
Vinny Davies
Regression helps data scientists understand relationships within collected data and make predictions about the future.
CLUSTERING
the 30-second data
Splitting data samples into relevant groups is an important task in data science. When the true categories for collected data are known, then standard regression techniques – often called ‘supervised learning’ – can be used, to understand the relationship between data and associated categories. Sometimes, however, the true categories for collected data are unknown, in which case clustering techniques, or unsupervised learning, can be applied. In unsupervised learning, the aim is to group samples of data into related groups or clusters, usually based on the similarity between measurements. The meaning of these groups is then interpreted, or the groups are used to inform other decisions. A simple example of clustering would be to group animals into types based on characteristics. For instance, by knowing the number of legs/arms an animal has, a basic grouping can be created without knowing the specific type of animal. All the two-legged animals would likely be grouped together, and similarly animals with four and six legs. These groups could then easily be interpreted as birds, mammals and insects respectively, helping us learn more about our animals.
3-SECOND SAMPLE
Sometimes data scientists don’t have all the necessary data to carry out regression, but in many cases clustering can be used to extract structure from data.
3-MINUTE ANALYSIS
Netflix users aren’t divided into specific categories, but some users have similar film tastes. Based on the films that users have watched or not watched, users can be clustered into groups based on the similarity of their watched/unwatched movies. While trying to interpret the meaning of these groups is difficult, the information can be used to make film recommendations. For instance, a user could be recommended to watch Ironman if they hadn’t watched it but everyone in their cluster had.
RELATED TOPICS
See also
3-SECOND BIOGRAPHIES
TREVOR HASTIE
1953–
Professor at Stanford University and co-author of The Elements of Statistical Learning.
WILMOT REED HASTING JR
1960–
Chairman and CEO of Netflix, who co-founded the company in 1997 as a DVD postage service.
TONY JEBARA
1974–
Director of Machine Learning at Netflix and Professor at Columbia University, USA.
30-SECOND TEXT
Vinny Davies
Clustering enables the grouping of data and the understanding of any connections.

STATISTICS & MODELLING
the 30-second data
When most people hear ‘statistics’ they think of a statistic, for example a percentage. While statistics are an important part of data science, more important is the discipline of statistics, with statistical modelling methods for regression and clustering being some of the most used techniques in data science. Statistics methods are known for providing relatively simple and easily interpretable techniques for analysing data. For this reason, statistical methods are usually the first place to start for most data scientists, although they are often marketed as machine learning, because it sounds cooler and the difference between them can be unclear. Statistical modelling methods often go well beyond simple regression and clustering techniques, but what they almost all have in common is interpretability. Statistical models are usually designed to clearly identify the relationships between different measurements, giving actionable results, which can guide policy in areas like medicine and society. This characteristic of statistical models is vital for helping to work out whether a relationship between measurements is due to a coincidence or resulting from an underlying causal relationship between the sources of the measurements.
3-SECOND SAMPLE
Statistics gives us many of the basic elements of data science, such as percentages, but much more interesting are the numerous methods provided by statistical modelling.
3-MINUTE ANALYSIS
Bayesian statistics takes prior information (data) that is already known, to help inform how to analyse the same type of future data. This information can come in many forms, including measurements from a related study or knowledge about the range of measurements that could occur. In Bayesian modelling, we can incorporate this information into our model in a structured and mathematical way, enabling more informed modelling choices, even with a small amount of data.
RELATED TOPICS
See also
3-SECOND BIOGRAPHIES
REVEREND THOMAS BAYES
1701–61
British statistician and church minister famous for formulating Bayes theorem, the key to Bayesian statistics.
SIR DAVID COX
1924–
Prominent British statistician and former president of the Royal Statistical Society.
30-SECOND TEXT
Vinny Davies
Statistics is the backbone of data science and statistical modelling methods are always the first place to start when looking at new data.
MACHINE LEARNING
the 30-second data
The idea of machine learning is to teach computers to learn and improve over time in an automated manner, without the need for human assistance. Algorithms can be implemented into systems, where they can make decisions automatically, often speeding up the decision-making process and reducing the possibility of human error. Within the system, the machine learning algorithms use the data they receive to make predictions about the future, helping the system to operate and choose between different options. The algorithm then updates itself based on what it learned from the information it received, ensuring that it continues to make optimal decisions in the future. An everyday example of machine learning in action is Spotify. The music app has millions of users, and data all about the type of music those users like, based on the songs they have listened to. When a new user joins, Spotify knows very little about them and will recommend songs almost at random. But as the user listens to songs, the algorithm continually learns about the music preferences of that user and how they relate to the preferences of other users. The more songs the user listens to, the better the algorithm becomes, and the song recommendations improve for that user.
3-SECOND SAMPLE
Machine learning gives us the ability to learn from data without human intervention, allowing us to automate tasks and remove human decision making.
3-MINUTE ANALYSIS
Films like The Terminator can make machine learning seem scary. So how far are we from robots stealing our jobs and Skynet taking over the world? While machine learning may take over some small jobs, it is unlikely that a truly intelligent computer will be designed which would take all our jobs. Even if that happened, humans would still need to supervise the computer to ensure it didn’t make any inhumane decisions (or create robot Arnold Schwarzeneggers!).
RELATED TOPICS
See also
NEURAL NETWORKS & DEEP LEARNING
3-SECOND BIOGRAPHIES
YANN LECUN
1960–
Professor at New York University and Chief AI Scientist at Facebook.
ANDREW NG
1976–
Stanford University Professor famous for his work in machine learning, as well as for founding the Google Brain project and online learning platform Coursera.
30-SECOND TEXT
Vinny Davies
The more data that is collected, the more a machine will learn, and the smarter it will become.
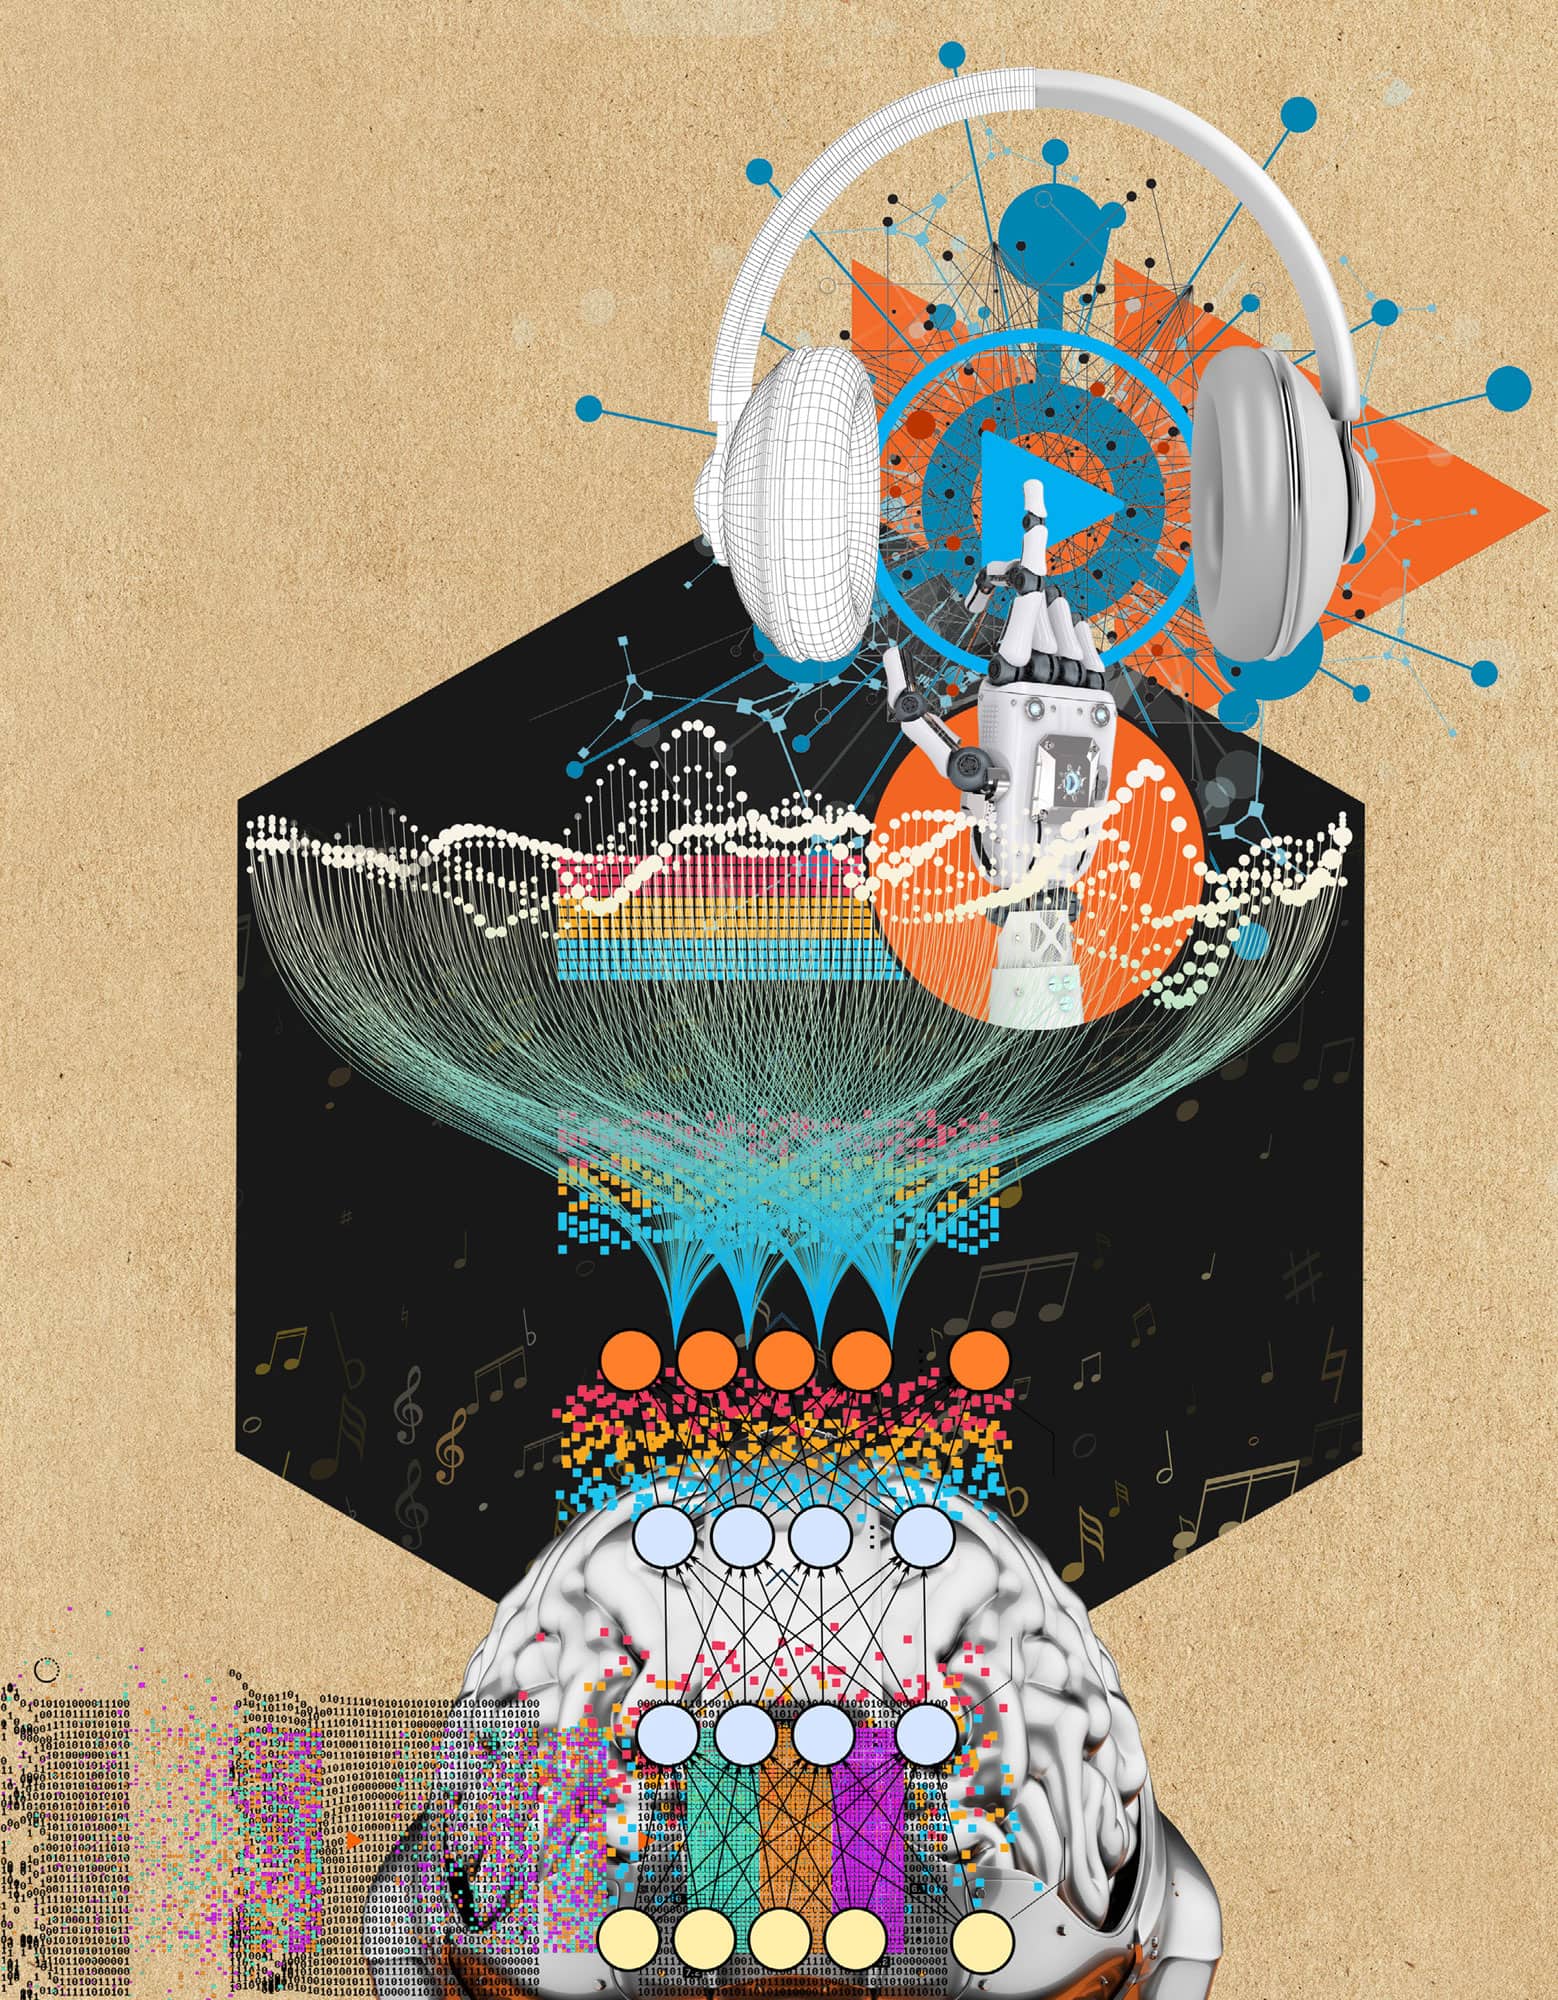
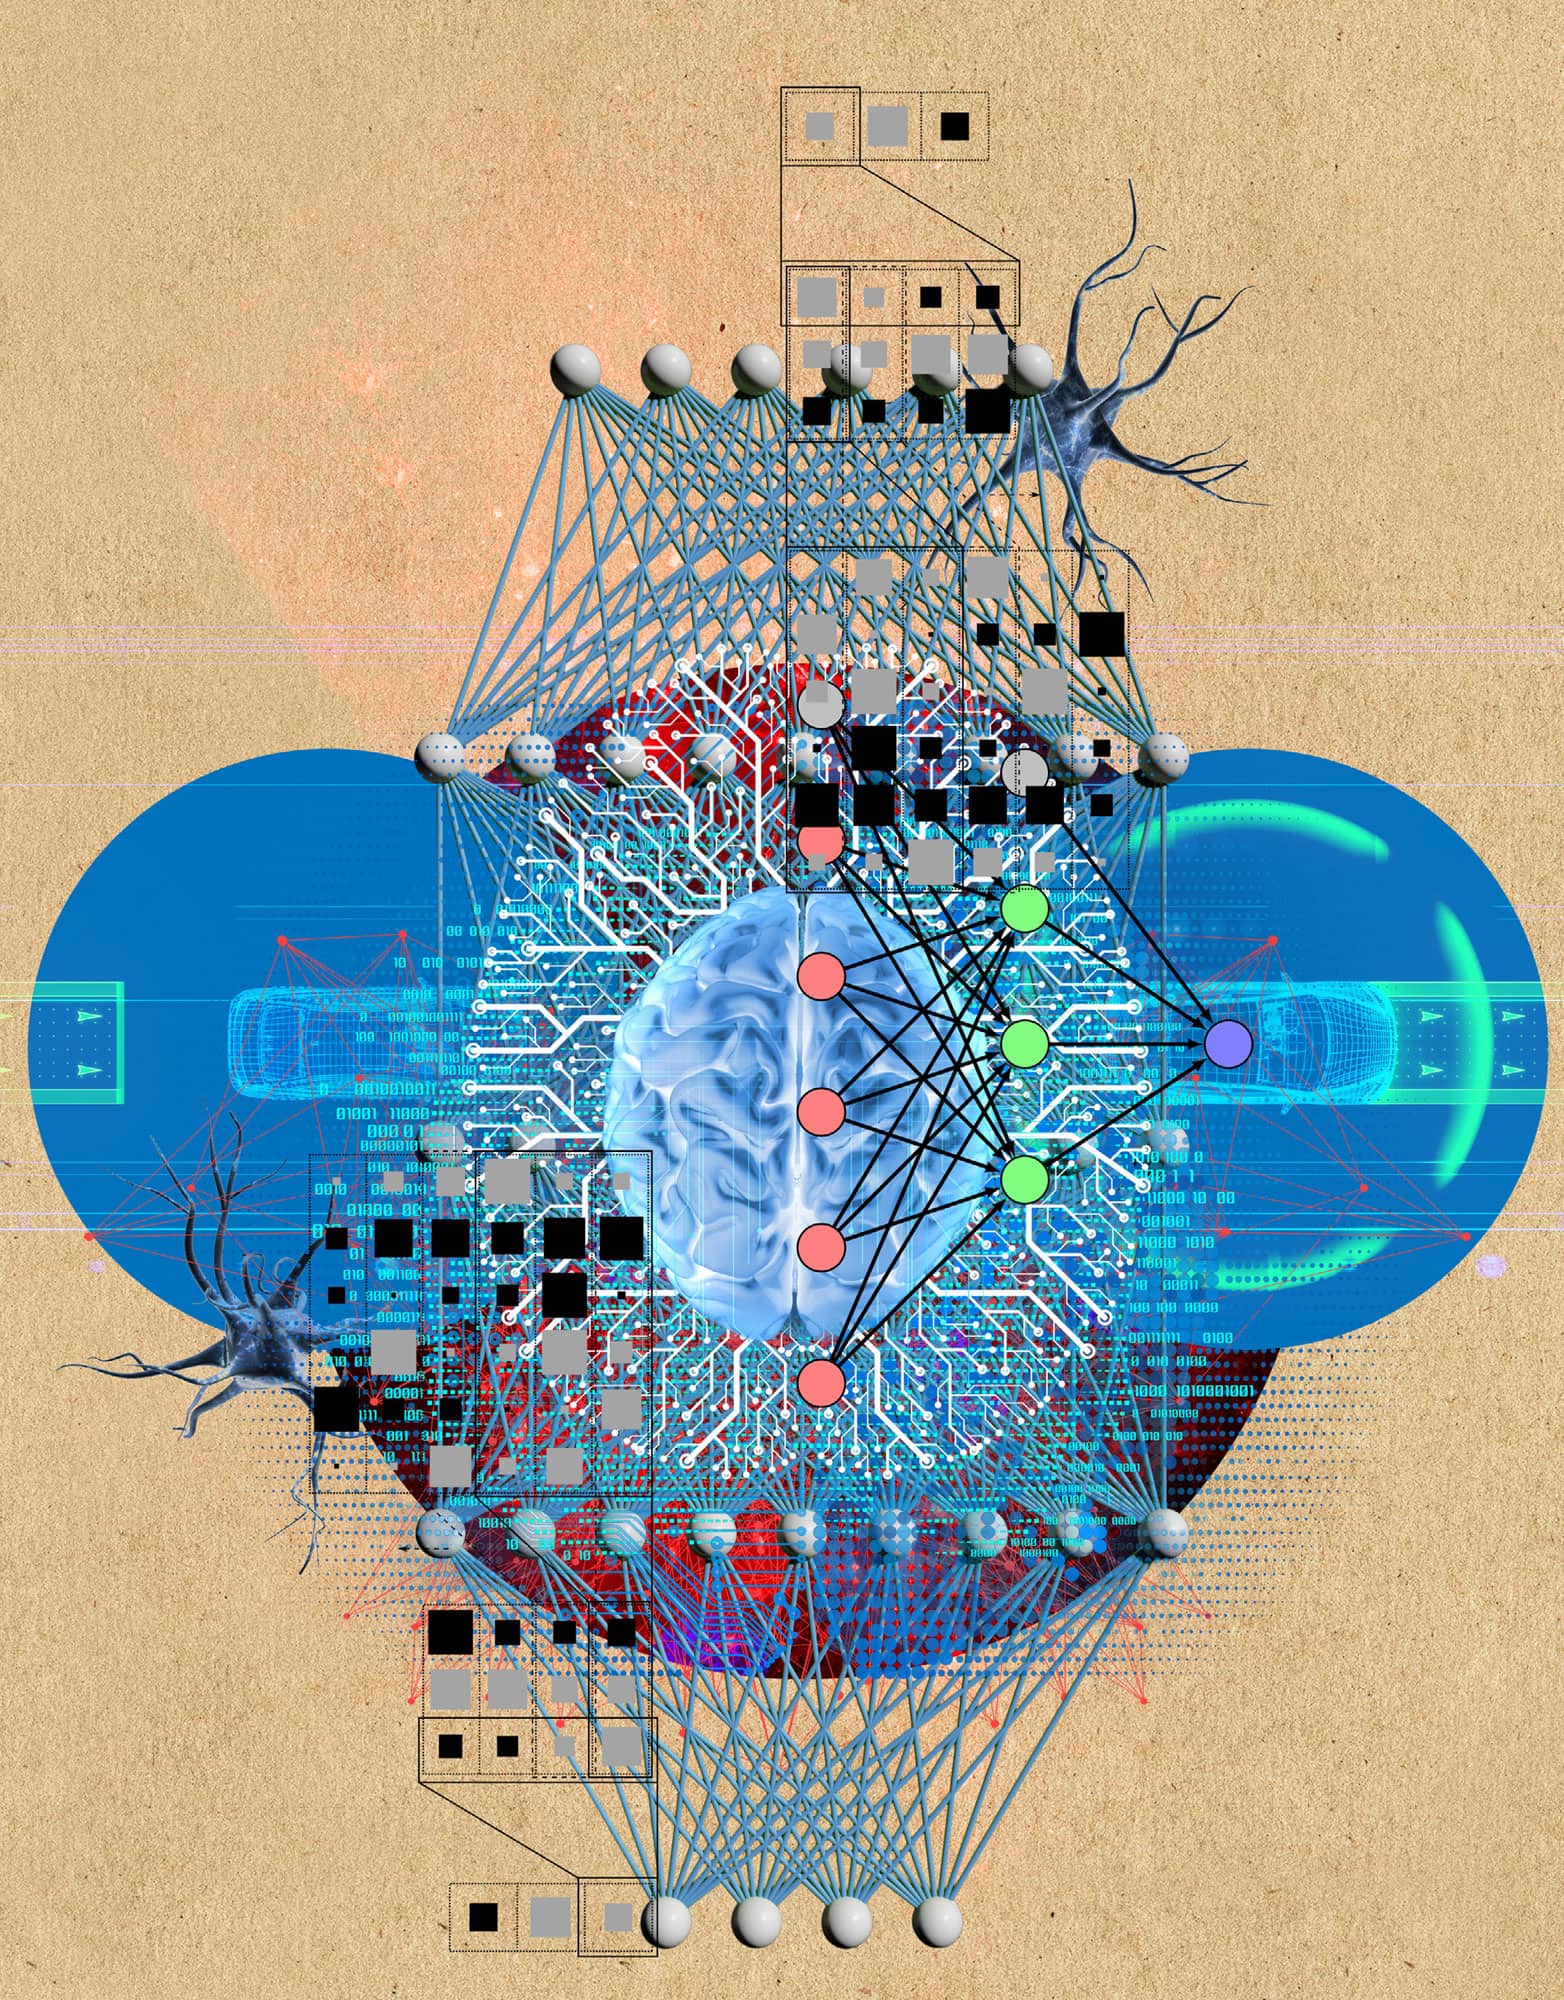
NEURAL NETWORKS & DEEP LEARNING
the 30-second data
Originally inspired by the human brain, neural networks are one of the most common machine learning methods. Like the brain, neural networks consist of a network of interconnected (artificial) neurons which allow the interpretation of images or other types of data. Neural networks are used to help in everyday life, from finding the faces in smartphone photos, to reading addresses on envelopes, ensuring they go to the correct location. Deep learning is a group of methods based around neural networks, but with a much larger number of layers of interconnecting artificial neurons. One of the uses of deep learning is analysing and responding to messages, either in the form of text (customer service chat bots for example) or speech (such as Alexa or Siri). However, the biggest use of deep learning is in image processing. Deep learning can be used to analyse the images captured by driverless cars, interpreting the results and advising the car to adjust its course as needed. It is also beginning to be applied in medicine, with its ability to analyse images such as MRIs or X-rays, making it a good way of identifying abnormalities, such as tumours.
3-SECOND SAMPLE
Many modern technologies rely on neural networks and deep learning, which have given us driverless cars and virtual assistants.
3-MINUTE ANALYSIS
Amazon has created a supermarket where you don’t need to scan items. You just pick up items, put them in your bag and walk out. The supermarket works by videoing everyone as they shop and using deep learning to identify each item customers pick up, noting whether they put it in their bag or back on the shelf. When you walk out, the cost of your items is simply charged to your account.
RELATED TOPICS
See also
IBM WATSON & GOOGLE’S DEEPMIND
3-SECOND BIOGRAPHIES
FRANK ROSENBLATT
1928–71
American psychologist famous for developing the first method that resembles a modern-day neural network.
YOSHUA BENGIO
1964–
Canadian computer scientist famous for his work on neural networks and deep learning.
30-SECOND TEXT
Vinny Davies
While deep learning is a highly sophisticated process, its prevalence in the future will depend on the level of trust it can garner.