
BUSINESS
BUSINESS
GLOSSARY
automated system Some repetitive tasks or calculations can be carried out faster, continuously and more efficiently by computers. Examples of automated systems include automated passport gates at airports, self-driving cars or speech-to-text software.
autonomous machines Able to complete a task without human input, such as a self-driving car.
big data Data set that meets some or all of the following criteria; volume, velocity, veracity and variety; must consist of a large volume or amount of individual data points, generated at a high or regular velocity. It may consist of a variety of data types including text, numerical data or images, and it will ideally be accurate or have veracity.
data analytics Obtaining, cleaning and analysing data to gain useful insights, answer research questions or inform decision making. Prescriptive data analytics describes and draws conclusions from the available data; predictive analytics aims to generalize these findings to make predictions or forecasts about the future.
foot traffic analysis Often used in the retail sector to measure how many customers enter a shop, and their movements and behaviour while browsing.
geolocation data Describes the location of a person or object over time.
Go Two-player strategy game, where the aim is to capture the most territory. Google’s DeepMind has developed several algorithms designed to compete against humans.
Internet of things (IoT) Internet-connected or ‘smart’ devices, including activity monitors, home assistants and TVs, which provide improved functionality compared to their offline counterparts through the collection and analysis of data in real time. For example, a smart home assistant is able to communicate with and control items around the home such as smart light bulbs, central heating and security systems.
natural language-processing algorithms Techniques for analysing written or spoken language. This could include the contents of political speeches, vocal commands given to a smartphone or written customer feedback on an e-commerce website. Common natural language processing techniques include sentiment analysis, where text is labelled as positive or negative depending on its tone, and topic modelling, which aims to identify the overall theme or topic of a piece of text.
probability theory Branch of mathematics concerned with representing probabilities in mathematical terms. The field relies on a set of underlying assumptions, or axioms, including ‘the probability of an event is a non-negative, real number.’
prototype Working draft version of a piece of software or hardware, sometimes referred to as a minimum viable product, or MVP.
quantitative finance Uses probability and mathematical techniques to model financial problems.
quantum mechanics Branch of physics concerned with the behaviour of atomic and subatomic particles.
reinforcement learning Branch of machine learning, where algorithms learn to take actions which maximize a specified reward.
tabulating system A machine, developed in the 1800s, designed to store information in the form of hole-punched cards. Its first use was in the 1890s, to store data collected during the first US census.
tracking cookies Piece of information from a website, stored by a person’s web browser, which is shared or tracked across websites, to track a user’s online journey. They may be used by third party advertising providers, to serve personalized adverts based on a user’s browsing history.
INDUSTRY 4.0
the 30-second data
Industry 4.0 can be more easily understood as a ‘smart factory’, where internet-connected systems/machines communicate and cooperate with each other in real-time to do the jobs that humans used to do. This relies on the Internet of things (IoT), the extension of internet connectivity into devices and everyday objects. While Industry 4.0 can have an ominous ring to it in certain circles, there is a vast amount of incredible applications to our daily lives. From robots picking and packing items in a warehouse for delivery, to autonomous cranes and trucks on building sites, and using information collected from these machines to find and optimize irregularities in business systems – the possibilities are endless and, as of yet, unknown. Business is not the only winner in this industrial revolution. For example, providing assistance to elderly or disabled individuals through homecare advances with systems like voice control or alerts for falls or seizures. However, there are large barriers to the full implementation of Industry 4.0, integration being one of the biggest. There are no industry standards for connectivity and the systems themselves are fragmented between different industries and companies. Privacy concerns are overwhelming, with the amount of data collected (personal and otherwise) by these systems needing to be protected, as are decisions over ownership.
3-SECOND SAMPLE
‘Humankind will be extinct or jobless’ is the feared mantra with the fourth industrial revolution in manufacturing, where machines use data to make their own decisions.
3-MINUTE ANALYSIS
Millions of people are employed by the manufacturing industry and fears over job loss from the data revolution/Industry 4.0 are real and already evident. While this may be very worrisome, many are using it as an opportunity to push for the idea of a ‘universal basic income’. This is a periodic monetary compensation given to all citizens as a right, with the only requirement being legal residency. This stipend would be enough for basic bills and living, with the aim that individuals will be free to pursue any interest.
RELATED TOPIC
See also
3-SECOND BIOGRAPHY
HUGH EVERETT
1930–82
First proposed the Many Worlds interpretation for quantum mechanics and operations research.
30-SECOND TEXT
Liberty Vittert
Connectivity and standardization across industries are a major obstacle to the widespread adoption of smart factories.

ENERGY SUPPLY & DISTRIBUTION
the 30-second data
Our energy supply is transitioning from fossil fuels and centralized infrastructure to a renewable, decentralized system, and data analytics eases the challenges of that transition. As the output of wind farms and solar photovoltaic plants is weather-dependent, high-resolution weather forecasting based on predictive analytics has wide applications in improving design and operation of these systems, from optimizing the layout of wind turbines in a field to automatically adjusting the angle of solar panels to maximize power generation despite changing conditions. As electricity is then transmitted to the end customer, analytics is critical to managing the growing complexity of the power grid due to ‘distributed energy resources’ – controllable devices such as backup generators, home batteries and smart thermostats, often owned by homeowners and businesses. These devices are excellent resources for balancing the grid, and grid operators can use analytics to determine which mix of devices to pull from at any time based on weather, historic energy demand, the performance and tolerances of each device, and grid conditions like voltage. For grid operators, analytics is also useful in planning infrastructure investments, allowing them to predict which parts of the network will be most strained decades into the future.
3-SECOND SAMPLE
Data science is key to managing the growth of renewable and distributed energy sources in the electric power system.
3-MINUTE ANALYSIS
Fossil fuels still make up a large part of global energy consumption, and oil and gas companies make liberal use of analytics as well – in characterizing untapped oil reservoirs below the earth’s surface, optimizing drill operations when drilling new wells, forecasting impending equipment failures, deciding which oil streams to blend together, and more.
RELATED TOPICS
See also
3-SECOND BIOGRAPHY
THOMAS EDISON
1847–1931
Architect of the world’s first power grid, which went live in New York City in 1882.
30-SECOND TEXT
Katrina Westerhof
Data like demographics and infrastructure condition can inform decisions about where to increase the capacity of the power grid.

LOGISTICS
the 30-second data
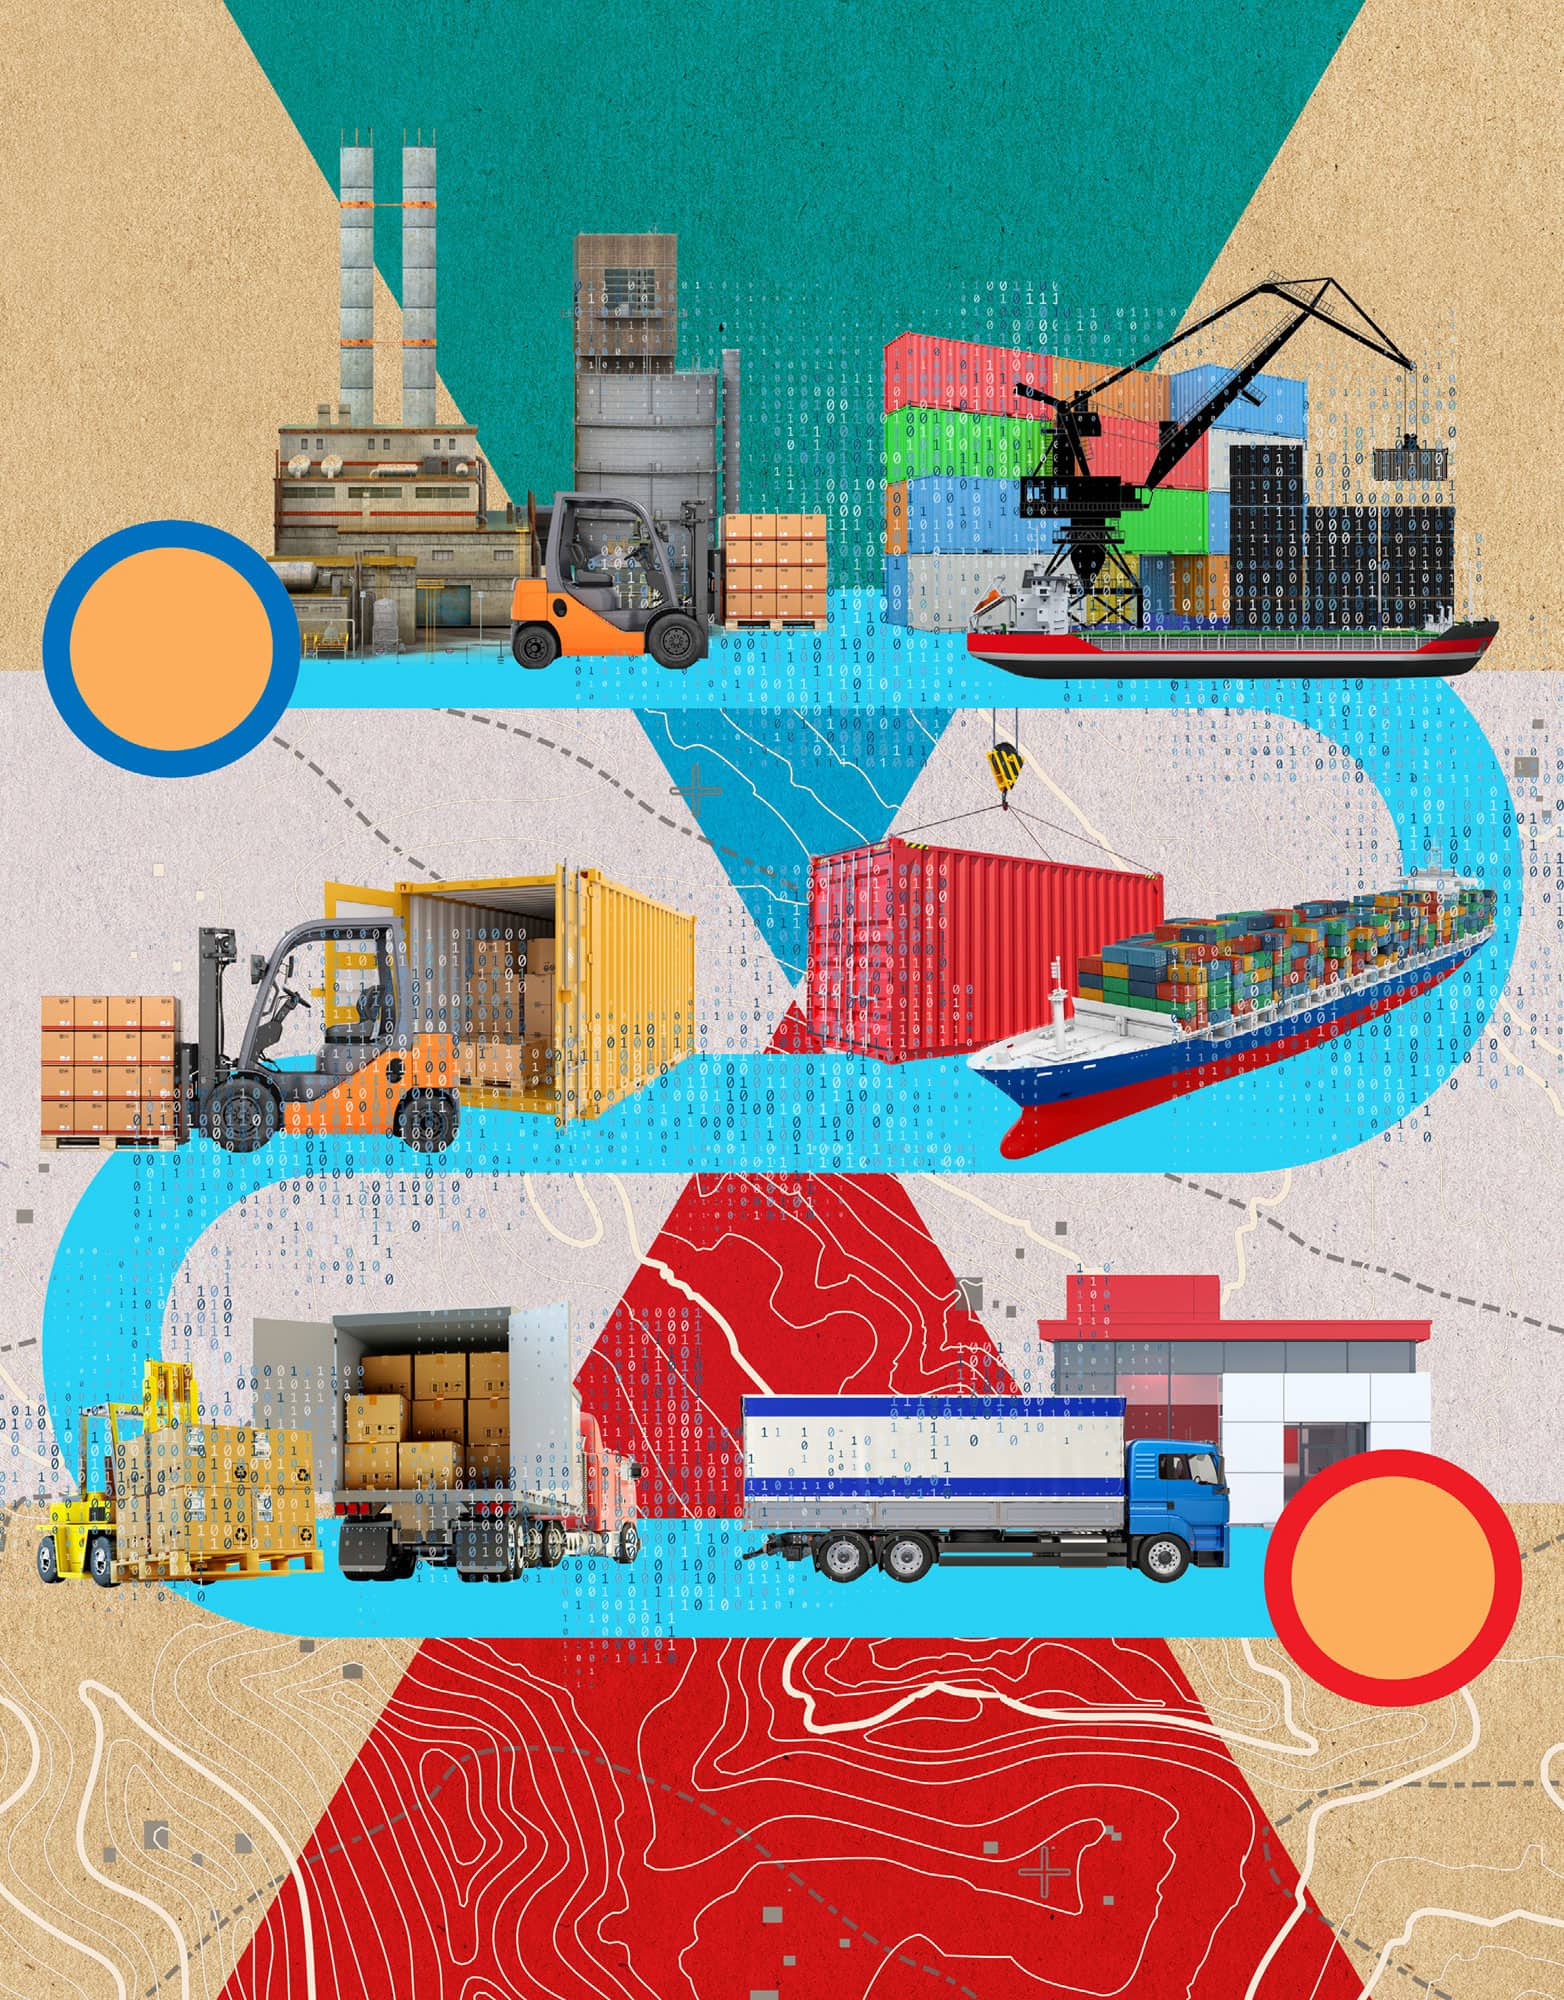
Route optimization – born of both predictive and prescriptive data analytics – has unlocked enormous benefits for the previously low-tech logistics industry, reducing fuel consumption and improving reliability of service. When delivering packages to homes and businesses, logistics companies can now identify the most efficient routes for each driver, each day, across the entire fleet, taking into account delivery deadlines, traffic patterns and weather forecasts. Upstream, in freight shipping, shippers can apply similar techniques to optimize the route from an origin point to a distribution facility, choosing the right combination of sea, air, rail and road transport to get each shipment to its destination most efficiently and on time. In both cases, the tools exist today to make these optimizations dynamic, allowing carriers to reroute parcels in real time as conditions change, and for delivery routes, even recommending the ideal driving speed on each leg of the route to consistently hit green traffic lights. Beyond optimizing how an item gets to its destination, big data and analytics also provide insights into how to structure a global logistics network, such as where to build new hubs, distribution facilities and customer drop sites as transportation constraints and customer demand change.
3-SECOND SAMPLE
Getting an item from Point A to Point B is more efficient and reliable with optimized routing, enabled by data analytics.
3-MINUTE ANALYSIS
In the context of supply-chain management, the value of analytics for logistics is even greater. Predictive analytics will improve inventory management by considering the impacts of factors like geopolitics, weather and climate change, and consumer sentiment on product availability or demand. And integrating data across the supply chain unlocks new opportunities – for example, dynamically rerouting a shipment of ripe fruit to a nearer store or a store where fruit sells more quickly, thereby reducing food waste.
RELATED TOPICS
See also
3-SECOND BIOGRAPHY
JUAN PEREZ
1967–
Chief Engineering and Information Officer at UPS who led the implementation of the company’s ORION route optimization project.
30-SECOND TEXT
Katrina Westerhof
Dynamic route optimization enables shippers to be responsive to changing conditions in the supply chain.
MARKETING
the 30-second data
The advent of marketing data science has allowed businesses to target their ideal customers more effectively. To some extent, this has had equalizing effects for up-and-coming retailers competing with large, established online retail platforms like Amazon. However, the established players still have an incredible competitive advantage in the form of user data. While smaller firms rely almost exclusively on tracking cookies and data brokers (who provide demographic and commercial information on individuals) to target a customer profile, large industry players such as Amazon, Google and Alibaba have immense amounts of data on every single one of their respective users. In a 2019 disclosure by Amazon, it was revealed that over 100 million customers pay a membership fee for Amazon Prime, its two-day shipping service bundled with myriad other services like streaming content and food delivery. The marketing advantage due to data availability alone is so pronounced in this case that antitrust legislation is being proposed to prevent companies from acting as both sellers and platforms for selling. However the future of online commerce plays out, it is clear that as society becomes ever more digital, data science will be an essential method in determining who we are and, more importantly, what we want to buy.
3-SECOND SAMPLE
As data science rose from its infancy to become its own field, separate in discipline from software engineering or statistics, digital marketing’s dominance rose with it.
3-MINUTE ANALYSIS
Some lament data science and marketing’s close relationships. Cloudera’s own Jeff Hammerbacher (formerly lead data scientist at Facebook) has been famously quoted: ‘The best minds of my generation are thinking about how to make people click ads.’ In its most nefarious form, data science is a key contributor to the social media addiction phenomenon, as practitioners work to keep you engaged with the platform by which they can serve you adverts for longer periods of time.
RELATED TOPICS
See also
3-SECOND BIOGRAPHIES
SUSAN WOJCICKI
1968–
CEO of YouTube following Google’s acquisition, and dubbed the ‘most important person in advertising’.
JEFF HAMMERBACHER
1982–
Chief scientist and co-founder at Cloudera; formerly led the data science team at Facebook.
30-SECOND TEXT
Scott Tranter
Modern marketing methods are driven by vast amounts of data, used to create highly targetable consumer profiles.

FINANCIAL MODELLING
the 30-second data
Ever since Ed Thorp popularized the application of probability theory in financial markets, trying to beat the market has been a continuous, elusive conquest, and data science has been an integral tool in optimizing investment strategies. In the past few years, competition has been fierce for new alternative data sets, from which unique and proprietary insights can be extracted, hoping to give traders the edge in predicting the next price move. For example, aggregated credit card data can be used to estimate real-time revenues for companies ahead of earnings, which are otherwise released only quarterly, and bets can be placed using this granular source of information ahead of the official release. Foot traffic analysis can also help with estimating and trading around earnings – satellite imagery to count cars at supermarket car parks can indicate trends in volume of shoppers, and geolocation data derived from devices such as mobile phones can illuminate consumer behaviour. Natural language-processing algorithms enable machines to understand text, and can further help extract sentiment about the market when applied to news feeds, call transcripts regarding company earnings and analyst reports.
3-SECOND SAMPLE
With the quantitative revolution in finance, data scientists are en vogue, and potentially the key to the holy grail of figuring out the market’s next move.
3-MINUTE ANALYSIS
Market impact takes place when a participant seeks to buy or sell an asset on an exchange, and their own footprint pushes the price adversely against them. For example, when buying 10,000 shares of Apple, the price of the last share purchased may be higher than the price when the trade was initiated. Minimizing this effect can be modelled as a classic ‘reinforcement learning’ problem, where feedback from a series of actions are incorporated into subsequent trading decisions.
RELATED TOPICS
See also
IBM’S WATSON & GOOGLE’S DEEPMIND
3-SECOND BIOGRAPHY
EDWARD O. THORP
1932–
US mathematics professor who pioneered the modern applications of probability theory in the financial markets.
30-SECOND TEXT
Sivan Gamliel
As availability of diverse data sources continues to grow, so grows the dominance of quantitative traders on Wall Street.

NEW PRODUCT DEVELOPMENT
the 30-second data
Developing a product means solving a problem or fulfilling a desire that a customer is willing to pay for. Often, developers start by looking at products that sold in the past, then, for inspiration and prototyping, the product is tested with surveys or focus groups, after which it is tweaked accordingly and put on the market. Collecting data helps product developers to refine features and pricing, but usually intuition plays a big role. The internet has turned this process on its head, because every move a customer makes while browsing products online, reading the news or even watching TV can be tracked. Netflix collects a consumer’s preferences on joining, along with ratings on films you have already seen. When using the service, it tracks when and what is watched, whether viewers return after a pause, whether they finish watching a programme and what they watch next. Before a new programme is developed, the developers already know – from data analytics on their millions of members – what each viewer likes and how many are likely to watch it. They then make programmes with actors and stories they know will be popular. This is just one example of how data analytics is changing product development.
3-SECOND SAMPLE
Internet-based data collection and analytics offers much more detailed data on when, what and how people use products, enabling a much deeper understanding of consumer needs.
3-MINUTE ANALYSIS
Big consumer products companies like Procter & Gamble use data to build computer models of new products such as disposable nappies even before their first physical prototype. When they go to market, they use a computerized ‘digital pulse’ to track blogs, tweets and online ratings and comments to see how their products are faring. This allows them to react quickly to things that happen in the marketplace, both good and bad.
RELATED TOPICS
See also
30-SECOND TEXT
Willy Shih
Owing to the vast amount of information developers have at their fingertips, they might know what you want even before you do.
