Floods, famines, earthquakes, volcanic action, political instability, revolutions, pillage, and plague notwithstanding, we are still here and are even insuring many phenomena. Given the potentials for disaster, why are things so good?
In recent decades, governments, corporations, and ordinary citizens the world over have become more aware of the potential impact of extreme-event, or catastrophe, risks. Dramatic events such as the September 11 attacks (2001), the Indian Ocean tsunami (2004), Hurricane Katrina (2005), the Great Sichuan earthquake (2008), and the Tohoku earthquake and tsunami (2011) continue to raise these issues in the public mind while sending researchers from various disciplines scrambling to explain and forecast the frequencies and severities of such events.
Extreme events are, by their nature, rare. In insurance parlance, a catastrophe can be described as an event whose severity is so far out on the loss distribution that its frequency is necessarily low.2 One inevitable result of the rarity of catastrophes is the sparseness of relevant data for estimating expected loss frequencies and severities, which leaves governments, insurance companies, and their risk-assessment experts with a difficult statistical problem: how to make reasonable forecasts of insured catastrophe losses based upon few historical observations. In the present chapter, I will consider two troublesome issues arising from the paucity of catastrophe data: (1) a tendency to oversimplify conclusions from scientific research; and (2) the use of “black-box” forecasts that are not subject to impartial scientific examination and validation.
Catastrophe Risk
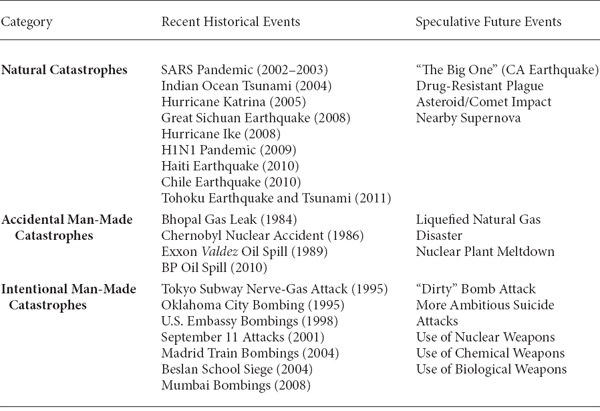
To begin, let us delimit the class of exposures under discussion. By catastrophe, I will mean a well-defined, sudden occurrence with low expected frequency and high expected severity that falls into one of three distinct categories: (1) natural events; (2) accidental man-made events; (3) intentional man-made events. The second column in Table 13.1 provides historical examples of some of the largest and most widely publicized catastrophes for each of these categories. Given the incidents listed in this column, several questions come to mind:
• Are severe storms becoming more frequent, perhaps as a result of global climate change?
• Are man-made accidents becoming less common and/or less costly, perhaps because of improving risk management efforts?
• Are intentional man-made disasters becoming more frequent, and is there an upper bound on their severity?
• Is it meaningful—or even possible—to discern trends in such volatile events, given the limited historical database?
In The Outline of History, British author H. G. Wells famously stated: “Human history becomes more and more a race between education and catastrophe.”3 Although Wells was commenting on the state of humanity in the shadow of World War I, his observation certainly remains equally valid today. A brief review of the hypothetical incidents in the third column of Table 13.1 offers some idea of the possible magnitudes of such future events. It is quite sobering to recognize that even if we, as a global society, are able to find a way to avoid the use of weapons of mass destruction, we still will be confronted with the dismal inevitability of naturally occurring catastrophes: perhaps a magnitude 7+ earthquake in Los Angeles or San Francisco; or a drug-resistant plague on the scale of Europe’s Black Death; or an asteroid impact on a densely populated area with a force comparable to that of the Tunguska fireball of 1908.
Catastrophe Examples by Category

Given the low expected frequencies and high expected severities of catastrophe events, our paradigms of risk control and risk finance (see Figures 7.1, 7.2, and 7.3) suggest that governments, insurance companies, and other financial market makers must find ways to: (1) provide appropriate economic incentives to mitigate severities; (2) allocate sufficient capital to support meaningful levels of risk transfer for catastrophe exposures; and (3) price the relevant risk-transfer products. To understand and address these problems, practitioners need common and credible methodologies for forecasting the relevant frequencies and severities. Unfortunately, such techniques do not yet exist.
False Choices
Over the past decade, the most studied and discussed potential source of catastrophe risk undoubtedly has been global climate change (GCC). Currently, many government officials around the world believe that GCC has been (at least somewhat) responsible for recent increases in both the frequency and severity of hurricanes and that potential longer-term effects—including massive flooding of populated areas, devastating droughts, etc.—may be even more ominous. Coordinated efforts to mitigate these potential problems have focused primarily on international agreements for reducing carbon emissions, such as the Kyoto Protocol. Although the subject of GCC is much too large to be treated in any depth here, I do wish to make use of this topic to illustrate how a tendency to oversimplify conclusions from scientific research can be counterproductive.
Certainly, no political question related to GCC could be more fundamental than the economic bottom line: What is the greatest percentage, X, of your disposable income that you would be willing to sacrifice on an ongoing basis as part of a government-mandated effort to mitigate the effects of GCC? For myself, as a fundamentalist Bayesian unafraid of quantifying all of the necessary (but incredibly vague and ill-defined) probabilities underlying such a calculation, X would be about 5. That is, I would be willing to give up about 5 percent of my disposable income throughout the foreseeable future to help stabilize and reduce the record-high proportions of greenhouse gases in the planet’s atmosphere.
Although I am unaware of any comprehensive surveys of the general taxpaying population, I suspect (again, with the boldness of a literalist Bayesian) that 5 percent is somewhat higher than the average value of X that U.S. citizens would offer if asked.4 In fact, I would guess that many individuals (perhaps at least one in three) would offer an X of 0 and would be quite irritated at my suggestion that the government mandate a reduction of 5 percent of everyone’s disposable income. I also would guess, however, that a small, but not insignificant proportion of Americans (say, one in twenty) would be willing to give up at least 10 percent and would look upon my meager 5 percent with a certain degree of scorn. The interesting thing is that it is quite easy to generate a prior distribution over the values of X to be offered, but incredibly difficult to anticipate the thought process underlying any individual’s particular choice of X.
For example, if I were to consider a person selecting X equals 0, I might assume that he or she is skeptical of the theory of man-made GCC and therefore sees no reason to mitigate something that is not a problem. However, there are other perfectly good explanations that should be considered, including the possibility that the person is totally convinced of man-made GCC, but believes either: (1) that it is too late to stop the process; or (2) that the outcome of the process will be generally positive (either for himself/herself or the world as a whole). In a similar way, I might assume that a person selecting X equals 10 is totally convinced of man-made GCC, whereas the true explanation may be that the person is convinced of GCC, does not believe it is man-made, but nevertheless believes that some actions should be taken to mitigate it.
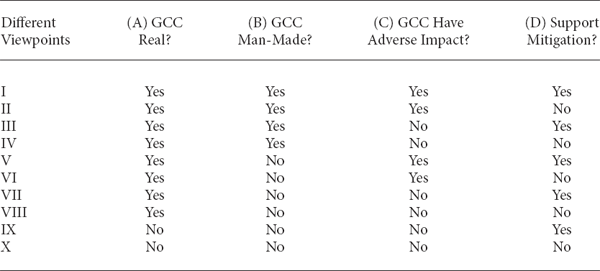
In short, the political discourse on GCC is far from a bilateral issue setting “believers” against “nonbelievers.” Rather, it is a multilateral issue on which an individual can possess one of a variety of highly nuanced positions. To give some idea of just how many sides there can be in this debate, consider the set of all possible “Yes/No” answers a person could give to the following rather simple questions:
(A) Do you believe GCC is a real phenomenon? [If “No”, then skip to question (D).]
(B) Do you believe GCC is man-made?
(C) Do you believe GCC will have a major adverse impact on the world?
(D) Do you support allocating substantial resources to mitigate potential adverse effects of GCC?
As shown in Table 13.2, there are ten distinct viewpoints that a person could have based upon nothing more than the “Yes/No” answers to the above questions. Naturally, some of these viewpoints are much more common than others. For example, it would be easy to find individuals espousing viewpoints I or VIII in the general U.S. population, whereas viewpoint II would be fairly rare. What is particularly important about the list is that there are several very reasonable viewpoints that do not fit comfortably within the common “believer/disbeliever” dichotomy of political discourse. Specifically, not everyone who answers “Yes” to question D necessarily answers “Yes” to question C, and not everyone who answers “Yes” to question B necessarily answers “Yes” to question D.
As an example, I would confess to being an adherent of viewpoint III; that is, I believe that GCC is man-made, am somewhat skeptical that it will result in a major adverse impact on the world in the long run, but believe that something should be done to mitigate its effects. More specifically, I suspect that on the whole there may well be more positive long-term effects of GCC (such as extended farming seasons for Canada and Russia, a permanent northwest passage from the Atlantic Ocean to the Pacific Ocean, and greater access to offshore oil drilling in the Arctic Ocean) than negative long-term effects,5 but I am sufficiently risk averse not to want to expose the world to the potential downside risk of unchecked greenhouse-gas production. Given this particular viewpoint, I find much of the political discussion of GCC to be excessively shallow.
Possible Viewpoints on Global Climate Change
Rather than oversimplifying the available scientific evidence to force a logical equivalence between particular beliefs (such as “GCC will have a major adverse impact”) and support for particular actions (such as “allocating substantial resources to mitigate GCC”), politicians and government officials should work to build consensus based upon a clear and impartial analysis of the risks involved. Although it may be unrealistic to expect the political discourse to address detailed analyses of each of the vast number of possible long-term consequences of GCC (positive and/or negative), it does seem reasonable to expect those attempting to form a coalition in support of mitigation efforts to consider that their allies are not just those who answer “Yes” to questions A, B, and C above. Asking people to choose between support for allocating substantial resources to mitigate GCC, on the one hand, and disbelief that GCC will have a major adverse impact, on the other, is to present them with a false choice.
Black Boxes
Naturally, the problem of forecasting catastrophe frequencies and severities is even more challenging than that of analyzing their historical relationships with various factors, meteorological or otherwise.6 For such forecasting, governments, insurance companies, and other market makers typically rely on highly specialized catastrophe risk-analysis firms.7 These firms’ predictions are based upon statistical extrapolations from complex engineering, geological, and meteorological models, as well as judgmental forecasts offered by experts in the areas of natural, accidental man-made, and intentional man-made catastrophes. Unfortunately, these forecasts are generally available only as “black-box” calculations; that is, the details of the underlying methodologies remain unpublished because of proprietary business concerns.8
I must admit to being somewhat skeptical of black-box forecasts. No matter how experienced or intelligent the individuals generating a prediction, they cannot escape the possibility of gross errors and oversights—some of which may have a significant impact on forecast magnitudes. Therefore, the absence of broad outside evaluation or oversight is necessarily troubling.
This does not mean that all black boxes are bad. I am quite comfortable relying on a vast array of high-tech gadgets—everything from CAT scanners to television sets—about whose inner workings I have little detailed understanding. However, my willingness to rely on such devices is directly related to the amount of empirical evidence supporting their efficacy. For example, I find the images of current events relayed by television useful because of the medium’s long successful track record. But before purchasing a similar device purporting to provide images from the spirit world, I would require extensive corroboration by impartial sources of the seller’s claims.
The problem with black-box catastrophe forecasts is the absence of both extensive validating data and impartial peer review. Fortunately, both of these issues may be addressed; the former simply by comparing the black-box forecasts with a naïve alternative, to ensure a basic reality check, and the latter by insisting that this comparison be done by an independent party.9
Hurricane Forecasting
To see how this approach would work, I will now consider some historical forecast data from one of the most publicly discussed (and therefore virtually transparent) black boxes in the catastrophe field: the hurricane prediction methodology of Colorado State University researchers William Gray and Philip Klotzbach.
Since 1984, Gray has employed a complex meteorological and statistical model of global weather patterns to make forecasts of the numbers of (named) tropical storms and hurricanes of various categories originating in the Atlantic Basin.10 He was joined by Klotzbach in 2001. Prior to each year’s hurricane season, the two scientists make several forecasts, typically in early December, early April, and late May/early June. For the purposes at hand, I will focus on the Gray-Klotzbach (GK) December predictions of the total number of hurricanes for the 19 years from 1992 through 2010.11 These forecasts are presented in the second column of Table 13.3.
Using a term familiar to financial investors, the GK forecasts may be said to derive from a rigorous fundamental analysis of numerous prevailing meteorological conditions (comparable with the firm characteristics and market conditions considered in a fundamental analysis of stock prices). To offer a simple reality check of the value of these forecasts, I will provide a naïve technical analysis of the complete set of historical hurricane frequency data compiled by the National Hurricane Center (see Figures 13.1 (a), (b), and (c)), and use this technical analysis to generate a set of competing forecasts for 1992 through 2010. This latter analysis is identical to that underlying an annual hurricane forecast that I publish jointly with my wife, Imelda Powers.12
Although somewhat difficult to see from Figures 13.1 (a), (b), and (c), the hurricane frequency series possesses an expected value (average number of hurricanes per year) that increases slightly, but significantly, over time. A simple linear regression of the data against time yields an estimated increase of 0.01 hurricane per year.13 Another characteristic of the time series is that it appears to show serial correlation, as the plot of the points moves up and down more smoothly than might be expected of sequentially uncorrelated observations.
To begin the competing technical analysis, I will place myself in the first half of 1984, at about the same time Gray made his first forecasts, and select a model based upon only considerations possible at that time. To that end, I will use the Atlantic-Basin hurricane data from 1851 to 1983 (i.e., all but the last twenty-seven points in the above figures).
Without descending into the gory details, I would note that a fairly straightforward and conventional analysis of autocorrelation functions suggests a first-order moving average model (MA(1)) in the first differences of the original hurricane series. Checking residuals further suggests including a first-order autoregressive component (AR(1)), which ultimately yields a three-parameter ARIMA(1,1,1) model.14
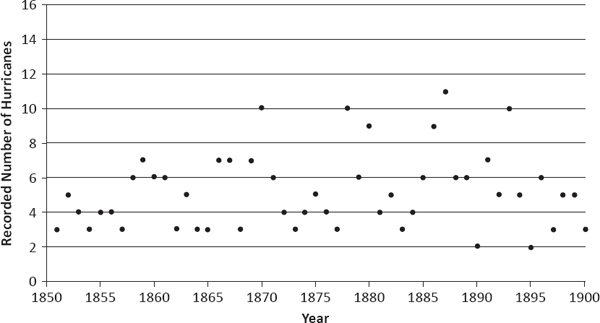
Atlantic-Basin Hurricane Frequency (1851–1900) Source: National Hurricane Center.
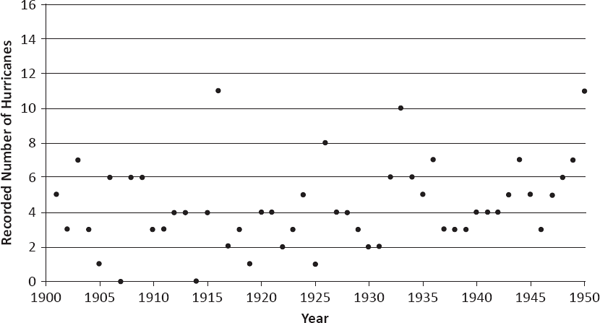
Atlantic-Basin Hurricane Frequency (1901–1950) Source: National Hurricane Center.
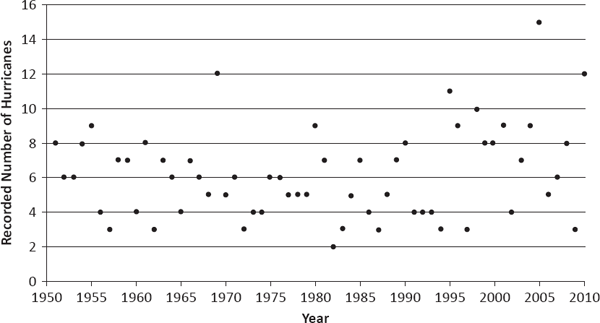
Atlantic-Basin Hurricane Frequency (1951–2010) Source: National Hurricane Center.
Table 13.3 presents a comparison of the GK forecasts with my ARIMA model. For each year, the forecast that is closest to the actual recorded number of hurricanes is indicated by boldface text; if both forecasts are equally distant from the true value, then neither forecast is indicated. Setting aside the latter forecasts, one can see that out of the fifteen years in which one of the forecasts did better than the other, the GK forecast is better six times and mine is better nine times. Intuitively, this seems to suggest the GK methodology is less accurate than the technical analysis; however, a simple hypothesis test fails to show that either set of forecasts is significantly better than the other (at the 5 percent level).15
Although unable to demonstrate the superiority of the GK forecasts over those of a simple technical model, the above exercise is clearly useful. Most importantly, it reveals that the complex GK fundamental analysis does in fact provide reasonable forecasts. As a result, I would argue that whenever confronted with black-box catastrophe forecasts, all parties of interest (insurance companies, reinsurers, rating agencies, regulators, and the public at large) should insist that such forecasts be accompanied by an impartial peer review.
Atlantic-Basin Hurricane Forecasts (Made December of Prior Year)
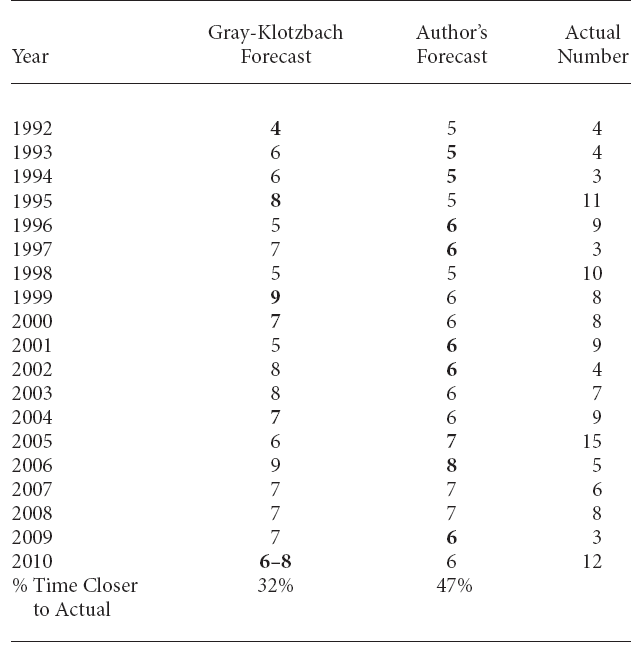
Note: Boldface indicates forecast closer to actual number of hurricanes.
Sources: National Hurricane Center; Dr. William M. Gray and Philip J. Klotzbach <http://typhoon.atmos.colostate.edu/forecasts/>; the author’s calculations.
Terrorism Forecasting
In the aftermath of the September 11, 2001, terrorist attacks, the U.S. insurance industry confronted billions of dollars in unanticipated losses. In addition, major global reinsurers quickly announced that they no longer would provide coverage for acts of terrorism in reinsurance contracts. Recognizing that historical loss forecasts had failed to account sufficiently for terrorism events and facing an immediate shortage of reinsurance, many U.S. primary insurance companies soon declared their intention to exclude terrorism risk from future policies. This pending market disruption led the U.S. Congress to pass the Terrorism Risk Insurance Act (TRIA) of 2002 to “establish a temporary federal program that provides for a transparent system of shared public and private compensation for insured losses resulting from acts of terrorism.” Subsequently, Congress passed the Terrorism Risk Insurance Extension Act (TRIEA) of 2005, which was similar (but not identical) to the TRIEA.16
From the U.S. Treasury Department’s perspective, the TRIA was intended to provide protection for business activity from the unexpected financial losses of terrorist attacks until the U.S. insurance industry could develop a self-sustaining private terrorism insurance market. However, during the debate over the TRIEA, representatives of the U.S. property-liability insurance industry argued that the industry lacked sufficient capacity to assume terrorism risks without government support and that terrorism risks were still viewed as uninsurable in the market.
Given that the TRIEA was extended for a further seven years at the end of 2007, the debate over the need for a federal role in the terrorism insurance market is far from over. Although the federal government does not want to serve as the insurer of last resort for an indefinite period, it is clear that there are major obstacles to developing a private market for terrorism coverage.
Certainly, no category of catastrophe risk is more difficult to assess than the threat of terrorism. In addition to many of the ordinary random components associated with natural and unintentional man-made catastrophes, one must attempt to fathom: (1) the activities of the complex networks of terrorists; (2) the terrorists’ socio-psychological motives and objectives; and (3) the broad range of attack methods available to the terrorists.
Despite these difficulties, it is possible to transfer or finance losses associated with terrorism risk. In the United States, private insurance markets for this type of risk existed before the events of September 11, 2001, and they exist today, albeit with government support under the TRIEA. Even without government support, markets for terrorism risk would exist as long as insurance companies believed that total losses could be forecast with reasonable accuracy.
Central to this requirement is that the underlying frequency and severity of terrorism losses not be perceived as fluctuating wantonly over time. To this end, the current state of risk financing has been assisted by two significant developments: (1) the lack of a substantial post-September 11 increase in the frequency of major terrorist attacks (outside of delimited war zones); and (2) the emergence of sophisticated models for forecasting terrorism losses by commercial risk analysts that, for the moment, afford market experts a degree of comfort in the statistical forecasts.
At the simplest level, the probability of a successful terrorist attack on a particular target may be expressed as the product p1 × p2 × p3 × p4, where:
p1 is the probability that an attack is planned;
p2 is the conditional probability that the particular target is selected, given that an attack is planned;
p3 is the conditional probability that the attack is undetected, given that an attack is planned and the particular target is selected; and
p4 is the conditional probability that the attack is successful, given that an attack is planned and the particular target is selected and the attack is undetected.
The first of these four probabilities is essentially the underlying probability of terrorist action during a given time period. In a catastrophe risk analyst’s model, this probability is generally captured by an overall outlook analysis for a particular future time period. Unfortunately, the other—and more complex—probabilities are not handled so transparently. In fact, it could reasonably be said that the methods used to calculate p2, p3, and p4 are buried deeply within one or more black boxes.
Essentially, the catastrophe risk analyst develops estimates of these last three probabilities by intricate processes combining the judgmental forecasts of terrorism/security experts with the results of complex mathematical models. In some cases, the risk analyst may employ techniques from mathematical game theory (a subject to be discussed at some length in Chapter 15). Regrettably, the largest parts of these estimation techniques remain unpublished and untested, primarily because of proprietary concerns.
In a global economic culture that praises the virtue of transparency, it is rather unsettling that both rating agencies and regulators routinely countenance the use of unseen and unproved mathematical methods. Can one seriously imagine a modern patient going to the doctor for an annual checkup and accepting a diagnosis based upon a battery of secret, proprietary tests? Unless the black boxes obscuring terrorism forecasts are removed and the market’s confidence justified for the long term, one thing is clear: The next major terrorist attack may not only destroy its intended target, but also seriously damage the private market for terrorism coverage.
ACT 3, SCENE 3
[Same police interrogation room. Suspect sits at table; two police officers stand.]
GOOD COP: Ms. Cutter, you can save your talk about literal and figurative killing for the judge and jury. For now, I’d like to focus on real facts—real statistics.
SUSPECT: That’s certainly your prerogative, Officer.
GOOD COP: You stated that you selected the twelve victims at random from the entire population of Pennsylvania. Could you tell us more precisely how you did that?
SUSPECT: Well, as I already mentioned, a death rate of less than 1/1,000,000 is considered negligible. So I began by dividing the state population—about 12.5 million—by 1 million and that yielded a number close to 12.5. I then rounded down to the nearest integer, because—as you know, Officers—people are best counted in integers. The next step was to select exactly twelve individuals from the most recent census list, which I did with the help of my computer. Of course, those individuals had to be selected randomly; so I first assigned each individual his or her own number—from 1 to about 12.5 million—and then asked my computer to select exactly twelve numbers, one after the other, from the complete list.
BAD COP: Aha! But what did you do if your computer selected the same number twice?
SUSPECT: Well, fortunately, that didn’t happen. But if it had, I was prepared for it. I simply would have thrown out the duplicate number and selected a thirteenth to replace it. That’s a common statistical practice.
GOOD COP: So then, to summarize, your selection process was constructed to choose exactly twelve—no more and no fewer—individuals.
SUSPECT: That’s correct.
GOOD COP: But don’t you realize that your selection process, albeit somewhat random, is entirely different from the random processes covered by the concept of negligible risk? When a business releases toxins into the environment with a death rate of 1/1,000,000, that doesn’t mean that exactly one person out of every million will die. What it means is that on the average, one person out of every million will die. In fact, it may happen that no one dies, or that everyone dies, depending on chance.
SUSPECT: I see where you’re going with that, Officer, and I commend you for your insight. However, I’m afraid that you’re wasting your time. You see, the people who make and implement the laws and regulations regarding negligible risk have no appreciation for the subtlety you’re describing.
GOOD COP: And just how do you know that?
SUSPECT: Well, I don’t think it would be bragging to say that I’ve done substantial research in the area. A close reading of the guidelines for environmental impact statements, for example, makes my point abundantly clear.
GOOD COP: [Suddenly smiles.] Oh, that reminds me of something that’s been nagging me all along, Ms. Cutter.
SUSPECT: Yes, Officer?
GOOD COP: With what federal or state agencies did you say you filed your environmental impact statements? That is, after you determined that your so-called business would cause a death rate somewhat below the 1/1,000,000 threshold, to which agencies did you report your assessment?
[Cutter rubs forehead and looks worried, but says nothing.]
BAD COP: Go ahead, Cutter, answer the question.
SUSPECT: I’m afraid you’ve got me on that one, gentlemen.
GOOD COP: Yes, apparently.
SUSPECT: And do you find it satisfying, Officer, to defeat a woman on the absence of some trivial paperwork? To prevail on a mere legal technicality?
GOOD COP: That depends, Ms. Cutter. Are you speaking literally or figuratively?