Chapter 16
Cisco DNA Analytics Components
Chapter 15, “Introduction to Cisco DNA Analytics,” presented Cisco DNA analytics as a key building block of Cisco Digital Network Architecture. Now let’s examine the different elements of Cisco DNA Analytics.
This chapter explains:
The sources of useful analytics information
Instrumentation
Distributed network analytics
Telemetry and analytics engine
How these components come together to form a complete solution
Analytics Data Sources
Analytics is about data. Data is defined as any valuable information carried by the network, such as
User context
Device and application information
Network device–related data
Environmental information from sensors
The data may be consumed by multiple “users”: network administrators for monitoring, application developers, etc.
When considering Network Analytics, data is gathered from different sources; potentially everything that connects to the network is a source of information, as represented in Figure 16-1.
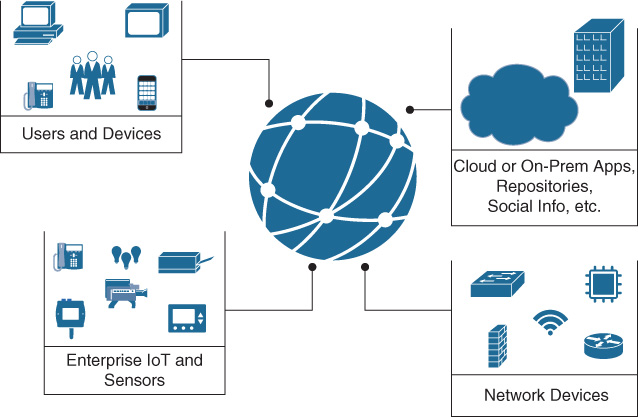
Network elements, sensors and Internet of Things (IoT) devices, servers and related applications (on premises and/or in the cloud), and user identity servers and external repositories are only a few examples of possible data sources for Analytics.
Analytics is about collecting information and correlating it to obtain additional insights. Each data source shown in Figure 16-1 brings a lot of information independently, but imagine the added value that could be gained by correlating them. For example, what if you could leverage an external repository like the Cisco Technical Assistance Center (TAC) database to compare known customer issues with the actual network devices’ configuration and topology? This analysis could show inconsistency of a feature implementation and point out hardware or software incongruencies.
Another simple example of the value of correlation is that users’ traffic data can be related with the information gathered from the policy server (such as Cisco Identity Services Engine) to add a user context to the traffic profile and answer questions such as “Who is consuming all my expensive WAN bandwidth at my branch location?”
The challenge of dealing with multiple sources is multifold. First, you need to cope with the large amount of data that these sources may produce and that could saturate a low-bandwidth WAN link (think about a remote location) and/or stress the CPU and memory resources of the collecting platform. Second, this data usually comes in multiple different formats, so it’s not easy for the collectors and applications to consume it and extract valuable information. Additionally, all this data arrives at different time intervals; it’s not synchronized, which makes correlation even more challenging.
This is a typical “big data” problem, but before diving into the different aspects of scalability (covered later in the “Telemetry” section), let’s first focus on accuracy as another critical aspect of dealing with data. The information collected from the network needs to be accurate if you want to base business decisions on it. So the first step for Cisco DNA Analytics is to make sure that the right information is extracted from the network devices. This is what Instrumentation is all about.
Cisco DNA Instrumentation
“Not everything that counts can be counted and not everything that can be counted counts.” This simple quote from Albert Einstein explains why Instrumentation is a key aspect of the Cisco DNA Analytics solution.
Instrumentation is defined here as the process of extracting the relevant data from the network and making it available for further analysis.
Networks offer rich sets of telemetry data that include the following:
NetFlow records
Device statistics (CPU and memory utilization, interface counters, etc.)
Simple Network Management Protocol (SNMP) data
Internet Protocol Service Level Agreement (IP SLA) performance measurements
System event (syslog) records
Collecting data from the network is not the hard part. Making use of it, doing something interesting with it and gaining insights, is more challenging. In other words, how do you go from data to information, and then to knowledge?
Imagine you are gathering analytics on a wireless network. Most of the management tools available in the market provide information such as top access points in terms of client count, the so-called “hot zones.” That’s important information, but what about “cold zones,” or wireless access points (AP) that are indicating zero clients associated while historically they were serving users normally? Which information would be more indicative of a problem in the wireless network? Probably it’s the latter because it can indicate that something is wrong with the AP’s radios. The point is: you need to make sure you get the right information, the information that counts.
Gathering data can be expensive in terms of local resources on the network device (mainly CPU and memory) and bandwidth consumption to transport the data to a remote destination for further analysis. So you cannot simply take all the data; it would be too much.
What’s then the real meaning of “extracting the relevant data” in the Instrumentation definition? Mainly two things:
Information accuracy and relevancy: The data needs to show what you, as network administrator or data analyst, are looking for.
Efficient transport: Simply put, the collection process should neither overwhelm the device nor saturate the uplink to the centralized collectors.
Imagine polling some interface statistics on a router through a SNMP Management Information Base (MIB). What is the right polling interval? Is it five minutes, one minute, or one second? If you are looking for information on a stable network, a five-minute interval probably is a good compromise in terms of getting an average view of the network without stressing the device. Sometimes, though, you need to poll every few seconds to really catch what’s going on. Setting the right polling interval greatly influences the accuracy of the information gathered and the ability to transport that information.
A big focus of Cisco DNA Instrumentation is making sure that the information needed is available through software and represented by some sort of counters. This is key because you cannot measure what you don’t see. Cisco expertise in networking comes as an added value here: Cisco designed and implemented most of the protocols that run today’s networks and hence Cisco more likely knows what is the relevant data and where to find it.
Finally, Instrumentation is greatly improved with Cisco hardware programmability. As explained in Chapter 13, “Device Programmability,” if the network device leverages programmable application-specific integrated circuits (ASIC) such as the Unified Access Data Plane (UADP) ASIC, then Instrumentation can change and evolve over time. This means that, if needed, a new piece of information or parameter is extracted at the hardware level for further software processing without requiring hardware respin of the ASIC. This is also a great investment protection story.
Distributed Network Analytics
Traditional analytics involves hauling large amounts of data to a back end, where that data is analyzed and processed. In general, the larger the volume the better, as more data may yield more insights than less data. This is the reason why, in recent years, much of the research and development in analytics have been focusing on making sure the back-end infrastructure scales well and can keep up with large volumes of data; important tools have been made available to address the scalability challenges of the back-end platforms, the so called big data technologies, which include Map Reduce algorithms, Hadoop, and Hive, for example.
Something is changing in the way network information is produced and analyzed, and today the focus of analytics is on optimizing the data collection, processing, and transmission of data. If you think about it, in an enterprise lots of data originates directly on the network devices that connect IoT sensors, video cameras, or other end users’ devices. Considering where the data is generated, the edge of the network, and where data is processed, usually servers in a data center, the traditional analytics approach of sending all possible information to a centralized location is probably not the most efficient approach.
If you are generating data within the data center, it is absolutely valuable to also process it directly there. But in the enterprise, data generation is much more distributed at the edge of the network and may include remote locations; in this case, the approach of distributing some of the analytics functions is much more effective.
With distributed analytics, the idea is to perform the right amount of processing and analysis where it makes more sense. Instead of relying on data generated and collected from many devices and locations to be made centrally available for processing, part of the analytics is performed right at the edge of the network, closer to the source. This is more efficient for multiple reasons:
It may save time because it helps to quickly identify the anomalies as they arise at the edge and enable decisions to be made faster. In situations such as a malware attack where timing is critical, delays caused by centralized processing can cause serious problems.
It saves upstream bandwidth in the transport because the data is pre-analyzed, and instead of sending raw data, the device streams “smart” data in smaller volumes.
It saves money because it optimizes the whole analytics process.
At the time of writing Cisco was actively investing in distributed analytics solutions embedded in the Cisco DNA network as a new and effective way of processing data. An interesting use case for distributed analytics is security and anomaly detection. Malware software is becoming everyday more sophisticated and hence hard to detect with a traditional signature-based approach. Cisco is investigating a solution that uses distributed advanced analytics to model traffic patterns, detect anomaly behavior, and then close the loop with mitigation actions; the whole processing is done right at the edge of the network, without sending all the traffic to a centralized repository for processing.
The idea is to leverage software agents that perform distributed analysis within the scope of an individual networking device or multiple standalone analytics engines. The agent is a piece of software that may run in a container, in a virtual machine (VM), or directly integrated in the Cisco IOS software on the network device as depicted in Figure 16-2.
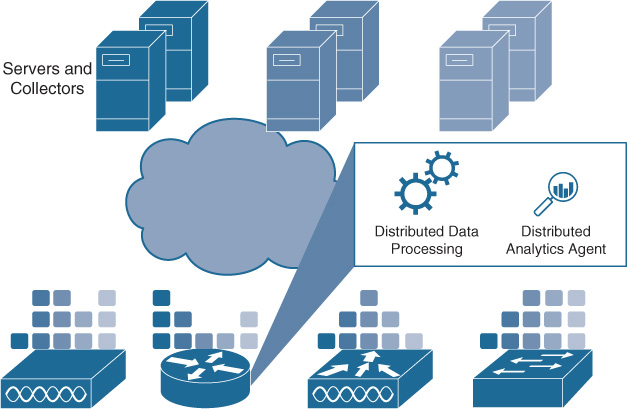
The distributed analytics model may leverage either a dedicated hardware device or a VM/Container that performs a subset or all the following functions:
Data collection: It collects information from multiple local sources such as Cisco NetFlow, Cisco Network-Based Application Recognition (NBAR), local metrics, SNMP MIBs, etc. It dynamically extracts information depending on current network conditions.
Data normalization: As a general design principle, as data is natively represented in different formats by different data sources, it is up to the agent to ensure that the data is rendered and normalized in a way that is easily consumed upstream.
Data analytics: Advanced analytics and machine-learning algorithms may run closer to the network device in order to get the relevant data directly, filter it, and process it in a distributed fashion.
Data actions: As a result of the analytics, traffic can be modified and an action applied directly at the network edge. A typical example is applying quality of service (QoS) policy on certain traffic to provide a specific treatment. This results in traffic getting different priority, as shown with the different shaded coding in Figure 16-2.
Data telemetry: Streaming “smart” data to an upstream collector. The term “smart” is used here to highlight that the data may be pre-analyzed and prefiltered to add context and optimize it, before it is sent to a collector.
What does “dynamically” mean in the data collection process described at the beginning of the preceding list?
Let’s go back for a second to the example about SNMP instrumentation mentioned earlier: choosing the correct SNMP polling interval for a specific interface counter is critical for that information to be relevant. Choosing a large polling interval, such as five minutes, provides an average representation of the behavior of that interface and doesn’t overwhelm the device itself. But what if there is a problem (traffic spike) that happens only for a few seconds: a five-minute interval would average out the results and probably miss the spike. This is graphically represented in Figure 16-3.
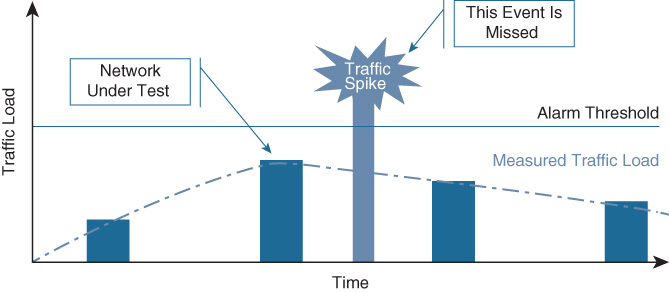
Reverting to one second for the polling interval on all interfaces in your network would most probably kill the boxes, so it’s a no go. So you need to have dynamic thresholds and change them according to network behavior. This is done today in a traditional manner by implementing a combination of SNMP traps and SNMP polling, but it’s not efficient. Polling is not efficient because, again, you need to decide on a polling interval. With dynamic data collection based on a push model, the agent may change the polling interval from a larger default value to a smaller one if some conditions apply (for example, the traffic exceeds a defined threshold on the interface).
Telemetry
Telemetry derives from the Greek words “tele” (= remote) and “metron” (= measure). Telemetry is about data collection and its efficient transport to a remote location.
Telemetry is not new in networking. SNMP has been around since 1998, so for more than 30 years network administrators have been using different types of methods to gather information from the network. Syslog, NetFlow, and so forth are all examples that are referred to as telemetry. Today these traditional approaches have problems keeping up with the scale and speed of modern networks. New approaches such as streaming telemetry are promising to answer today’s challenges. This section first explains the need for telemetry, then describes telemetry in the context of Cisco DNA, highlighting the limitations of traditional approaches, and wraps up by introducing the new Model-driven Telemetry (MDT).
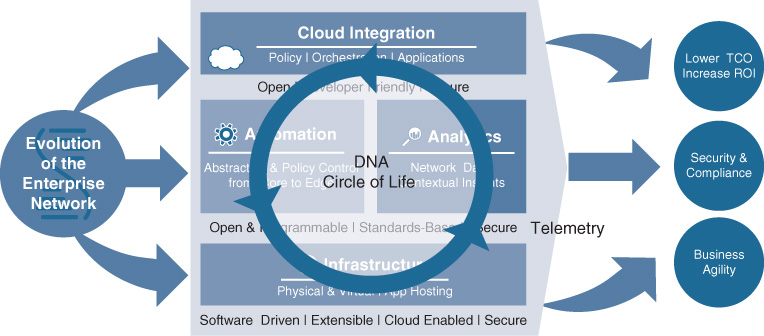
What is the role of telemetry in the Cisco DNA architecture? The Cisco DNA circle of life represents how Cisco DNA brings together automation, analytics, and assurance to provide a closed feedback loop to the customer. The network administrator expresses the business intent; the Cisco DNA controller translates it and deploys it in the network using automation; then Cisco DNA analytics extracts the relevant information from the network and feeds it back to the assurance module to verify that the intent has been met. Telemetry is the component that is responsible for extracting and transporting this key information, as represented in Figure 16-4.
Why Telemetry?
Before getting into the details of the architecture, let’s start by understanding why Telemetry is necessary. Here are few simple questions:
Do people complain about the network and you don’t understand why?
Do you often hear that the network is impacting your organization’s ability to achieve its business goals?
Do you know if the QoS policy you have just applied has actually produced the wanted results?
If you have answered yes to any of these questions, chances are you need a solution to monitor and analyze data from your network. And when it comes to network monitoring, everything is based on Telemetry because the data is generated in the network devices that are usually physically separated from where the information is stored and analyzed.
The Cisco DNA Telemetry Architecture
Figure 16-5 shows a graphical representation of Telemetry architecture in Cisco DNA.
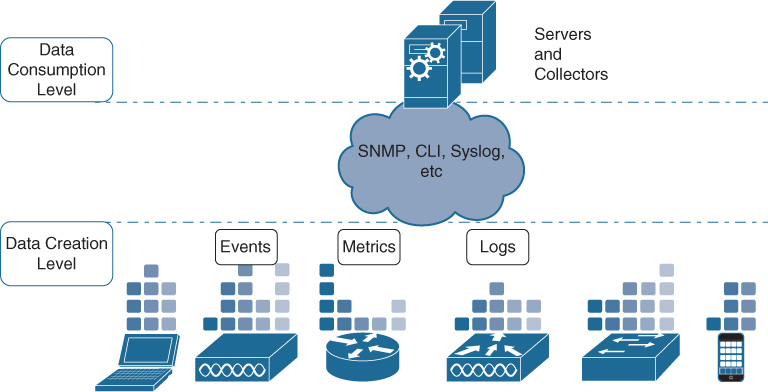
Data is generated at the device level. You can have hardware sensors (network devices or dedicated sensors) or software sensors (software agents on user devices and servers) streaming information to an upstream collector. The information comes in multiple types and formats: events (like the ones generated by SNMP), logs (like syslog or AAA), or metric data (like the different counters on a network device).
On the other end of the network, the data consumption layer is where the telemetry data is actually stored, analyzed, visualized, and used as the basis for meaningful actions; usually there are multiple collectors and servers utilizing multiple types of interfaces/APIs toward the network.
Connecting the two layers, today you have many different ways and protocols that visualize and transport the telemetry data: Command Line Interface (CLI), SNMP, syslog, NetFlow, and Radius, just to mention a few. This is a problem for a Telemetry solution because the upper layer has to deal with multiple data formats, with often-redundant information and with the risk of receiving too much data. Let’s explore some of the limitations of the current protocols and how Cisco DNA Telemetry changes the game in terms of transport efficiency.
Limitations of Today’s Telemetry Protocols
With networks growing in size and complexity, more and more data is generated from the network. So the first challenge for a Telemetry solution is mainly scaling and dealing with the amount of information that needs to be transported.
Most of the protocols today are based on polling mechanisms: the server opens a connection and requests a set of values, and the devices process the request and returns the data. If there are multiple polling servers, multiple connections need to be opened and processed in parallel.
This is exactly how SNMP works: to retrieve large amounts of data, SNMP polling relies on the GetBulk operation. Introduced in SNMPv2, GetBulk performs a continuous “get” operation that retrieves all the columns of a given table (e.g., statistics for all interfaces). The device being queried returns as many columns as can fit into a packet. If the polling server detects that the end of the table has not yet been reached, it does another GetBulk operation, and so on. If you have multiple SNMP servers, the network device has to process each request independently even if both polling servers requested the same MIB at more or less the same time. As you can imagine, this is not optimized from a device prospective and SNMP scale is a known issue.
Another problem is data formats. Not to pick on SNMP, which has been around for more than 30 years and still does the job for most networks, but this is another limitation typical of this protocol.
SNMP imposes a very specific format when it comes to indexing and exporting data. And this model is different from how the information is stored in the network device itself. So for every SNMP call, the device needs to convert the internal data structure into the one used for SNMP. This is highly inefficient and may affect performance when you need to retrieve a lot of data.
Another limitation of traditional approaches comes from the lack of completeness of information: a syslog that misses a key piece of data, a MIB that isn’t complete or available, or a piece of information that is only available via CLI.
Other times the issue is machine-friendliness: CLI and syslog are human-readable strings that are inefficient for any automation software. In other words, many of the protocols used today for getting information out of a device are meant to be used and interpreted by humans; but what is good for humans is usually not good for machines, and this may lead to inefficiencies, especially when you want to retrieve a lot of information.
What if the network device could push telemetry data at a certain interval and could directly transmit the bulk data as stored internally? Add what if the format used was machine-friendly? Cisco DNA Analytics brings a new approach to telemetry called Model-driven Telemetry (MDT) or Streaming Telemetry.
The Evolution of Cisco DNA Telemetry: Model-Driven Telemetry
As networks grow in size and complexity, the demand for monitoring data increases. Whether the goal is better analytics, troubleshooting, proactive remediation, or security auditing, an IT operator needs more and more data quickly from the network.
To respond to these IT challenges, Cisco DNA Analytics adopts a model-driven, streaming approach to Telemetry.
The first challenge is how to get as much data off a network device as fast as possible, in a way that makes consuming it easy. This brings two requirements for Telemetry:
Getting rid of the inadequacies of the polling mechanism, highlighted earlier in the discussion of SNMP.
Using as much raw data as possible and using a standard model-driven data structure. By using its native format, accessing the data is very quick and efficient; by using a model-driven approach, external access to the data is greatly simplified.
Network operators poll for information at regular intervals, so why not just embrace a “push” model and send them the data they need? This is the idea behind the streaming aspect of Telemetry: it’s the device that sends the data to a receiver at regular intervals or upon a triggering event. This is also important to optimize the transmission in presence of multiple receivers; in this case, when requested the same information from multiple servers, the device simply has to duplicate the data and send it twice.
Second, what does Model-driven Telemetry really mean and why is it important? Well, as described in Chapter 12, “Introduction to Cisco DNA Automation,” network programmability is an efficient way to manage the scale and complexity of today’s large networks. Gone are the days when a network engineer can manage the network by typing CLI commands and manually analyzing the results.
Programmability requires the data to be in a machine-friendly format to make it easy for tools to ingest. The good news is that the networking industry has converged on Yet Another Next Generation (YANG)1 data modeling language for networking data, making it the natural choice for Cisco DNA Telemetry.
1 For more info on YANG, see RFC 6020 at https://tools.ietf.org/html/rfc6020.
Model-driven Telemetry leverages models in two ways. First, MDT is fully configurable using telemetry YANG models. You can turn it on, specify where to stream, and specify with what encoding and transport mechanism to stream, all by using just YANG models (no CLI required).
Also, MDT leverages YANG in the specification of what data to be streamed: the network device measures a staggering number of parameters all the time, so how do you tell which subset you want? When working from the CLI, you have to use memorized show commands. With SNMP, you request a MIB. With MDT, you specify the YANG model that contains the preferred data.
Also, as Cisco DNA moves to an automated and centralized control approach of managing networks, there is the need for a lot of information to be sent upstream so that the Cisco DNA Controller can make informative decisions. This means that telemetry is becoming a big data problem. So, in addition to being fast and comprehensive, telemetry data must be tailored to the needs of big data analytics tools.
For this reason Cisco DNA Telemetry adopts well-known encoding technologies like JSON and Google Protocol Buffers (GPB) to transfer data to software applications and make it easy for them to manipulate and analyze the data.
Is streaming telemetry going to replace traditional approaches? There is probably room for both as some data lends itself well to telemetry-based models while other data is still well suited to an occasional poll-based model. Interface counters, interface rates, and other traffic-based info are a good fit for a push model because a real-time view of the environment is critical in this case. Physical device metrics, such as temperature and power, could be poll based. The key to Telemetry is to provide relevant data without overwhelming the devise and the network link to the collector, and that’s what Cisco DNA Analytics is focused on.
In summary, Cisco DNA embraces programmability and Model-driven Telemetry as a building block of the architecture blueprint, and this is an important and clear indication for new product development across routing and switching wireless. Is MDT adopted across all the Cisco products? There are a lot of existing devices out there that do not support YANG models and telemetry, so the traditional approach not only is still valid but is the only option that you have. Cisco DNA is an architecture that brings value not only in greenfield environments but also in existing customers’ networks where you still need to enable traditional telemetry via syslog, SNMP, NetFlow, and so forth to get the information you need. In this case the focus of Cisco DNA is to make Telemetry more efficient, and that’s one of the main reasons for introducing an Analytics Engine.
Analytics Engine
The Analytics Engine is a critical building block of the Cisco DNA Analytics architecture. This section describes the role and functions of the Analytics engine as a big data platform, while Chapter 17, “Cisco DNA Analytics Engines,” details the two Cisco Analytics engines: Cisco DNA Network Data Platform for the enterprise and the Tetration Analytics platform for the data center.
The Traditional Analytics Approach
Analytics is not new in networking; IT administrators have long been using multiple tools and applications to collect and analyze data to gain some sort of insights from their network. Figure 16-6 illustrates a traditional architecture for Analytics.

A traditional approach to Analytics is characterized by the use of different protocols to transport data back to multiple servers and collectors residing either on premises or in the cloud (public or private). Northbound of the collectors you usually have a series of independent monitoring, security, and management applications that access the data through different interfaces. This architecture presents multiple limitations. Let’s describe a few and introduce how an Analytics Engine can make the solution much more efficient.
One of the most important shortcomings of a traditional approach is around Telemetry and it’s due mainly to two factors:
Inconsistency of data export: Many protocols are used (SNMP, NetFlow, syslog, etc.), each with a different data format. This makes it harder to use the data across different platforms and correlate them.
Inefficiency of transport protocols: As described earlier in the “Telemetry” section, traditional telemetry protocols such as SNMP are based on a pull mechanism that limits the scalability and the performance of these protocols.
Another problem is related to the fact that in traditional analytics, applications and tools usually live in silos. This means that if you need a comprehensive view of your network, including devices and application performance, security information, and user insights, you probably have to deal with a lot of different dashboards. This makes it very hard to cross-correlate information and also adds operational cost of deploying and managing multiple independent systems.
Last but not least, the data sets that can be retrieved from a traditional system are usually preset and static, with little or no possibility for cross correlation. This truly limits the amount of business insights gained from the network data. Think about it: it’s one thing to get the information about a particular flow from a NetFlow collector; it’s a completely different story to able to identify the user and the application that generated that flow and the time and location where it was generated. Adding contextual information leads to more insightful business decisions.
How to make Analytics more efficient? Fix the data by providing the analytics tools and applications with data that is normalized, deduplicated, and correlated. In other words, analytics needs high-quality data, and providing that is the role of the Analytics Engine.
The Need for Analytics Engines
An Analytics Engine is a big data platform that provides high-quality and contextualized data to northbound applications. This allows the transformation of raw network data into knowledge and business insights. Figure 16-7 shows a high-level representation of the Analytics Engine interactions with the other solution components. “Analytics App” refers to any network management, IT service management, or assurance application that leverages the analytics data from the network.
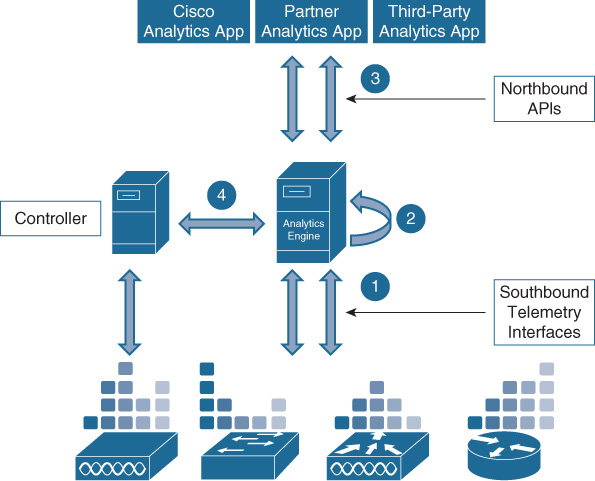
This simple diagram explains the main functions and architecture relationships of the Analytics Engine:
Gathers Telemetry data from multiple sources (network devices, sensors, user devices, servers); it does so by abstracting the telemetry operation from the underlying network elements via southbound interfaces.
Normalizes the information, as it may come from multiple sources using different formats.
Correlates data to extract and presents meaningful insights about the networks, its applications, and its users. This process may leverage machine-learning algorithms.
Exposes Analytics information to Cisco and third-party applications and tools via APIs.
May also communicate directly the Controller to receive information on the network (topology, for example) and to automate recommended data-driven decisions.
Leveraging the preceding functionalities, the Analytics Engine provides the following advantages to an Analytics network solution:
Data scalability
Analytics efficiency
App development simplification
Data Scalability
With today’s scale and performance, monitoring and controlling the network requires more and more data. Also, IT is being asked to increase the speed of service deployment and associated infrastructure changes; Automation plays a big role in making networks simpler to deploy and let IT focus on services and the business intent. The shift to a centralized and automated control of the network, though, requires accurate information. IT needs visibility end to end and the telemetry from network devices, sensors, and user devices can easily overwhelm traditional data warehouses; again, this translates into more data. That’s the reason why scaling of the back-end systems is a major concern of Analytics.
The Analytics engine solves the scaling problem because it is built upon big data technologies like Hadoop, Hive, Kafka, and others that allow the platform to ingest data at a fast rate, to store it at a very granular level, and to efficiently present it to the upper application layer.
From an architecture point of view, the Analytics Engine can leverage the cloud to scale horizontally or use a distributed approach where the Analytics functions are deployed in multiple places in the network, closer to the data sources. Chapter 17 introduces the Cisco DNA Analytics platforms and covers the analytics engine architecture in more details.
Analytics Efficiency
The second advantage of leveraging an analytics engine is efficiency. Current analytics solutions are very fragmented and live in silos. The result is that collecting all the required data and extracting useful information is very difficult and inefficient.
First of all, the Analytics Engine needs to provide telemetry efficiency. As described in the previous sections, telemetry data is generated from multiple sources, leveraging different protocols and different formats, and information is often redundant because the same parameter is transported multiple times.
The Analytics Engine is the component that filters data to reduce the redundant information, normalizes the data to a common format based on a model-driven approach, and stores the data in a way that is much more efficient to either retrieve it for further processing or to present it to upper layers.
The Analytics Engine also increases the effectiveness of the analytics solution by enriching the value of the information and providing more quality data. This is performed with the following:
Data correlation: The analytics engine receives information from multiple sources and is the ideal component to cross-correlate this data to gain additional insights. If you want to correlate flow information with user data, you must access multiple tools and perform the correlation manually.
Contextual metadata: The analytics engine may add contextual information from many different sources, such as user and location databases and external repositories, in the form of metadata.
Cognitive analytics: The analytics engine runs sophisticated machine-learning algorithms that first draw a baseline of the network behavior and then may predict and anticipate possible problems or anomalies.
Application Development Simplification
Analytics developers struggle to get the information that they need from the network. The data is fragmented, exposed through various protocols, in different formats, and requires the data analyst to have a deep network knowledge that is often unavailable.
The role of the Analytics engine is to abstract all the underlying network details and provide a simplified and normalized access to network data through openly defined APIs. In this way the developer or data analyst doesn’t need to spend time and resources to know the topology of the underlying network or decide what protocols to use to retrieve the necessary information.
An Analytics Engine allows simplification of the development process and hence fosters innovation at the application and service levels.
The Role of the Cloud for Analytics
The cloud (either public or hybrid) is an integral part of Cisco DNA and provides a deployment option for many Cisco DNA functions. Chapter 11, “Cisco DNA Cloud,” introduces the cloud as a component of Cisco DNA and describes in details, the cloud service models, the deployment mode, and how Cisco DNA considers the cloud one of the network domains. This section specifically describes how the cloud plays a critical role for analytics.
Running the analytics engine in the cloud brings multiple advantages to analytics both in terms of streamlining operations and providing deeper insights. The advantages include the following:
Scale and performance: The analytics platform needs to accommodate vast amounts of data, and a cloud model makes it easier to add storage or computing resources to scale horizontally or to increase performance.
Historical data and trends: More scalability means being able to store more data and for a longer period, which is critical in order to produce meaningful reports and provide the baseline trends.
Painless upgrades: As enterprise customers are looking at developing Analytics in the cloud, this approach usually provides a simpler way to do software and hardware upgrades when compared to an on-premises distributed system. This is simpler because of the automation and orchestration tools that are used to build a cloud service.
High Availability: Similarly, running a platform in the cloud makes it easier to add physical and virtual redundancy to increase the service uptime.
Effective correlation: Converging more data sources and information into a centralized location brings the possibility of performing more insightful correlation. Think about a cloud-sourcing analytics approach that compares telemetry data from a specific location (for example, “client authentication failures”) with other locations in your company; the comparison adds context to the information and helps the network to make the right decision regarding whether to further investigate or categorize it as “Normal” behavior.
Extensibility: Running the analytics engine in the cloud also enables the inclusion of data sources from other domains (like third-party engines, applications, and repositories), offering an interesting aspect of extensibility.
Many applications benefit from the advantages of moving workloads to the cloud. For Analytics, being so data and resource intensive, the scalability and flexibility you gain makes the decision of adopting the cloud a natural and easy one.
But, to be fair, working with the cloud poses some challenges in terms of security and data privacy that may prevent or delay customer adoption. Cisco DNA architecture provides ways to adopt the cloud without compromising the security and confidentiality of your data. In the specific case of Analytics, Cisco DNA provides a solution for Cisco DNA Spaces and Assurance, just to mention two cloud-enabled services, to securely transport a big quantity of data from your network to the Cisco cloud. It does this by encrypting the communication between the on-premises collector and the data ingestor in the cloud, but also by anonymizing the data before sending it. The data is then processed and analyzed in a completely anonymous way in the cloud, and the results of the analysis are transported back to the customer network and de-anonymized before showing it to the data owner, the customer. More details are provided in Chapter 11.
Summary
The chapter introduced the main components and features of the Cisco DNA Analytics solution, which include the following:
The variety of analytics data sources
Instrumentation and the importance of extracting the relevant information from the network
Distributed network analytics as a new approach to analytics
Telemetry, the limitation of current approaches and the advantages of Model-driven Telemetry
The role and benefits of the Analytics Engine
The role of the cloud in Analytics
Further Reading
YANG RFC: https://tools.ietf.org/html/rfc6020
Cadora, S. “What’s So Special About Model-Driven Telemetry?” Cisco Blog. Aug. 24, 206. http://blogs.cisco.com/sp/whats-so-special-about-model-driven-telemetry.
Vasseur, JP. “Internet Behavioral Analytics (IBA) Using Self Learning Networks.” 2015 Cisco Live. https://clnv.s3.amazonaws.com/2015/usa/pdf/BRKSEC-3056.pdf.