Chapter 17
Cisco DNA Analytics Engines
What do most of the IT network managers have in common today, besides the need for more people and a bigger budget? They all want to extract more data from their network and they need more information on what the network transports. And they want it faster.
The use cases for network analytics and extracting useful insights from the network are not significantly different from 20 years ago when the IT manager started using tools like Simple Network Management Protocol (SNMP). Network analytics can help with
Monitoring the network health
Troubleshooting user and application issues
Performance tuning
Capacity planning
Security analysis and prevention
But a few things have changed dramatically when it comes to gathering data from the network in the recent years:
The speed at which the information is needed, going from “some” minutes interval to real time; this has to do with the velocity of application deployment and associated infrastructure changes as well as the need to protect those applications and the associated business data against a rapidly evolving set of security threats.
The scale of the problem. Today’s networks are more and more complex and connect an ever-increasing number of devices and “things” that generate an ever-increasing amount of data. And this is only going to get more interesting with the adoption of the Internet of Things (IoT).
The trend toward software-defined networking; in other words, the need to export accurate information in a centralized place where the analysis takes place and decisions are made.
So, it’s easy to understand how in the recent years network analytics has become a “big data” problem. You need that back-end infrastructure to scale horizontally and dynamically so that you can store and process huge amounts of data. Previous chapters examined how technologies such as Hadoop, Hive, Kafka, and other open source frameworks for processing big data have come to the rescue and have made it possible to process and analyze petabytes of data with relative ease and affordable economics.
Raw data is important. As a matter of fact, a principle of big data is to always rely on raw data because it’s lossless and you never know what information will be required. And this is the reason why data scientists love raw data.
In network analytics, the same rule applies: if you can extract and transport raw data, do it. This is the case of most data centers, which usually have plenty of bandwidth and have the data sources (servers and network devices) and data repositories co-located.
But if you have an enterprise with multiple locations geographically distributed, IT has to consider the cost of transporting bytes back to a centralized location or to the cloud, in which case simply grabbing raw data is typically not an option. And with increasing east-west traffic, it is no longer sufficient to limit telemetry collection to central border network elements; it needs to be extended to every edge node, which again increases the amount of data. In these scenarios, it becomes crucial to find ways to reduce the data that is sent up, which means performing some distributed data processing at the edge by filtering, deduplicating, and compressing the raw data.
For both data center and enterprise, IT is interested in gaining insights from their network, rather than analyzing the raw data. As a matter of fact, getting the data is not the hard part and IT is already overwhelmed by numbers and figures today; the real value lies in processing the raw data and doing something valuable with it, extracting some actionable data.
Let’s consider another key point of view: automation and the move to intent-based networking has given the network operator a completely new level of flexibility in deploying cost-effective, scalable, and maintainable networks. However, with this approach, the operator loses a direct relationship with the underlying device hardware. Given the abstraction that comes with most automation, as well as configuration that is in many cases generated by controllers (and perhaps is not in human-readable form), how do administrators verify that their intent has been actually deployed and that it provides the results expected? Without an automated method to extract the relevant data from the network and validate what is actually happening, this is basically impossible.
Given these considerations, it’s clear that network analytics cannot be considered just a big data problem; there is a need for “something” to process the raw data and transform it in quality information in order to optimize the transport but also to enrich the data and provide useful insights. This is the role of the Cisco Digital Network Architecture (Cisco DNA) analytics engine.
Why a Cisco DNA Analytics Engine?
Everything connects to the network: users, devices, servers, printers, sensors, and all sort of IoT devices. A huge amount of data is transported by the network every second. This makes the network infrastructure itself a great source of big data.
Every business is realizing that unlocking the power of the information embedded in the network and deriving business insights is very critical. Historically, however, IT has not been very successful in creating value from this data and has dealt with multiple challenges, as described in Chapter 18, “Cisco DNA Virtualization Solutions: Enterprise Network Functions Virtualization and Secure Agile Exchange.” The challenges are shown in Figure 17-1 and explained in the following list:
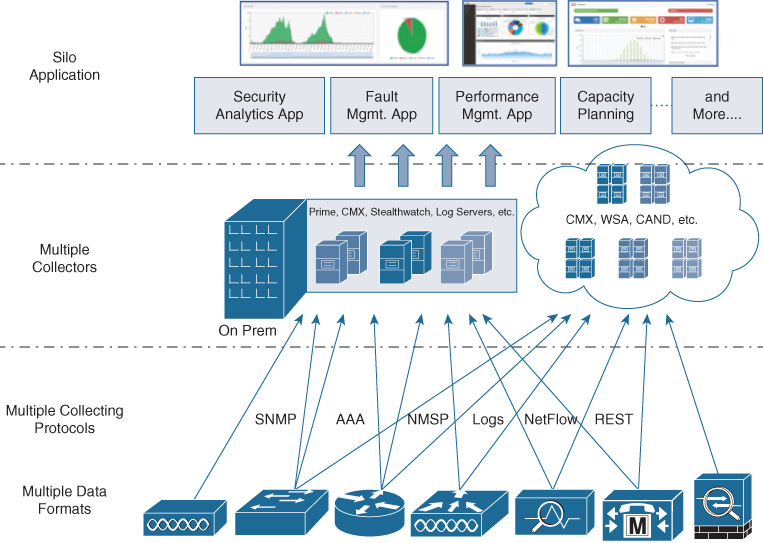
Network data inefficiencies: There is little consistency in the data gathered from network devices. Also, this information sometimes is redundant and overwhelming, and some other times is not enough. There are also inefficiencies related to the way information is stored and extracted from the devices: different network OSs, different data formats, and lack of data models.
Telemetry inefficiencies: These are related to the way information is exported out of the devices. Multiple telemetry protocols are not designed with stream and large-scale processing in mind and use inefficient pull or poll mechanisms.
Analytical inefficiencies: Existing analytics systems tend to be built in silos and for a specific purpose. As a result, telemetry from network elements needs to be sent out to multiple systems, putting load both on network elements and the bandwidth of a WAN link, for example; furthermore, the network operator lacks an end-to-end view of the network and no easy way exists to correlate the information across platforms.
Developer inefficiencies: Building analytics on top of raw network data requires deep knowledge of the underlying network. As a result, analytics developers tend to spend most of their time in data collection and normalization as opposed to the analytics logic, their core competency.
Beyond addressing the mentioned challenges, a Cisco DNA analytics engine is key to bringing additional value in the analytics process. Some of the important functions of the Cisco DNA analytics engine and related advantages are as follows:
Data transformation: The network delivers tremendous volumes of information, and often this can be filled with irrelevant noise rather than signal. Data transformation functions within the analytics engine allow developers to reduce the incoming stream to include only data relevant to the particular application. These are usually referred to as traditional extract, transform, load (ETL) functions. An example is a filtering function that may filter logs according to a specific location. For instance, if you are troubleshooting a problem in your company’s Italian branches, you may want to drop all the messages coming from the French ones.
Data aggregation: An analytics application almost always combines data from multiple sources. Aggregation/correlation of data allows network operators to easily combine multiple streams of information into one stream in order to gain more insights. For example, a performance monitoring application may need to link incoming flow records from multiple customer profiles in order to determine if the service level agreement (SLA) is met.
Data correlation: This refers to the capability of an analytics engine to provide additional context, and hence value, by pulling in and correlating data from various sources. For example, a NetFlow stream of information could be augmented with the user authentication information coming from the AAA server or with location information coming from Cisco Mobility Services Engine (MSE).
Time analysis: Network data flows continuously, but network operators often need a snapshot of the stream over an arbitrary time period. Cisco DNA analytics engines have the capability to store data efficiently and allow an operator to define a time period and the streaming data to include in the “window.” For example, a time window could show all interfaces in the last five minutes that exceeded a certain amount of megabits per second.
Network baselining through machine learning: How does an operator know if the network is behaving normally? What is normal? Machine-learning algorithms analyze the network flows and establish a baseline from which anomalies are detected easier. Consider client onboarding: what is the “normal” behavior at 9 a.m. when all the employees get connected and leverage DHCP services is very different from what is normal at 10 a.m. The analytics engine can take these factors into consideration before flagging a problem with “too many DHCP request per second.” A deep analysis of the different machine-learning algorithms (supervised, unsupervised and deep learning, etc.) is out of the scope of this book, but it’s important to state here that the Cisco DNA analytics engine provides infrastructure support for leveraging multiple machine-learning algorithms in a scalable fashion.
To address the IT challenges and provide the additional advantages described in the preceding list, Cisco DNA introduces two analytics engines, Cisco Network Data Platform (NDP) for the enterprise and Cisco Tetration tailored to the needs of the data center.
Cisco DNA Analytics Engines
Why are there two analytics engines in Cisco DNA, NDP for the enterprise and Tetration for the data center? The main reasons for this choice are mostly technical and originate in the fundamental differences of these two network domains. The most important are as follows:
Scale: To address the data center use cases, Tetration needs to process millions of flows per second, capture and store hundreds of billions of telemetry records, apply intelligent algorithms, and provide actionable insight in minutes; for this you need scale. That’s why this platform comes equipped with multiple servers and multiple switches to connect them. Such scale is usually not needed in the enterprise, so a lot of this capacity would be wasted and the cost would not be justified.
Data sets: Each analytics platform has been optimized for the extraction, processing, and analysis of the data common to the specific domain. The data center is all about applications, whereas for the enterprise the operators care more about users and devices.
Brownfield support: Given the distributed nature of the enterprise, support of older equipment is a must. Therefore, NDP has been built to support all the existing legacy southbound protocols to communicate with the network devices.
Analytics scope: The Tetration engine is very focused on a critical analytics function—application dependency mapping within a data center. NDP is a broader data collection, processing, and analytics engine because it needs to serve broader use cases in the enterprise, ranging from network analytics to client and application insights. NDP relies on APIs and Cisco and third-party analytics applications to provide specific actual business insight based on the data that is collected. Cisco Network Assurance is an example of integration with an internal application whereas ServiceNow1 represent a third party app.
1 For more information, see https://www.cisco.com/c/dam/en/us/products/collateral/data-center-analytics/network-assurance-engine/solution-overview-c22-740224.pdf.
Why did Cisco decide to build its own analytics engine instead of leveraging open source or commercial products available in the market? The answer lies in the importance of quality of data.
When it comes to network analytics, quality of data means different things. Yes, it is about accuracy, precision, and contextualized data, but this is true for any analytics solution. Specifically, in network analytics, data quality means that the data is optimized for the final user, in this case the data analyst and developer that are writing the analytics applications. In other words, it includes the following:
Model-driven data: Having a common, known, standard model for data representation that you can leverage is critical for network analytics because each platform and operating system would otherwise stream data in a proprietary format. Make sure that the data you receive gets formatted in the right way before it’s exposed to the application layer. Who better than Cisco to understand the data coming from network devices?
Network-aware data: Data could be structured or unstructured, but in a received stream there could be empty values, which is an indication that something is not right and you should raise an alert. For example, if you receive a Flexible NetFlow (FNF) stream from a Cisco device, the Cisco analytics platform knows exactly what each field should contain and can measure the quality of the data received and act upon it.
Bottom line, Cisco as a networking vendor understands network protocols and network information gathering and hence is in a unique position to build an analytics platform that processes and analyzes the data built by those protocols.
Let’s take a deeper look at each of the Cisco DNA analytics engines.
Cisco Network Data Platform
Cisco Network Data Platform (NDP) is the Cisco DNA network analytics platform for the enterprise. The goal of NDP is to simplify network analytics and enable Assurance by hiding complexities of network infrastructure data collection and analysis.
NDP is a real-time distributed analytics platform that provides a 360-degree granular view of the network and associated services. It’s built from the ground up to be secure, multitenant, and cloud enabled; it scales from small networks to large enterprise infrastructures with thousands of nodes. NDP is integrated in Cisco DNA Center.
NDP is also flexible and can be used in multiple use cases. The initial focus is on IT Operations Analytics (ITOA) and Network Performance Monitoring and Diagnostics (NPMD) where customers are particularly concerned with the following:
Network assurance: Very relevant to the Cisco DNA controller-based approach, network assurance leverages the analytics data from NDP to get insights into the network for troubleshooting and root cause analysis. Network assurance gives IT the possibility to measure the performance of the network, identify issues, go back in time to analyze network performance, see trends, and even suggest corrective actions. From an architecture point of view, assurance closes the automation loop: the user expresses a business intent (a network-wide QoS policy to treat Skype as business relevant, for example), this intent gets automated by the Cisco DNA controller, and then network assurance gets the telemetry data from NDP and verifies that the intent has been correctly implemented and has given the expected outcomes.
User and network behavior analysis: What is your network’s and applications’ “normal” behavior? Are they performing up to the users’ or customers’ expectation? NDP gives you the tools establish a baseline and then monitor deviation from it.
Security assessment and policy violations: If you have a baseline, you not only can monitor the performances but also can determine the anomalies in your traffic that could be caused by a security attack.
To deliver on these use cases, NDP interacts with other components of the Cisco DNA architecture. Figure 17-2 represents these interactions.
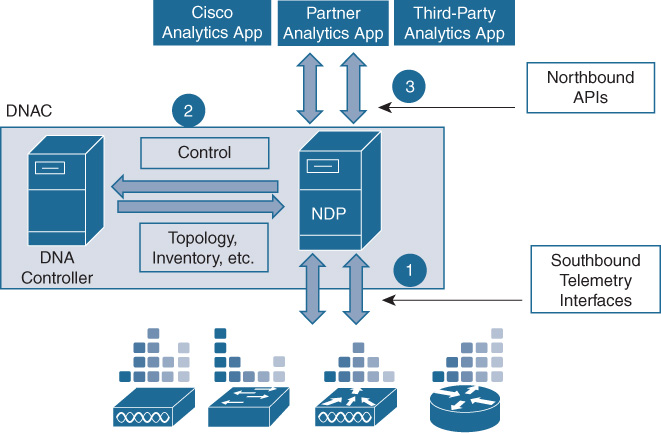
Specifically, NDP interacts with the following:
Network elements: Southbound, NDP collects telemetry data related to services deployed in the network from the network devices and end-hosts.
Cisco DNA Controller: NDP interacts with the Cisco DNA Controller to collect context information (such as inventory, device capabilities, topology, sites, locations, etc.) and also to configure the network elements for telemetry-related settings (control).
Applications: Northbound, NDP interfaces with the Analytics applications that leverage the NDP capabilities through open APIs.
Let’s consider an example of how these interactions are important by introducing the Telemetry Quotient.
Telemetry Quotient
One of the innovations that NDP introduces in network analytics is the Telemetry Quotient (TQ), a measure of the network “readiness” for telemetry and hence analytics. A higher TQ means that the devices in the network support good telemetry capabilities (for example, FNF is supported on all the access devices) and these have been turned on.
The TQ also represents a great example of the importance of the integration of NDP with the Cisco DNA Controller. The TQ is exposed to the network operator via NDP and, based on the value, the operator might receive a recommendation to perform some configuration changes to increase the TQ. These changes on the network, although instructed by NDP, are automated through the Cisco DNA controller to keep a coherent interaction between the different components.
NDP Architecture
This section gives an overview of the NDP architecture and the principles behind it. It describes the main components/layers of the NDP platform, how they interact with each other, and the different deployment modes, and it touches on important security aspects.
NDP Architecture Principles
As the Cisco Network analytics engine for the enterprise, NDP has been built from the ground up according to the following principles:
Simplify analytics applications development: NDP focuses on network analytics and on enabling common network use cases. The important principle here is that NDP hides the network details from the app developer and provides access to standard model data via open APIs. The developer doesn’t need to deal with the underlying technologies and can focus on processing and analyzing the data for the desired use case.
Technology framework abstraction: NDP architecture is built with a modular and flexible approach so that the chosen framework is not locked to a particular technology in a way that prevents the innovation and adoption of future better choices. NDP also takes care of the scaling and management of the infrastructure (compute, network, and data-related) resources.
Distributed analytics and advanced telemetry: As discussed in Chapter 16, “Cisco DNA Analytics Components,” Cisco DNA analytics leverages distributed analytics, and advanced telemetry protocols are key to an optimized analytics solution. NDP is built to exploit these protocols when available.
Platform extensibility: Although the core NDP platform provides the base building blocks of a data platform, it is possible to extend NDP in different ways: new data models, collector plug-ins for adding new data sources, analytic logic pipeline, data storage, etc.
Multitenant and cloud enabled: NDP is architected to be multitenant at the platform level from day one. It also leverages the cloud or can be implemented directly in a private cloud or public cloud. So, single-tenant and on-premises deployments are special cases of the general multitenant and cloud-ready deployments.
Cloud tethered: NDP may be deployed with a link to a Cisco-managed cloud. This primarily brings benefits to the customer in terms of hot patches, optimizations, newer capabilities, and seamless upgrades with zero downtimes, all of which are easily adopted. But it’s also beneficial to Cisco in terms of gathering anonymized data that can be leveraged to improve the product and develop new innovations.
NDP Architecture Layers
From a functionality point of view, NDP has multiple layers, each performing a specific job. Figure 17-3 shows a high-level representation of the building blocks of the NDP engine and the view of the related NDP architecture layers.
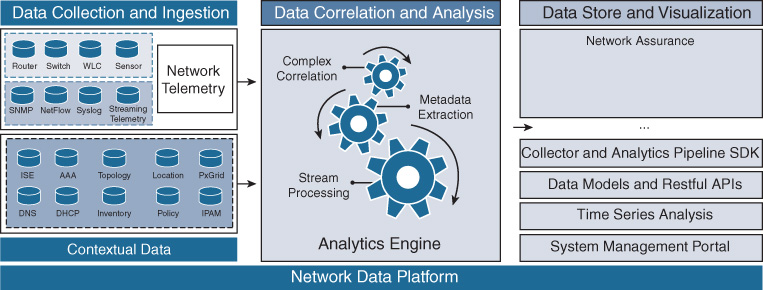
On the left side of Figure 17-3 are the analytics sources. These can be the network devices themselves for network-related data or the servers, controllers, and repositories for the contextual data. The right side of the figure represents the consumers of the analytics platforms, the applications and analytics tools that leverage the open APIs to access the data.
Figure 17-3 shows the different building blocks of the NDP platform as they relate to the logical layers or functions that the platform delivers. The first logical layer is the data collection and ingestion layer. This layer employs NDP collectors that are responsible for gathering data from different data sources/telemetry protocols. There are two type of collectors:
Data collectors: Extract data from network devices, hosts, network applications, etc. Each collector knows how to communicate with the data source and understands the data formats associated with that protocol. They implement either a push model or a polling model, depending on the telemetry protocol. Examples of data collectors are the Flexible NetFlow, syslog, and SNMP collectors.
Context collectors: Derive context data from network controllers and management systems (such as Cisco DNA Controller, Prime, etc.), identity services such as Identity Services Engine (ISE), and user data repositories such as MSE. Context data also includes aspects such as network inventory and topology.
The collector is also responsible for performing multiple types of optimization, which include the following:
Deduplication: Deduplication reduces the amount of duplicate info received. For example, in NetFlow, packets passing through several exporter devices will result in NetFlow receiving the same flow multiple times, one for each exporter device. Here, deduplication can be used to avoid duplicate counts of the same packets, and the same type of optimization can be done across multiple network devices, across multiple flows from a single user, or across similar flows from multiple users.
Compression: Existing compression techniques reduce the amount of data exchanged or stored.
Aggregation: Data aggregation can be applied across contexts, such as users, applications, etc., or over time intervals.
Filtering: Filtering techniques can be made available if certain data matching certain rules needs to be discarded.
When the NDP engine is deployed as a standalone node, the collector layer functions are embedded in the engine itself. This is clarified in the next section, which presents the NDP components.
After the collector function has gathered and optimized the data from the respective sources, it publishes the information to the ingestion processing. This layer is primarily responsible for accepting incoming data as fast as possible, so that the collector doesn’t have to drop any single byte and all the info is retained. The data is then made available to “consumers” in a scalable fashion. In other words, ingestion layer provides a publish-subscribe (pub-sub)2 message exchange mechanism where the collection layer is the publisher and the analytics layer is the subscriber. The ingestion layer provides two important services: persistence of messages, which ensures that messages are not lost in case the ingestion service is restarted, and replay of messages, which allows replay of messages from a particular point. The pub-sub architecture is used for building real-time data pipelines and streaming apps. It is horizontally scalable, fault-tolerant, and really fast.
2 For more information on the pub-sub mechanism, see https://kafka.apache.org/.
The data correlation and analysis layer enables developers to build analytics pipelines using a single framework for both streaming and batch processing. An analytics pipeline represents a specific sequence of steps involving various transformations such as filtering, grouping, splitting and joining, windowing, aggregation etc. In practice, this layer allows the developer to build the analytics logic.
The data store and visualization layer provides multiple types of data repositories for storing raw and processed data. These are provided for the following data models:
Column/Key-Value store: For key-based results, aggregated data, etc.
Time series store: For processing and storing time series data
Graph store: For processing and storing graph data models
Unstructured data store: For processing textual data like syslogs
The data store function within NDP handles the sharding3, scaling, and management of the data and data stores.
3 Shard is a database construct; for more info, see https://www.cisco.com/c/en/us/solutions/collateral/data-center-virtualization/unified-fabric/white-paper-c11-730021.html.
Finally, the data visualization function within this layer provides the interface for data externalization. It defines different language software development kits (SDK) and APIs to access analytics data from the different stores. It abstracts the data capabilities without exposing the semantics of individual data stores.
NDP Architecture Components
NDP is built on a distributed and flexible architecture to deliver scalability and extensibility in the different deployment modes supported: cloud, on-premises, and hybrid.
The NDP architecture consists of three main components as represented in Figure 17-4.
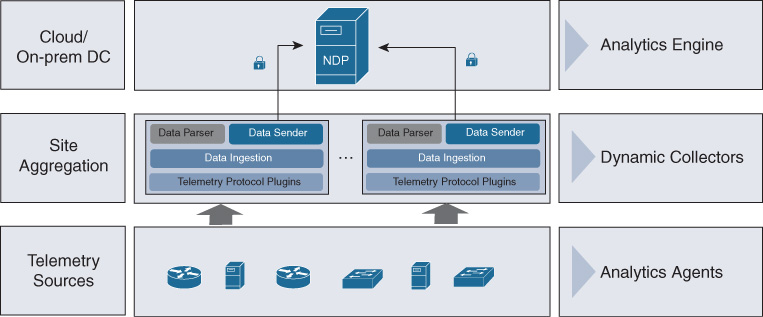
Each component is as follows:
NDP analytics engine: This represents the main analytics platform and is typically deployed in the data center (on-premises or cloud). Most of the analytics processing happens in this component. For smaller deployments, it can run as a single standalone node (up to 50,000 devices) and hence collapse the other components. It can be deployed with multiple nodes/engines for scalability and high availability. Each NDP Engine implements all the layer functionalities represented in Figure 17-3. External applications and the Cisco DNA Controller interface only with the main NDP engine and not with the other components below.
NDP collector: As the name suggests, the main job of the NDP collector is to optimize the data gathering and parsing functions. It does this through specific plug-ins written for the specific data being collected. The NDP architecture is flexible and the collector can either be embedded in the NDP engine or distributed as a standalone function. The distributed NDP collector has not been released at the time of writing.
NDP analytics agent: An optional component that is embedded in the network device or in another analytics source. The main function of the agent is to extract optimized telemetry from the device, and aggregate and secure this data directly from the device.
Let’s analyze a bit further the collector and its functions. This component, as previously noted, can be embedded in the NDP engine itself or it can be deployed as an external appliance when it’s necessary to distribute the collection function. Figure 17-5 illustrates the NDP collector’s function building blocks.
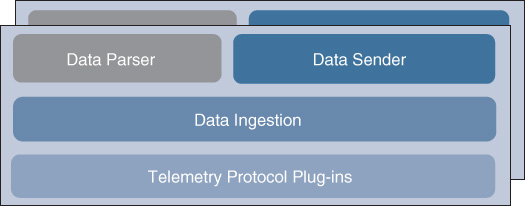
Starting from the bottom block, the functions are as follows:
Protocol plug-ins: The pieces of software that interact with a specific telemetry protocol. There is a plug-in for each standard protocol, such as SNMP, Radius, NetFlow, etc., but also for new/custom streaming telemetry protocols. Remember the extensibility principle for NDP? The collector has been designed to be easily extended to support new telemetry protocols developed by Cisco or third parties.
Data ingestion: Same functions as previously described in the data ingestion layer of the main analytics engine. It collects the data from the different plug-ins and makes it available for other blocks to process.
Data parser: The use of a data parser depends on the use case. If the use case requires raw data to be sent to the central engine, then this component is not involved. But it might be useful to parse the data to reduce the duplicated information (for example, you could have multiple NetFlow collectors in the network analyzing the same flow) or to apply some filters and metadata (such as the location from where the packets originated). In this case, it makes sense to have this processing locally at the site.
Data sender: This block acts as a consumer of messages from the local ingestion layer, establishes a secure session with the counterpart, the Data Receiver in the NDP engine, and transfers the messages securely.
There are three main reasons why external NDP collectors would be beneficial:
An NDP collector helps to scale the data collection. Instead of sending the telemetry data from the network devices/sources directly to the centralized analytics engine, the NDP collector distributes the data-gathering process and optimizes the transport by deduplicating and filtering the data locally onsite; by doing so, it reduces the amount of traffic sent upstream. This is critical when you have distributed locations connected to the analytics engine through slow and costly WAN links.
When the analytics engine is deployed in cloud mode, then the collector is a mandatory component to securely connect the enterprise domain with the cloud.
The collector makes the data processing more efficient by getting closer to the source of data. This is in accordance with the concept of distributed analytics, discussed in Chapter 16.
NDP Deployments Modes
In accordance with the Cisco DNA principle of flexibility and to meet the possible different customer requirements, NDP supports multiple deployment modes: on-premises, cloud, and hybrid (which is simply a mix of the other two). Let’s examine the details of the on-premises and cloud options.
Even if the NDP architecture has been developed to be able to support multiple mode, at the time of writing the on-premises model is the only one supported by Cisco DNA.
On-Premises Deployments
In on-premises deployments, the NDP engine is usually installed in the data center, part of the Cisco DNA appliance. This is either the enterprise data center (DC) or a private cloud data center. Optionally, external NDP collectors can be deployed to scale the telemetry collection in branch offices and/or aggregation locations or even inside the campus.
When the NDP engine is deployed as a standalone node (i.e., without external NDP collectors), the mode is called centralized and all the data collection and analysis happens inside the engine itself. Figure 17-6 shows a centralized deployment.
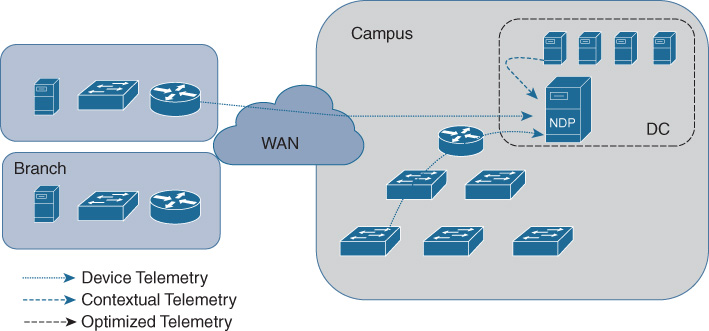
The blue dashed arrow in Figure 17-6 represents the telemetry data (Flexible NetFlow, for example) coming from one or more network devices. The dotted line arrow represents the contextual telemetry gathered from contextual sources and repositories such as controllers, AAA servers, etc. In this mode all telemetry data is sent directly to the centralized NDP engine. At the time of writing the standalone centralized mode is the only one supported.
This deployment is recommended for campus networks or large branches where the standalone NDP can be deployed onsite in a data center. When it comes to a distributed enterprise with locations across a WAN, you need to consider the available WAN bandwidth, as all telemetry data is sent to the central NDP in this deployment. The NDP engine could be deployed as a single node or multiple nodes for better high availability and/or horizontal scaling.
To increase the collector flexibility and optimize the transport of telemetry data across the WAN, Cisco is also delivering a distributed deployment where the telemetry-gathering function is distributed to multiple local NDP collectors, as shown is Figure 17-7.
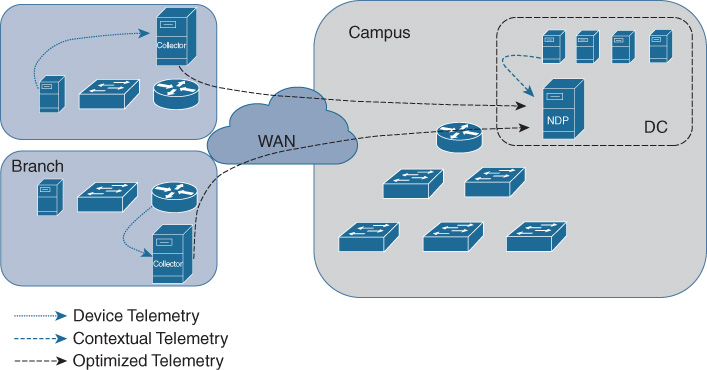
By offloading the telemetry collection function to the NDP collectors, if deployed across the WAN, the normalization and filtering of data happens locally and hence optimizes the amount of data sent to the central NDP engine. This is represented by the black dashed arrow in Figure 17-7.
The deployment mode is flexible, and the NDP collector shown in Figure 17-7 at a single branch, in reality, can be deployed at a regional office level to collect data from multiple branches and aggregate the telemetry traffic.
Cloud Deployments
In cloud deployments, the NDP Engine is hosted in the cloud. In this case NDP collectors are recommended, as sending the data directly to the cloud is not efficient. Also, legacy devices are not able to perform streaming telemetry and hence there is a need for an on-premises collector.
Figure 17-8 shows the diagram of the interactions for an NDP cloud deployment.
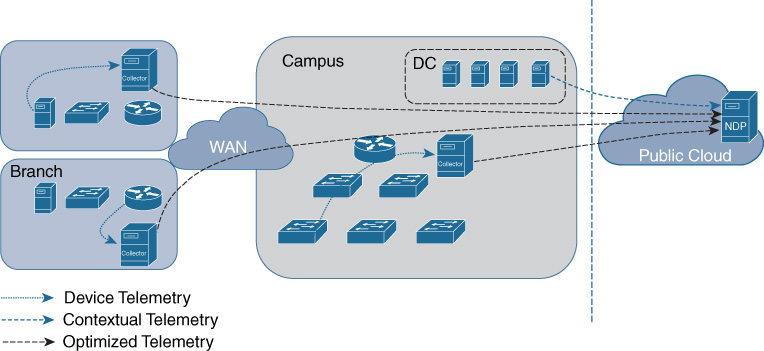
The advantages of this deployment are typical of a cloud-delivered service and are as follows:
Scale and performance: The analytics platform needs to accommodate vast amounts of data, and a cloud model makes it easier to add storage or computing resources to scale horizontally or to increase performances.
Historical data and trends: More scalability means being able to store more data and for longer periods. This is critical in order to produce meaningful reports and provide the baseline trends.
Painless upgrades: As enterprise customers are looking at developing analytics in the cloud, this approach usually provides a simpler way to do software and hardware upgrades when compared to an on-premises distributed system. This is because of the automation and orchestration tools that are used to build a cloud service.
High availability: Similarly, running a platform in the cloud makes it easier to add physical and virtual redundancy to increase the service uptime.
At the time of writing, Cisco DNA and NDP engine were not available in the cloud yet, but Cisco considers this a natural evolution of the Cisco DNA architecture.
NDP Security and High Availability
The analytics engine deals with a lot of critical network and user data. It’s mandatory to provide protection and confidentiality for the information managed by the NDP platform and also guarantee that the platform is highly available.
Let’s consider security first. The NDP platform provides security at the following levels:
Transport security: NDP provides northbound APIs access for other applications to interact with the platform. All these APIs are protected using open standards such as Hypertext Transfer Protocols (HTTPs), Secure Sockets Layer/Transport Layer Security (SSL/TLS), OAuth, etc. The communication between the NDP engines and the distributed collectors is protected with a secure tunnel such as Internet Protocol Security (IPsec) or Diagram Transport Layer Security (DTLS). Finally, most NDP collectors need to communicate with data sources using respective telemetry protocols. These collectors implement the security standard required by those telemetry protocols.
Data security: NDP Engine uses role-based access control (RBAC) to provide controller and fine-granular access to data. This is true for all the APIs exposed by the platform in a single- or multitenant environment. NDP provides also a secure credential store service to store key material required for the transport security aspects already mentioned.
High availability is a key characteristic of NDP and is implemented at different levels. Both the NDP Engine and the NDP collectors are built on top of a Cisco-developed Infrastructure as a Service (IaaS) that provides the support for application/service restartability in case of failures of a software component. So, for example, if the SNMP collector within an NDP collector engine fails, it is automatically restarted without compromising the overall functionality of the NDP collector itself.
At a system level, NDP collectors can be deployed in a 1:1 active–active deployment where the entire node is backed up by another node that can take over in case of failure.
For the centralized NDP engine, the system supports an N+1 active–active deployment; this means that NDP can be deployed in a cluster and any node can fail without compromising the functionality of the platform. The cluster function is also used for scalability.
Cisco Tetration Analytics
Modern data centers have evolved in a brief period of time into the complex environments seen today, with extremely fast, high-density switching networks pushing large volumes of traffic, and multiple layers of virtualization and overlays. Data centers typically handle millions of flows a day, and are fast approaching billions of flows. On average, there are 10,000 active flows per rack at any given second.4 The result is a highly abstract network that can be difficult to secure, monitor, and troubleshoot.
4 T. Benson, A. Akella, and D. Maltz, “Network Traffic Characteristics of Data Centers in the Wild,” Proceedings of the 10th ACM SIGCOMM Conference on Internet Measurement (2010): 267–280.
The type of workload deployed is changing in nature as well. The popularization of microservices has caused development of containerized applications that exhibit entirely different behavior on the network than traditional services. Their lifecycles often can be measured in milliseconds, making their operations difficult to capture for analysis. The same effect can be seen with hybrid cloud and virtualized workloads, which move between hypervisors as needed. Furthermore, highly scaled data centers are challenging Transmission Control Protocol (TCP) to meet their high-performance needs, including the need to handle multiple unique conversations within the same long-lived TCP session.5
5 L. Qiu, Y. Zhang, and S. Keshav, “Understanding the Performance of Many TCP Flows,” Computer Networks 37, no. 3 (2001): 277–306.
At the same time, IT architects are faced with two significant challenges:
Increasing the speed of service deployments and associated infrastructure changes
Gaining security insights on the applications and associated data to protect them against a rapidly evolving set of security threats
It’s clear that to be able to efficiently and confidently respond to these changes, you need a complete understanding of the applications flow in your data center, meaning you need complete visibility.
The Cisco Tetration Analytics platform is designed to address these challenges using comprehensive traffic telemetry data collected from both servers and Cisco Nexus switches. The platform performs advanced analytics using unsupervised machine-learning techniques and behavioral analysis and enforces a consistent whitelist policy for applications. The platform provides a ready-to-use solution that includes the following:
It provides complete visibility into application components, communications, and dependencies to enable implementation of a zero-trust model in the network.
It performs real-time asset tagging, allowing administrators to associate specific characteristics with traffic telemetry data and workloads.
It automatically generates whitelist policy based on application behavior.
It provides a mechanism for including any existing security policy based on business requirements.
Based on the information provided, IT organizations can enforce consistent policy across heterogeneous infrastructure and apply application segmentation.
Let’s dive deeper and understand how Cisco Tetration works and how it all starts with the quality of data you analyze.
It’s All About Quality of Data
As stated in the introduction, to be able to efficiently and confidently respond to changes, you need a complete understanding of the applications that are present on your network. The problem is that in data centers, it can be almost impossible to manually catalog and inventory the myriad applications that are running at any one time, and doing so usually requires extensive and often challenging manual collaboration across a number of separate groups. And even if an organization performs manual application dependency mapping, it is not a one-time operation. Mappings must be maintained as living documents—otherwise, the source of information will increasingly diverge from the source of truth (the actual application traffic).
It’s clear that in order to manage your data center securely and efficiently, you need correct and up-to-date information about the applications. The question is how to get it.
Historically, three approaches are usually used for application mapping:
Manual approach: The network team attempts to manually collect application information across groups that have deployed applications on top of the network infrastructure.
Simple automated approach: Simple automated tools are run in an attempt to collect application dependency mapping information.
Outsourced approach: An external agency combines the manual and native approaches and then evaluates the collected information and compiles it into a report.
Most organizations find the manual approach labor and cost intensive, and from a technical perspective it is too rigid. Manual application dependency mapping is feasible only at a very small scale. The network team also should have a strong relationship with the application teams, who must gather the required data. This process is prone to human error and mistakes, and the probability of accurately mapping the applications in the data center is low. The collected data is usually compiled into a static report that diverges from reality as soon as it is published.
Businesses may be tempted by the simple automated option. It appears to incur only the low capital costs needed to purchase software that claims to be able to map applications, and to require only a small operations team to run the application dependency mapping tool. However, current simple software implementations of application dependency mapping are notoriously ineffective at truly mapping the application landscape. Often, the application dependency mapping software is not to blame. The problem instead is the source data ingested. With poor or incomplete input data, the application dependency mapping tool cannot make accurate observations, however revolutionary the mapping algorithm may be. Therefore, to complete the mapping process, the low-quality automated recommendations must be supplemented by human input, increasing the long-term costs of using this approach. Traditional application dependency mapping software usually does not learn from this human supervision, causing staff to have to repetitively help the tool. Traditionally, capturing enough high-quality source input data at data centers at scale has been a task that only few organizations with huge resource pools and equipment have been able to achieve.
The outsourced approach has the problems of both approaches, and it adds a layer of cost and complexity. It also does not usually provide any more actionable or insightful mapping than the other two techniques.
To efficiently map all the applications in your data center, you need the raw information and you need it fast. For this, Cisco has introduced a new approach to network analytics: Cisco Tetration.
Data Center Visibility with Cisco Tetration Analytics
To perform accurate application dependency mapping, a huge breadth of high-quality input data is critical to be able to make relevant observations. To achieve this, the Cisco Tetration Analytics architecture was designed from the foundation to capture high-quality data.
The Cisco Tetration Analytics platform consists of next-generation Cisco switches that have flow-capturing capabilities built in to the application-specific integrated circuit (ASIC), small-footprint OS-level agents, and a next-generation analytics cluster that incorporates big data technology that can scale to billions of recorded flows, as shown in Figure 17-9.

Because data is exported to the Cisco Tetration Analytics cluster every 100 ms, the detail of the data is much finer.
Cisco Tetration Analytics is much less likely to miss so-called mouse flows, which often are missed by NetFlow collectors, with an export rate set to 60 seconds. Because the flow table is flushed so often, Cisco Tetration Analytics sensors are unlikely to be overwhelmed and therefore unlikely to need to drop flow records because of lack of available memory. This is a significant change in the architectural model: the flow-state tracking responsibility is transferred from the sensor to the collector, allowing hardware engineers to design smaller, more efficient, and more cost-effective ASICs.
Not only does Cisco Tetration Analytics allow you to analyze a huge amount of data at one time, it keeps a detailed historical record without archiving or losing any resolution in the data. This look-back feature allows the system to understand more than a single snapshot in time, and to show trends for an application. For example, many businesses have applications that have a seasonality about them, with additional capacity or dependencies pulled in dynamically at moments of extreme load or at the end of a fiscal quarter. Understanding this behavior is important because the application may have hidden dependencies that are not visible during quiet periods. Without this knowledge, traditional application dependency mapping tools may recommend policies that do not truly map an application’s full requirements across its entire lifecycle. This is the quality of data you need.
After this high-quality and comprehensive input data has been ingested by the analytics cluster, it is available for analysis by application insight algorithms within the Cisco Tetration Analytics platform. Whereas traditional application dependency mapping tools use a top-down approach because they do not have access to such data, Cisco Tetration Analytics is designed with a bottom-up approach in which recommendations are made from actual application traffic.
Because the Cisco Tetration Analytics architecture delivers such high-quality data, the platform can make use of unique mapping algorithms that take advantage of this capability, generating far more accurate and complete application dependency maps and recommendations. The mapping algorithm computes a unique profile about every endpoint to be mapped. The profile is based on a large number of data points, including detailed network flow information mapped to the originating process within the endpoint operating system. This information is then combined with information from external data sources such as domain name, load-balancer configuration, and geolocation information. The machine-learning algorithm then iteratively compares each profile to the other profiles until a best fit is achieved.
An example of this mapping is shown in Figure 17-10.
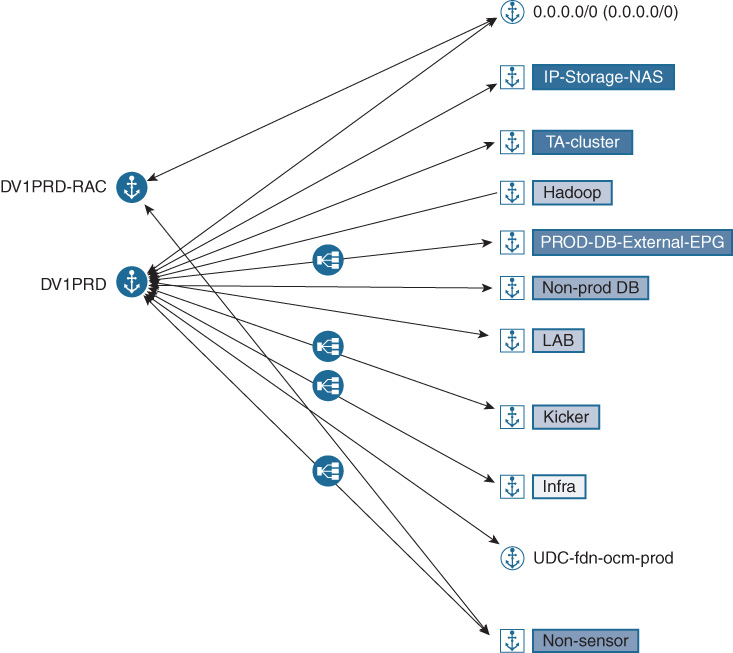
Any recommendations that the application dependency mapping makes are accompanied by a confidence score. Confidence scores indicate how sure the algorithm is that the grouping is correct. This score allows human operators to prioritize their time when providing any additional input: they can start with the recommendations about which the tool is least confident. As the system learns, the confidence score is likely to go up for a given grouping as the tool starts to understand the patterns that group particular endpoints together in your data center. The recommendations that the application insight feature makes can then be confirmed by a human supervisor. However, unlike traditional application dependency mapping tools, Cisco Tetration Analytics understands the instructions from the operator and learns from the experience. The next time the application dependency mapping tool is run, it factors in the human guidance, saving valuable time for the operator.
Let’s examine the architecture of the Cisco Tetration solution.
Cisco Tetration Analytics Architecture
The Cisco Tetration Analytics platform has four main functional layers.
Data Collection Layer
This layer consists primarily of sensor functions. Sensors are the eyes and ears of the analytics platform. Two types of sensors are used:
Software sensors: These lightweight sensors run as user processes and can be installed on any server (virtualized or bare metal). Two types of software sensors are used: full-visibility sensors and limited-visibility sensors. Limited-visibility software sensors are designed to collect connection information to support specific Cisco Tetration Analytics use cases. These sensors are not designed to provide comprehensive telemetry data.
Hardware sensors: These sensors are embedded in Cisco Nexus 92160YC-X, 93180YC-EX, and 93108TC-EX Switches.
Figure 17-11 shows the Telemetry that Cisco Tetration extracts from both hardware and software sensors.
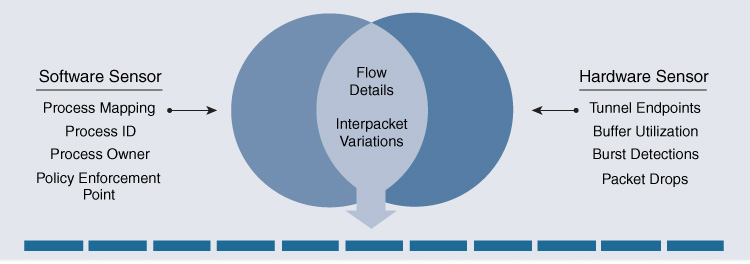
The full-visibility software sensors and the hardware sensors collect three types of telemetry information:
Flow information: This information contains details about flow endpoints, protocols, and ports; when the flow started; how long the flow was active; etc.
Inter-packet variation: This information captures any inter-packet variations seen within the flow. Examples include variations in the packet’s time to live (TTL), IP/TCP flags, and payload length.
Context details: Context information is derived outside the packet header. In the case of a software sensor, this information includes details about the process, including which process generated the flow, the process ID, and the user associated with the process.
Sensors do not process any information from payloads, and no sampling is performed. Sensors are designed to monitor every packet and every flow. In addition to the sensors, this layer includes configuration information from third-party sources, such as load balancers, Domain Name System (DNS) server records, the IP address management database, etc. This configuration data is used to augment the information provided by the analytics platform.
Analytics Layer
Data from the sensors is sent to the Cisco Tetration Analytics platform, which is the brain that performs all the analyses. This multi-node big data platform processes the information from the sensors and uses unsupervised and guided machine learning, behavior analysis, and intelligent algorithms to provide a ready-to-use solution for the following use cases:
Accurate insight into application component communications based on observed behavior
Automated grouping of similar endpoints (for example, web server clusters and database clusters)
Consistent whitelist policy recommendations for applications and monitoring for compliance deviations in minutes
Policy impact analysis to test a policy before enforcing it in the network
Automated policy enforcement that enables a zero-trust model
Monitoring to track policy compliance deviations and update policy in near-real time
Pervasive visibility in real time across data center infrastructure
Long-term data retention for historical analysis without loss of detail
In-depth forensics using powerful search filters and visual queries
Enforcement Layer
Full-visibility software sensors act as the enforcement point for the detailed application policy generated by the platform, helping enable application segmentation. Using the data from the sensors, the Cisco Tetration Analytics platform provides consistent enforcement across public, private, and on-premises deployments. This layer also helps ensure that policy moves along with the workload, even when an application component is migrated from a bare-metal server to a virtualized environment. In addition, the enforcement layer helps ensure scalability, with consistent policy implemented for thousands of applications spanning tens of thousands of workloads.
Visualization Layer
The Cisco Tetration Analytics platform enables consumption of this data through an easy-to-navigate and scalable web GUI and through Representational State Transfer (REST) APIs. In addition, it provides Apache Kafka–based push notification to which northbound systems can subscribe to receive notifications about policy compliance deviations, flow anomalies, etc. Advanced users have access to the Hadoop data lake and can write custom applications using programming languages such as Python and Scala that are run on the platform using the powerful computing resources available.
The Benefits of Cisco Tetration Analytics
Cisco Tetration Analytics application insight has the intelligence to truly map your data center’s application landscape, helping address a wide range of problems in the data center.
During the mapping process, the platform captures and tracks the consumers and providers of services for an application. Correctly identifying the provider of a service is achieved using degree analysis: tracking the number of inbound connections and, if possible, who initiated the TCP session. With this information, you can apply whitelist security policies across the data center. Whitelists are usually expensive to implement and difficult to maintain because they usually take a lot of ternary content-addressable memory (TCAM) space in network devices and they are complex to deploy and maintain. With Cisco Tetration Analytics application dependency mapping, this task is substantially easier.
Application whitelisting is a core concept of the next-generation Cisco Application Centric Infrastructure (ACI) data center networking solution.
To deploy a data center network that implements application whitelisting, application dependency must be fully mapped before migration; otherwise, you risk cutting off legitimate communications to a given workload. Cisco Tetration Analytics mapping results are used to ease the migration path. In fact, the platform has a policy compliance tool that uses the results of application dependency mapping to simulate what-if whitelist scenarios on real application traffic, displaying detailed information about what traffic would have been permitted, mistakenly dropped, escaped, or rejected.
Data centers are living entities that change constantly. Often applications need to update, change configuration, or scale. If you have application dependency mapping data for reference before and after an application change, you can verify the success of an update, check the results of a change, or monitor the stability of an application at the network level.
For example, an update to an application might cause it to incorrectly launch with development settings that point at a test database server, causing a critical application to fail in minutes. Application dependency mapping can detect that the application is now incorrectly connecting to a test database server and alert staff. Disaster recovery is a minimum requirement for most production data centers.
In fact, most IT leaders have a disaster-recovery plan in place. But how can you validate your disaster-recovery plan at the network level, especially when application whitelisting is applied and may affect the effectiveness of your disaster recovery plan?
Because of the long look-back period, Cisco Tetration Analytics helps to make sure that any policy it recommends is aware of disaster-recovery dependencies that it has detected from any tests.
Some other benefits of an accurate application dependency map are as follows:
Facilitate mergers and acquisitions (M&A): Get a clear understanding of which applications need to be migrated as part of the M&A process, and which application components and services are redundant and can be phased out. This information is critical and can accelerate the integration of the two entities.
Migrate applications to other infrastructure or the cloud: Now you can migrate applications to a new infrastructure or a public cloud with confidence, knowing exactly which components are required and what network services each application is dependent on.
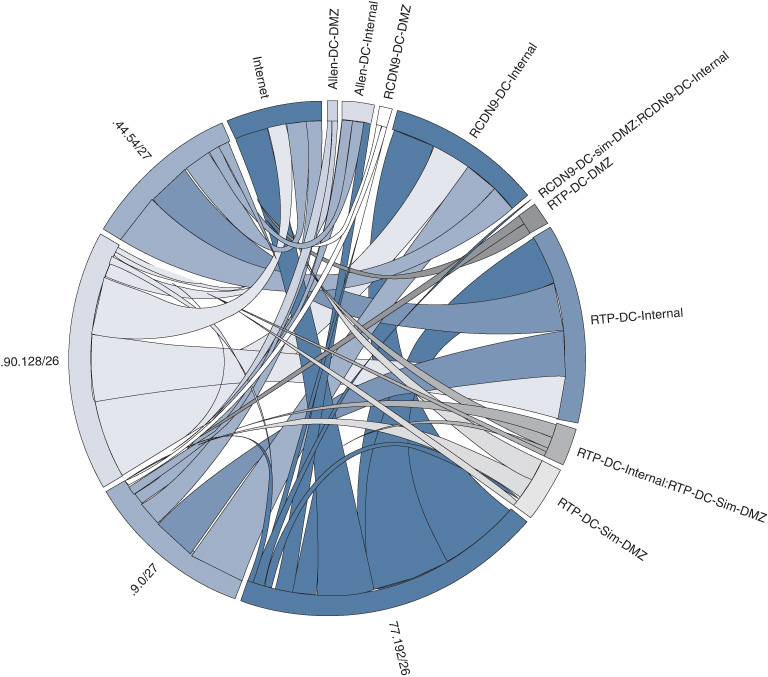
Figure 17-12 shows the traffic patterns discovered between neighboring endpoint clusters. The thickness of a chord indicates the number of ports that are exposed between neighboring clusters.
Summary
IT managers need complete visibility into the behavior of their networks, users, and applications to make informed decisions and move to intent-based networking and embrace full automation of their network.
The network, whether in the enterprise or in the data center, is getting ever more complex and transporting ever more data. The challenge becomes how to extract the relevant insight from all this data.
To cope with complexity of today’s networks, with the speed and scale at which data needs to be processed, Cisco DNA leverages the functions of the Cisco DNA Analytics Engine. This chapter introduced Cisco Network Data Platform (NDP), the enterprise Network Analytics Engine, and Cisco Tetration, the Analytics platform for data centers. The problems they solve were analyzed. This chapter also provided a description of the architecture of each and the benefits it brings.
Further Reading
Cisco DNA Center Analytics: https://www.cisco.com/c/en/us/solutions/enterprise-networks/dna-analytics-assurance.html
Cisco Tetration Analytics: https://www.cisco.com/c/en/us/products/data-center-analytics/tetration-analytics/index.html.
Cisco Tetration White Papers: https://www.cisco.com/c/en/us/products/data-center-analytics/tetration-analytics/white-paper-listing.html