2. Rationale and approach for studying patterns of ecosystem productivity and carbon flow
3. Patterns in ecosystem productivity and carbon flow
The characterization and understanding of carbon flows in aquatic and terrestrial ecosystems are topics of paramount importance for several disciplines, such as ecology, bio-geochemistry, oceanography, and climatology. Scientists have been studying such flows in many diverse ecosystems for decades, and sufficient information is now available to investigate whether any patterns are evident in how carbon flows in ecosystems and to determine the factors responsible for those patterns. In particular, a wealth of information exists on the movement of carbon through the activity of herbivores and consumers of detritus (i.e., decomposers and detritivores), two of the major agents of carbon flows in ecosystems. This chapter analyzes the transference of carbon through herbivory and decomposition in aquatic and terrestrial ecosystems, documents the nature and implications of salient patterns, and explains why those patterns emerge.
absolute decomposition. The amount (in g C.m-2-year-1) of detritus consumed by microbial decomposers (e.g., bacteria, fungi) and detritivores, which range from detritivorous micro-, macro-, and gelatinous zooplankton in pelagic systems to micro-(<100 um), meio- (100–500 pm), and macrofauna (>500 um) in benthic and terrestrial systems
decomposition rate. The proportion of detrital mass decomposed per unit time (e.g., day-), often estimated by fitting the following single exponential equation to the pattern of detritus decay observed in experimental incubations, DMt = DMt0e-k(t-10), where k is the decomposition rate, DM t is the detrital mass remaining in the experimental incubation at time t, DMt0 is the initial detrital mass, and (t—t0)is the incubation time
detrital production. The amount (in g C.m-2-year—1)of net primary production not consumed by herbivores, which senesces and enters the detrital compartment
detritus. Dead primary producer material, which normally becomes detached from the primary producer after senescence
herbivory. The amount (in g C.m-2-year—1) of net primary production ingested or removed, including primary producer biomass discarded by herbivores
net primary production. The amount (in g C.m-2-year-1) of carbon assimilated through photosynthesis and not respired by the producer
nutrient concentration (producer or detritus). The percentage of nitrogen and phosphorus within producer biomass or detritus on a dry weight basis
Carbon enters the biotic component of an ecosystem when inorganic carbon, often carbon dioxide, is taken up and converted into organic compounds. With the rare exception of chemosynthetic organisms, the energy for this conversion comes from photosynthesis. Once inorganic carbon has been converted into organic compounds, it is considered fixed. This production of fixed carbon is known as primary production, and those organisms that can fix carbon are primary producers. Gross primary production is the entire amount of carbon fixed by a primary producer. Net primary production is gross primary production minus the organic compounds that have been broken down during respiration to fuel cellular processes within the primary producer.
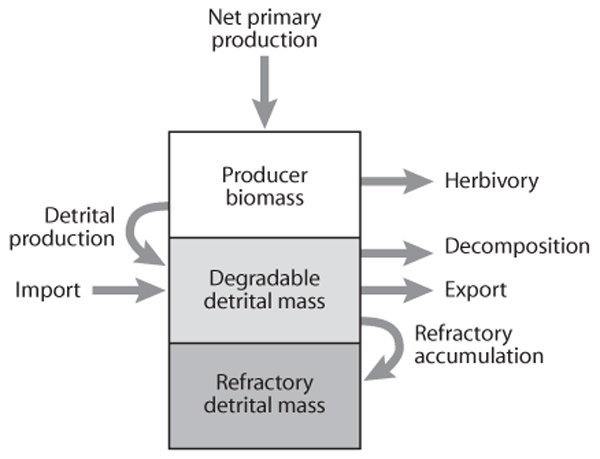
figure 1. Diagram of carbon flow into and out of the producer and detrital pools in an ecosystem. (Adapted from Cebrian, 1999)
It is the fixed carbon measured by net primary production that becomes primary producer biomass and part of the producer carbon pool (figure 1). This fixed carbon will then either remain as producer biomass, be consumed by herbivores, or enter the detrital pathway and become part of the detrital carbon pool. The import or export of detritus can also alter the amount of carbon in the detrital pool, but regardless of the source of the detritus, detrital carbon will either be recycled by decomposers and detritivores or stored as refractory carbon.
In both aquatic and terrestrial ecosystems, the transfer of fixed carbon from primary producers to herbivores and decomposer/detritivores provides major pathways for the flow of energy and nutrients. As a result, these transfers have consequences not only for carbon storage but also for nutrient recycling and herbivore and decomposer/detritivore populations.
In assessing these transfers, it is important to recognize that they can be viewed in absolute as well as proportional terms. Absolute size refers to the amount or magnitude of the transfer measured in units of producer carbon often over space and time (i.e., g C m~2year-1), whereas proportional size refers to the percentage of net primary production consumed by herbivores or the percentage of detrital mass consumed per unit time by decomposers and detritivores.
When regarded as an absolute flux, herbivory sets limits to the level of herbivore production maintained in an ecosystem. Because of herbivore respiration and herbivore egestion of nonassimilated producer biomass, the transfer of fixed carbon from primary producers to herbivores is not complete, and only a fraction of producer biomass ingested becomes herbivore biomass. When herbivory is considered as the percentage of net primary production removed, its implications for the impact of herbivores on carbon and nutrient recycling and storage as producer biomass in the ecosystem become apparent. If herbivores remove a large percentage of net primary production, only a small percentage of the carbon fixed and nutrients taken up by producers is available for accumulation as producer biomass. In such cases, herbivores have the potential to exert significant control on carbon and nutrient storage by producers, which is commonly referred to as top-down regulation (see chapter III.6). Likewise, as the percentage of net primary production consumed increases, so does consumer-driven recycling of carbon and nutrients in the ecosystem. It is important to mention that, when diverse ecosystems are compared, absolute consumption and percentage of net primary production consumed are not always related. Ecosystems with high net primary production may support large absolute consumption by herbivores, which may still represent a small percentage of that high net primary production, in comparison with ecosystems with lower net primary production supporting less absolute consumption but a larger percentage of net primary production lost to herbivores.
As is the case for herbivory, decomposition can also be viewed as an absolute flux or as a proportion of detrital mass decomposed per unit time (i.e., decomposition rate). When considered as an absolute flux, decomposition corresponds to the amount of detritus consumed by microbial decomposers and detritivores. This consumption leads to the reduction of particulate and dissolved detritus into simpler and simpler constituents and, ultimately, to nutrient mineralization. Much like herbivory, decomposition, when regarded as an absolute flux, is indicative of the potential levels of decomposer and detritivore production maintained in the ecosystem because only a fraction of the carbon ingested by decomposers and detritivores is metabolized into biomass of these organisms. When decomposition is viewed as the proportion of detrital mass decomposed per unit time, its implications for how fast carbon and nutrient flow through the detrital pathway become apparent. Ecosystems whose decomposition rate is high tend to have faster nutrient and carbon recycling rates and store less carbon in their detrital pools regardless of any large differences in detrital production. It is worth mentioning that, when diverse ecosystems are compared, higher values of absolute decomposition do not always equate to higher decomposition rates. Ecosystems with low detrital production may have high decomposition rates, yet small absolute decomposition, when compared with other ecosystems with high detrital production, low decomposition rates, and large absolute decomposition.
The first studies that measured productivity and the flow of carbon focused on individual ecosystems. These studies sought to characterize the transfer of carbon between trophic levels with the goal of understanding how energy moved through an ecosystem. The pioneering studies of Howard T. Odum in freshwater springs in Florida and John M. Teal in the salt marshes of Georgia are classic examples of this early work.
Later studies sought to understand what factors limited net primary production and decomposition by investigating differences in these processes across environmental gradients within the same type of ecosystem. These studies led to now-well-known patterns being established. Annual precipitation is a major determinant of net primary production in grassland ecosystems in arid regions across the Great Plains of the United States. In eastern deciduous forests in the United States, net primary production increases as the length of the growing season increases. In the mountains of Hawaii, net primary production and decomposition rates are positively associated with temperature along an elevation gradient. In aquatic ecosystems, light and nutrient availability frequently limit net primary production.
These studies and their successors have led to a growing body of work measuring net primary production, herbivory, detrital production, decomposition, and the nutritional content of both producers and detritus across a variety of aquatic and terrestrial ecosystems. Such a wealth of data can be extremely useful for detecting more general trends in productivity and how carbon flows through ecosystems.
Researchers have compiled published values of net primary production, herbivory, decomposition, and producer and detrital nutrient content for aquatic and terrestrial ecosystems into large data sets. In assembling such comprehensive data sets, the researchers need to ensure that the values compiled reflect adequately the ecosystems examined. To do so, the values entered into the data set must include the most abundant species of producers and consumers in the ecosystem and encompass at least a year or the entire growing season. In addition, when making comparisons of productivity and carbon flow across a wide range of ecosystems and using data from multiple studies, we must deal in a common currency or unit. The most common unit of choice is grams of carbon or “g C.” Last, researchers need to ensure that the conclusions obtained from multistudy data sets are not compromised by the uncertainty that results from compiling values from studies that use different methods, assumptions, and sample sizes. Metaanalysis and estimation of error propagation are two examples of techniques that allow researchers to test the robustness of conclusions obtained from literature comparisons.
Having discussed the nature of carbon budgets and the rationale behind developing ecosystem carbon budgets as well as assembling this information into larger data sets, we now consider the general patterns in productivity and carbon flow that emerge from the analysis of these larger data sets. In this section, we analyze these patterns and flow by first exploring the overall differences between aquatic and terrestrial ecosystems and then exploring patterns within each type of ecosystem.
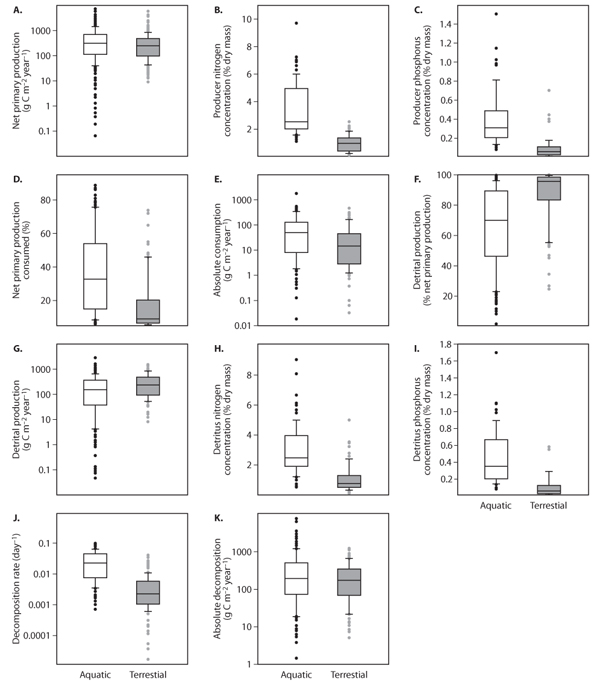
Net primary production in aquatic and terrestrial systems is highly variable, but production in both is similar (figure 2A). Aquatic ecosystems, however, do support greater carbon flow to herbivores, both as an absolute carbon flux and as a percentage of net primary production (figure 2D, E). Because herbivore production efficiency, the ratio of herbivore growth to carbon ingested, does not seem to vary significantly between aquatic and terrestrial systems, this greater absolute flux of producer carbon to herbivores implies that aquatic systems should support higher levels of herbivore production compared to terrestrial systems, as has recently been demonstrated.
The higher percentages of net primary production removed by herbivores in aquatic ecosystems suggest that herbivores are more influential in carbon and nutrient recycling and accumulation of producer biomass in aquatic ecosystems relative to their role in terrestrial ecosystems. Indeed, many of the examples of herbivores controlling producer biomass (i.e., top-down control) are from aquatic ecosystems, although on occasion herbivores are found to regulate producer biomass in terrestrial ecosystems as well. The evidence for herbivores as important agents of nutrient recycling in aquatic ecosystems is also abundant, whereas there is considerably less evidence for such a role for herbivores in terrestrial ecosystems, which tend to channel a higher percentage of net primary production into the detrital pathway.
figure 2. Box plots comparing aquatic and terrestrial ecosystems: (A) net primary production, (B) producer nitrogen concentration, (C) producer phosphorus concentration, (D) percentage of net primary production consumed, (E) absolute consumption, (F) detrital production as a percentage of net primary production, (G) detrital production, (H) detritus nitrogen concentration, (I) detritus phosphorus concentration, (J) decomposition rate, and (K) absolute decomposition. Boxes encompass 25th and 75th percentiles, and the central line is the median. Bars are 10th and 90th percentiles with measurements outside of these percentiles indicated by closed circles. Data set used to generate the box plots is from Cebrian and Lartigue (2004).
There are several possible explanations for the greater herbivory measured as an absolute flux of carbon or as a percentage of net primary production consumed in aquatic versus terrestrial ecosystems. One explanation is that primary producers in aquatic ecosystems tend to have higher nutrient concentrations than those in terrestrial ecosystems (figure 2B, C). There is growing evidence that the growth rates of aquatic and terrestrial herbivores are limited by the nutrient content of their diets (see chapter III.15). Under such a premise, herbivore metabolism and growth in aquatic ecosystems are promoted by a diet of higher nutritional quality, and higher rates of absolute consumption and larger percentages of net primary production removed by herbivores result. Indeed, aquatic ecosystems support greater herbivore standing stocks than do terrestrial ecosystems. Higher concentrations of structural, refractory compounds, such as lignin, in terrestrial producers could also lead to lower rates of herbivory in terrestrial ecosystems. Other compounds in the producers, such as fatty acids and digestible carbohydrates, and differences in the availability of nutrients in the producer for herbivore digestion may also affect the growth rates of herbivores and the intensity of her-bivory, but their role in explaining the differences in herbivory observed between aquatic and terrestrial ecosystems requires further research. Herbivore behavior, size, energy demands (endothermy versus ectothermy), and predation intensity as well as other factors may also have an impact on herbivory intensity and supersede the expected effects of producer nutritional quality, especially when only few ecosystems are being compared.
Because net primary production differs little between aquatic and terrestrial ecosystems, and herbivory is greater in aquatic ecosystems, aquatic ecosystems tend to transfer a smaller flux of producer carbon, both in absolute terms and as a percentage of net primary production, to the detrital pathway than do terrestrial ecosystems (figure 2F, G). However, most net primary production in both types of ecosystem is not consumed by herbivores and enters the detrital compartment.
The higher nutrient concentrations of aquatic producers compared to terrestrial producers carry over into the detrital compartment as well, where aquatic detritus has higher nutrient concentrations than terrestrial detritus (figure 2H, I). Aquatic detritus also decomposes at a faster rate than does terrestrial detritus (figure 2J), possibly because microbial decomposers and invertebrate and vertebrate detritivores, like herbivores, appear limited in their metabolism and growth rate by the nutrient concentrations of their diets. With higher-quality detritus to consume, aquatic decomposers and detritivores should generally have higher metabolic and growth rates than their terrestrial counterparts leading to faster decomposition rates in aquatic than in terrestrial ecosystems. In other words, the greater nutritional detritus found in aquatic ecosystems leads to more active decomposers and detritivores and faster decomposition rates in comparison with terrestrial ecosystems. And indeed, comparisons have often found faster decomposition rates in aquatic than in terrestrial ecosystems despite substantial environmental variability between the two types of ecosystem.
Faster decomposition rates in aquatic systems indicate faster rates of nutrient recycling through the detrital pathway. This is supported by evidence of faster turnover rates of nutrients through the detrital pool in aquatic ecosystems compared to terrestrial ecosystems. In addition, faster decomposition rates in aquatic ecosystems along with lower detrital production imply the accumulation of smaller standing stocks of detritus in comparison with terrestrial ecosystems.
However, aquatic and terrestrial ecosystems show similar values of absolute decomposition despite the higher decomposition rates found in the former systems (figure 2K). The reason for this lies in the interplay between detrital production and decomposition rates; aquatic ecosystems produce less detritus than terrestrial ecosystems, but it decomposes faster. As a consequence, absolute decomposition, which corresponds to the product between detrital production and decomposition rate, remains similar between the two types of ecosystem. Because the efficiency of decomposer and detritivore production does not differ between aquatic and terrestrial ecosystems, aquatic and terrestrial ecosystems should support similar amounts of decomposer and detritivore production. Interestingly, aquatic ecosystems feature lower standing stocks of decomposers and detritivores than do terrestrial ecosystems, pointing to higher rates of predation on decomposers and detritivores in the former ecosystems.
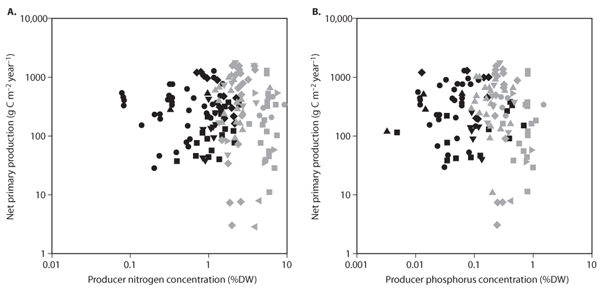
We now move from discussion of differences between aquatic and terrestrial ecosystems to consideration of patterns within each type of ecosystem. Net primary production and producer nutrient concentrations are uncorrelated within aquatic and within terrestrial ecosystems. The identification of such a general independence may seem surprising at first (figure 3A, B). Indeed, many fertilization experiments have shown that increased nutrient availability often leads to increased nutrient concentrations in producer biomass and higher levels of net primary production in aquatic and terrestrial ecosystems. This independence likely stems from the large environmental variability encompassed when a large range of ecosystems are compared within the aquatic or terrestrial realm. Growth limitation by light and temperature, water availability (in terrestrial ecosystems), wave action (in aquatic ecosystems), and other types of environmental stress may very well prevent a positive association between producer nutrient concentrations and net primary production over a broad range of ecosystems.
Figure 3. Net primary production from aquatic (gray symbols) and terrestrial (black symbols) ecosystems plotted against producer (A) nitrogen concentration and (B) phosphorus concentration. The aquatic communities represented are freshwater phytoplankton (gray circles), marine phytoplankton (gray squares), freshwater benthic microalgae (gray left-pointing triangles), marine benthic microalgae (gray right-pointing triangles), marine macroalgae (gray diamonds), freshwater submerged macrophytes (gray down-pointing triangles), and seagrass (gray up-pointing triangles). The terrestrial communities represented are tundra shrubs and grasses (black down-pointing triangles), freshwater and marine marshes (black diamonds), temperate and tropical shrublands and forests (black circles), temperate and tropical grasslands (black squares), and mangroves (black up-pointing triangles). (Adapted from Cebrian and Lartigue, 2004)
Aquatic and terrestrial ecosystems composed of producers with higher nutrient concentrations do tend to have a greater percentage of net primary production removed by herbivores (figure 4A, B) despite contrasting natures (invertebrate versus vertebrate), metabolic patterns (ectothermy vesus endothermy), behavior (migratory versus resident), and feeding specificity (specialized versus generalized) of the herbivore populations in the ecosystems compared. As is the case for the general comparison between aquatic and terrestrial ecosystems, this relationship within each type of ecosystem is likely fueled by the growth rates of aquatic and terrestrial herbivores, which are often limited by the nutrient content of their diets. On this basis, producers with higher nutrient concentrations lead to faster herbivore growth rates and larger percentages of net primary production consumed. It follows that, regardless of whether aquatic or terrestrial ecosystems are considered, herbivores should exert a greater control on producer biomass accumulation and carbon and nutrient recycling in ecosystems composed of producers with higher nutrient concentration.
Although there is a positive association between producer nutrient concentration and the percentage of net primary production consumed by herbivores in aquatic ecosystems, herbivory measured as an absolute flux of producer carbon to herbivores is only poorly associated with producer nutrient concentration (figure 4C, D). Absolute consumption is, however, strongly associated with the absolute magnitude of net primary production (figure 4E) in aquatic ecosystems. In other words, more productive aquatic ecosystems, but not aquatic ecosystems having producers with higher nutrient concentrations, support greater absolute consumption by herbivores. This pattern stems from the interaction between the variability in net primary production and the variability in the percentage consumed within aquatic ecosystems (figure 4F). A higher percentage of net primary production is lost to herbivores in aquatic ecosystems comprised of producers with higher nutrient concentrations. However, this percentage varies little compared to the much larger differences in net primary production within aquatic ecosystems. As a result, absolute consumption, which is the product of net primary production and the percentage consumed by herbivores, remains more closely associated with net primary production and only poorly associated with the percentage consumed and producer nutrient concentrations. An implication of these patterns is that aquatic ecosystems with higher net primary production, and not those composed of more nutritional producers, transfer more producer carbon to herbivores and, because the efficiency of herbivore production does not seem to vary consistently across ecosystems, also support higher herbivore production.
Figure 4. The relationship between herbivory and producer nutrient concentrations or net primary production in aquatic and terrestrial ecosystems: (A) percentage consumed versus producer nitrogen concentration (dashed line, aquatic ecosystems regression, R2 = 0.37; solid line, terrestrial ecosystems regression, R2 = 0.40), (B) percentage consumed versus producer phosphorus concentration (dashed line, aquatic ecosystems regression, R2 = 0.44; solid line, terrestrial ecosystems regression, R2 = 0.65), (C) absolute consumption versus producer nitrogen concentration (solid line, terrestrial ecosystems regression, R2 = 0.38), (D) absolute consumption (solid line, terrestrial ecosystems regression, R2 = 0.64), (E) absolute consumption versus net primary production (dashed line, aquatic ecosystems regression, R2 = 0.66; solid line, terrestrial ecosystems regression, R2 = 0.25), and (F) absolute consumption versus net primary production. Symbols are the same as in figure 3. (Adapted from Cebrian and Lartigue, 2004)
A different situation exists within terrestrial ecosystems, where absolute consumption is positively associated with producer nutrient concentration but less so with net primary production. Again, the explanation lies in the interaction between the variability in net primary production and the variability in the percentage consumed within terrestrial ecosystems (figure 4F). Within terrestrial ecosystems, net primary production varies to a lesser degree than does the percentage consumed, and, as a result, absolute consumption remains more closely associated with the percentage consumed and, by extension, with producer nutrient concentration than with net primary production. Therefore, terrestrial ecosystems composed of producers with higher nutrient concentrations, in addition to supporting a greater impact by herbivores on the accumulation of producer biomass and carbon and nutrient recycling, transfer a greater flux of producer carbon to herbivores and should have higher levels of herbivore production. Recent work, however, has shown that herbivore production is positively related to net primary production in terrestrial ecosystems because absolute consumption and net primary production are positively related, albeit not strongly, within these ecosystems.
Because most net primary production enters the detrital compartment in both aquatic and terrestrial systems, detrital production is strongly associated with net primary production within each type of system. Conversely, detrital production is unrelated to detritus nutrient concentration within each type of ecosystem. This lack of association stems from the independence between net primary production and producer nutrient concentration. Within both aquatic and terrestrial ecosystems, the nutrient concentration of producers changes little through senescence in relation to the variability among producers. This, along with the strong association between detrital production and net primary production within each type of ecosystem, explains why the independence between net primary production and producer nutrient concentration drives the independence between detrital production and detritus nutrient concentration.
Detritus with higher nutrient concentrations tends to exhibit faster decomposition rates within both aquatic and terrestrial ecosystems, although the trend is not always strong (figure 5A, B). Yet this association is relevant given the substantial environmental variability that may exist among ecosystems and the contrasting effects on decomposition rates that result from differing levels of temperature, soil or sediment reduction-oxidation reaction conditions, and, in terrestrial systems, moisture.
The association between faster decomposition rates and more nutritional detritus found within ecosystems, regardless of whether these are aquatic or terrestrial, probably results from the limitation exerted by the nutrient content of the detritus on the metabolic and growth rates of decomposers and detritivores; higher nutrient concentrations in the detritus stimulate the metabolic and growth rates of these organisms, resulting in faster decomposition rates. Two important corollaries follow. First, ecosystems with more nutritional detritus, regardless of whether they are aquatic or terrestrial, should feature faster nutrient recycling rates through the detrital pathway. Second, ecosystems with more nutritional detritus should also accumulate smaller detrital pools provided the differences in decomposition rates among ecosystems exceed the differences in detrital production.
Despite the association between faster decomposition rates and higher detritus nutrient concentrations within both aquatic and terrestrial ecosystems, decomposition when viewed as an absolute flux is independent of detritus nutritional quality (figure 5C, D). Instead, absolute decomposition is strongly associated with detrital production and net primary production within either type of ecosystem (figure 5E). The reason for this pattern lies in the interaction between the variability in detrital production and the variability in the percentage of detrital production decomposed within a year among ecosystems (figure 5F). In aquatic ecosystems, and to a lesser degree in terrestrial ecosystems, detrital production varies to a larger extent among ecosystems than does the percentage decomposed. As a consequence, absolute decomposition, which corresponds to the product of detrital production and the percentage decomposed, remains closely associated with detrital production and net primary production and independent of the percentage of detrital production decomposed. Because the percentage of detrital production decomposed is a surrogate for decomposition rates, absolute decomposition also remains unrelated to decomposition rates and, by extension, to detritus nutrient concentration when either aquatic or terrestrial ecosystems are compared. Therefore, aquatic and terrestrial ecosystems with higher primary and detrital production, and not those having more nutritional detritus, transfer more detrital carbon to decomposers and detritivores and, because the efficiency of decomposer and detritivore production varies little across ecosystems, support higher decomposer and detritivore production.
Figure 5. The relationship between decomposition and detritus nutrient concentration or detrital production in aquatic and terrestrial ecosystems: (A) decomposition rate versus detritus nitrogen concentration (dashed line, aquatic ecosystems regression, R2 = 0.21; solid line, terrestrial ecosystems regression, R2 = 0.46), (B) decomposition rate versus detritus phosphorus concentration (dashed line, aquatic ecosystems regression, R2 = 0.34; solid line, terrestrial ecosystems regression, R2 = 0.54), (C) absolute decomposition versus detritus nitrogen concentration, (D) absolute decomposition versus detritus phosphorus concentration, (E) absolute decomposition versus net primary production (dashed line, aquatic ecosystems regression, R2 = 0.84; solid line, terrestrial ecosystems regression, R2 = 0.76), and (F) decomposition rate versus detrital production. Horizontal dashed lines and percentages indicate the percentage of detrital production that would be decomposed within a year at the given decomposition rate. Symbols are the same as in figure 3. (Adapted from Cebrian and Lartigue, 2004)
Producer nutritional quality and net primary production are two independent predictors of herbivory and decomposition in aquatic and terrestrial ecosystems. Herbivory, expressed as the percentage of net primary production consumed by herbivores, and decomposition, expressed as the proportion of detrital mass consumed per day by decomposers and detritivores, are positively associated with producer nutrient concentration but independent of net primary production, regardless of whether the comparison is done between aquatic and terrestrial ecosystems or within each type of ecosystem. Thus, producer nutrient concentration, and not net primary production, stands out as a potential indicator of top-down regulation of the pools of producer biomass and detritus and nutrient and carbon recycling rates by first-order consumers in ecosystems. The reverse situation is often found when herbivory and decomposition are expressed as absolute fluxes, which are then positively associated with net primary production but independent of producer nutrient concentration because net primary production often varies to a larger extent than does the percentage consumed by herbivores or decomposed across a broad range of ecosystems. Therefore, net primary production, and not producer nutrient concentration, is often the indicator of secondary production (i.e., production of herbivores and consumers of detritus) in ecosystems.
Cebrian, Just. 1999. Patterns in the fate of production in plant communities. American Naturalist 154: 449–468.
Cebrian, Just. 2004. Role of first-order consumers in ecosystem carbon flow. Ecology Letters 7: 232–240. Investigates herbivore and decomposer and detrivore biomass and their impact on the turnover of producer-fixed carbon in aquatic and terrestrial ecosystems.
Cebrian, Just, and Julien Lartigue. 2004. Patterns of herbivory and decomposition in aquatic and terrestrial ecosystems. Ecological Monographs 74: 237–259. A more detailed and technical discussion of the patterns in productivity and decomposition discussed in the chapter.
Odum, Howard T. 1957. Trophic structure and productivity of Silver Springs, Florida. Ecological Monographs 27: 55112.
Sterner, Robert W., and James J. Elser. 2002. Ecological Stoichiometry: The Biology of Elements from Molecules to the Biosphere. Princeton, NJ: Princeton University Press. An introduction to the discipline of ecological stoichiometry—the study of the balance of elements and energy in ecological interactions.
Teal, John. 1962. Energy flown in the salt marsh ecosystem of Georgia. Ecology 43: 615–624.