3.1
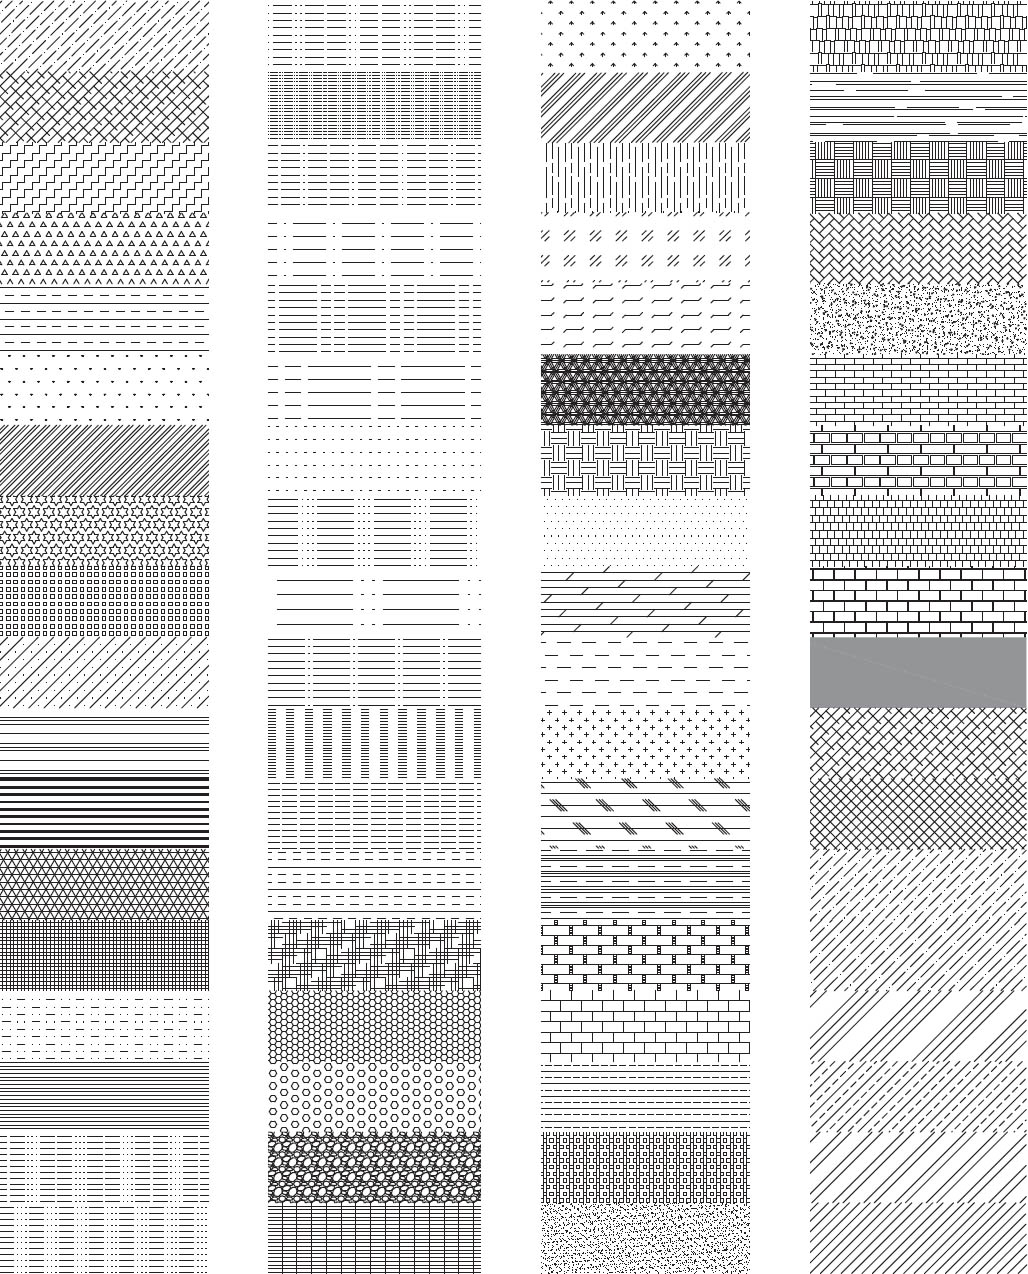
Jill Desimini, Hatch Typologies, 2014.
Lines, often short, following the direction of maximum slope, which in a series indicate shadow, relief, and texture.
Hachures—lines that perpendicularly fill the space between contours—are used to indicate slope and shadow in cartography. Designed as a reproducible alternative to tonal shading, the system is simple and effective. Despite advances in printing technology, the hachure refuses to go away completely. Through experimentation, this tried and true technique remains a means to depict terrain and shadow.
In design culture, the hachure equivalent is the hatch, both of which derive from engraving. The hatch, originally a series of closely spaced parallel lines used to create shading, has evolved into patterned swatches of dots, lines, and shapes in architectural drawing practice. [FIG. 3.1] Rather than being used to describe shadow or topographic relief, the hatch describes textural and material qualities. Through time, specific marks have come to represent specific construction materials—for example, stipples and small triangles for concrete—producing a clear language shared among designers and builders. As a technique, the hatch is a close relative of the hachure; but as a concept deployed in plan and section, its cartographic cousin is found among land-classification techniques (SEE CHAPTER 05).
In cartography, the caterpillar-like forms of early hachures descend from a pictorial tradition of representing relief where hills and mountains were drawn in elevation (SEE CHAPTER 04). These shapes were drawn intuitively and did not adhere to precise rules. Yet, despite the generalization of form in these early hachures, they mark a transitional moment of greater measure and precision in topographic representation, when surveying and drawing techniques advanced to better reflect the geographic location of key physical features.
With time, hachures were derived directly from contours, following clear rules and becoming less subjective and dramatic. Two remarkably simple yet powerful systems emerged: slope hachuring and shadow hachuring. Johann Georg Lehmann, a Saxon military cartographer, is the father of the slope-hachure system that, according to Imhof, successfully tamed the “hachuring chaos.”1 Contours formed the basis of his system with evenly spaced hachures drawn strictly perpendicularly to contours and therefore in the direction of the steepest slope. Slope angle determined the thickness of the line or relationship of black to white. The steeper the angle is, the greater the percentage of black present and the darker the area of the drawing. With shadow hachures, the illuminated side has thin lines, and the shade side has bolder lines. Mountainous forms roll like ripples in fabric. While the hachured landform is instantly visible, graphic keys accompanied hachures in atlases, translating slope angle to hachure spacing. The resultant maps show how a concise system of lines alone can yield a rich depiction of the ground plane.
The representation of hachures is experimental yet restrained. Color is rarely used, and when it is, a neutral brown tone is usually elected for all hachures. In even rarer cases, a variety of colors is used to represent differing elevations or ground conditions. Thus, experimentation occurs in the way lines are used to describe the form, rather than in the graphic variations of the lines themselves. For example, in situ cross sections (SEE CHAPTER 08), considered a form of hachure that does not follow the direction of the steepest gradient, use the technique of cutting tight sectional slices through the landform to represent terrain. The result describes the topography with a series of closely spaced sections that are geographically positioned in plan. With the increase of two-dimensional line work being generated from digital three-dimensional modeling in design, representing topography through nontraditional contouring and hachuring has become prevalent.
Cartographically speaking, however, the hachure still has limitations. Given that lines are drawn perpendicular to the contours, significant generalization of the landform geometry is required for legibility. Tight contour radii, showing rocky and rough terrain, must be smoothed to avoid hachure overlap. Thus, the contour alone, the skeletal backbone of the hachure, is a more precise articulation of topography. With the ability to produce even tones between contours, the hypsometric tint and shaded relief offer smoother readings of form and shadow. In spite of these limitations, the hachures demonstrate the power of the line alone and the ability to achieve complexity through restraint. The beauty of the hachure, as evidenced by the following examples, is found in simple variation and repetition of a single element. The representation does not overshadow the landscape it emulates but rather reveals it in a discerning manner. To date, the cartographic hachure, with centuries of refinement and harmonious abstraction, is a more sophisticated representational tool than the architectural hatch, whose patterns can be coarse and tend to verisimilitude. This chapter argues for an elevation of the hatch in design drawing through a stronger alignment with the hachure and its rich past.
1Eduard Imhof, Cartographic Relief Presentation (Redlands, CA: Esri, 2007), 111.
3.3
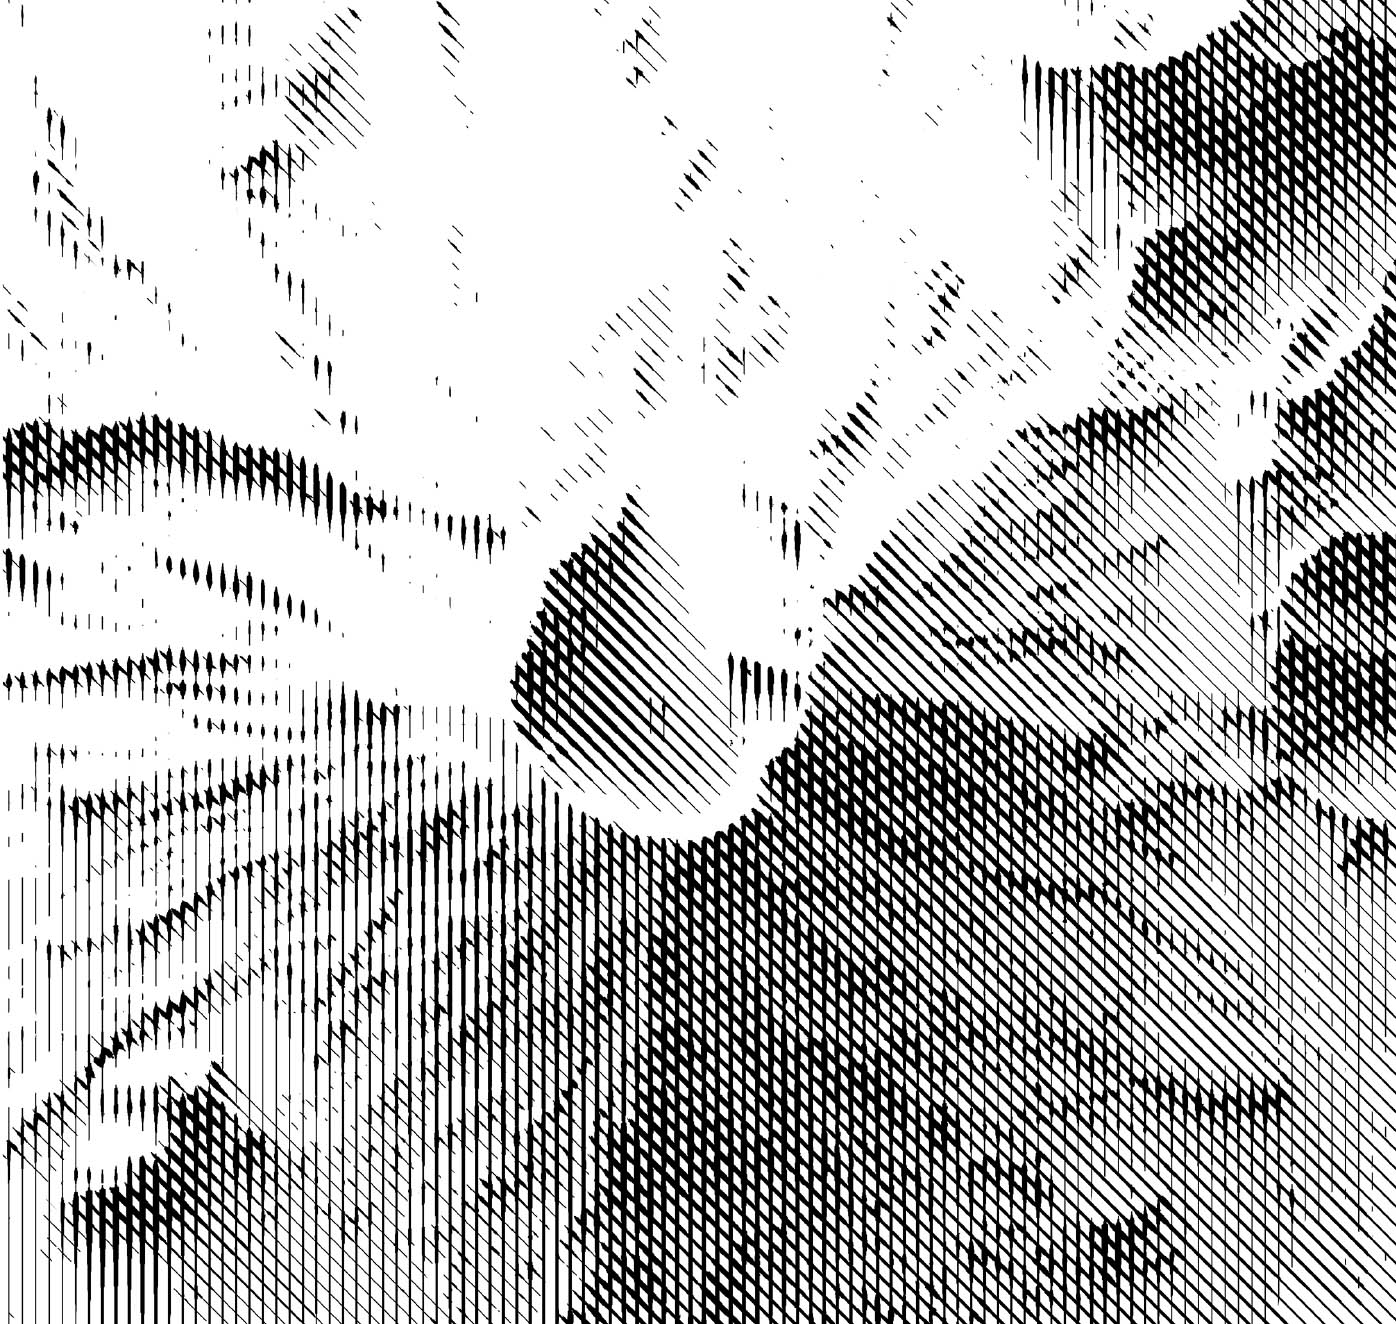
46.2000° N, 122.1892° W, Patrick Kennelly, Mount Saint Helens, 2011. Scale: approx. 1:15,000 (shown at full size). Originally published in “Cross-Hatched Shadow Line Maps,” The Cartographic Journal 49, no. 2 (May 2012): 135–42.
American geographer Patrick Kennelly’s cross-hatched shadow line maps do not represent terrain with the traditional hachure; rather, they show only the shadows cast by landforms through a parametrically varied cross-hatch mark. His maps are hybrids, using multiple terrain drawing techniques. Angle illumination determines the length and thickness of the lines (a higher angle yields a thicker and longer line). The cross-hatch is the descendant of the hachure and the hatch but recognizes the inherent difficulty in representing the continuity of terrain through discontinuous lines.
3.4
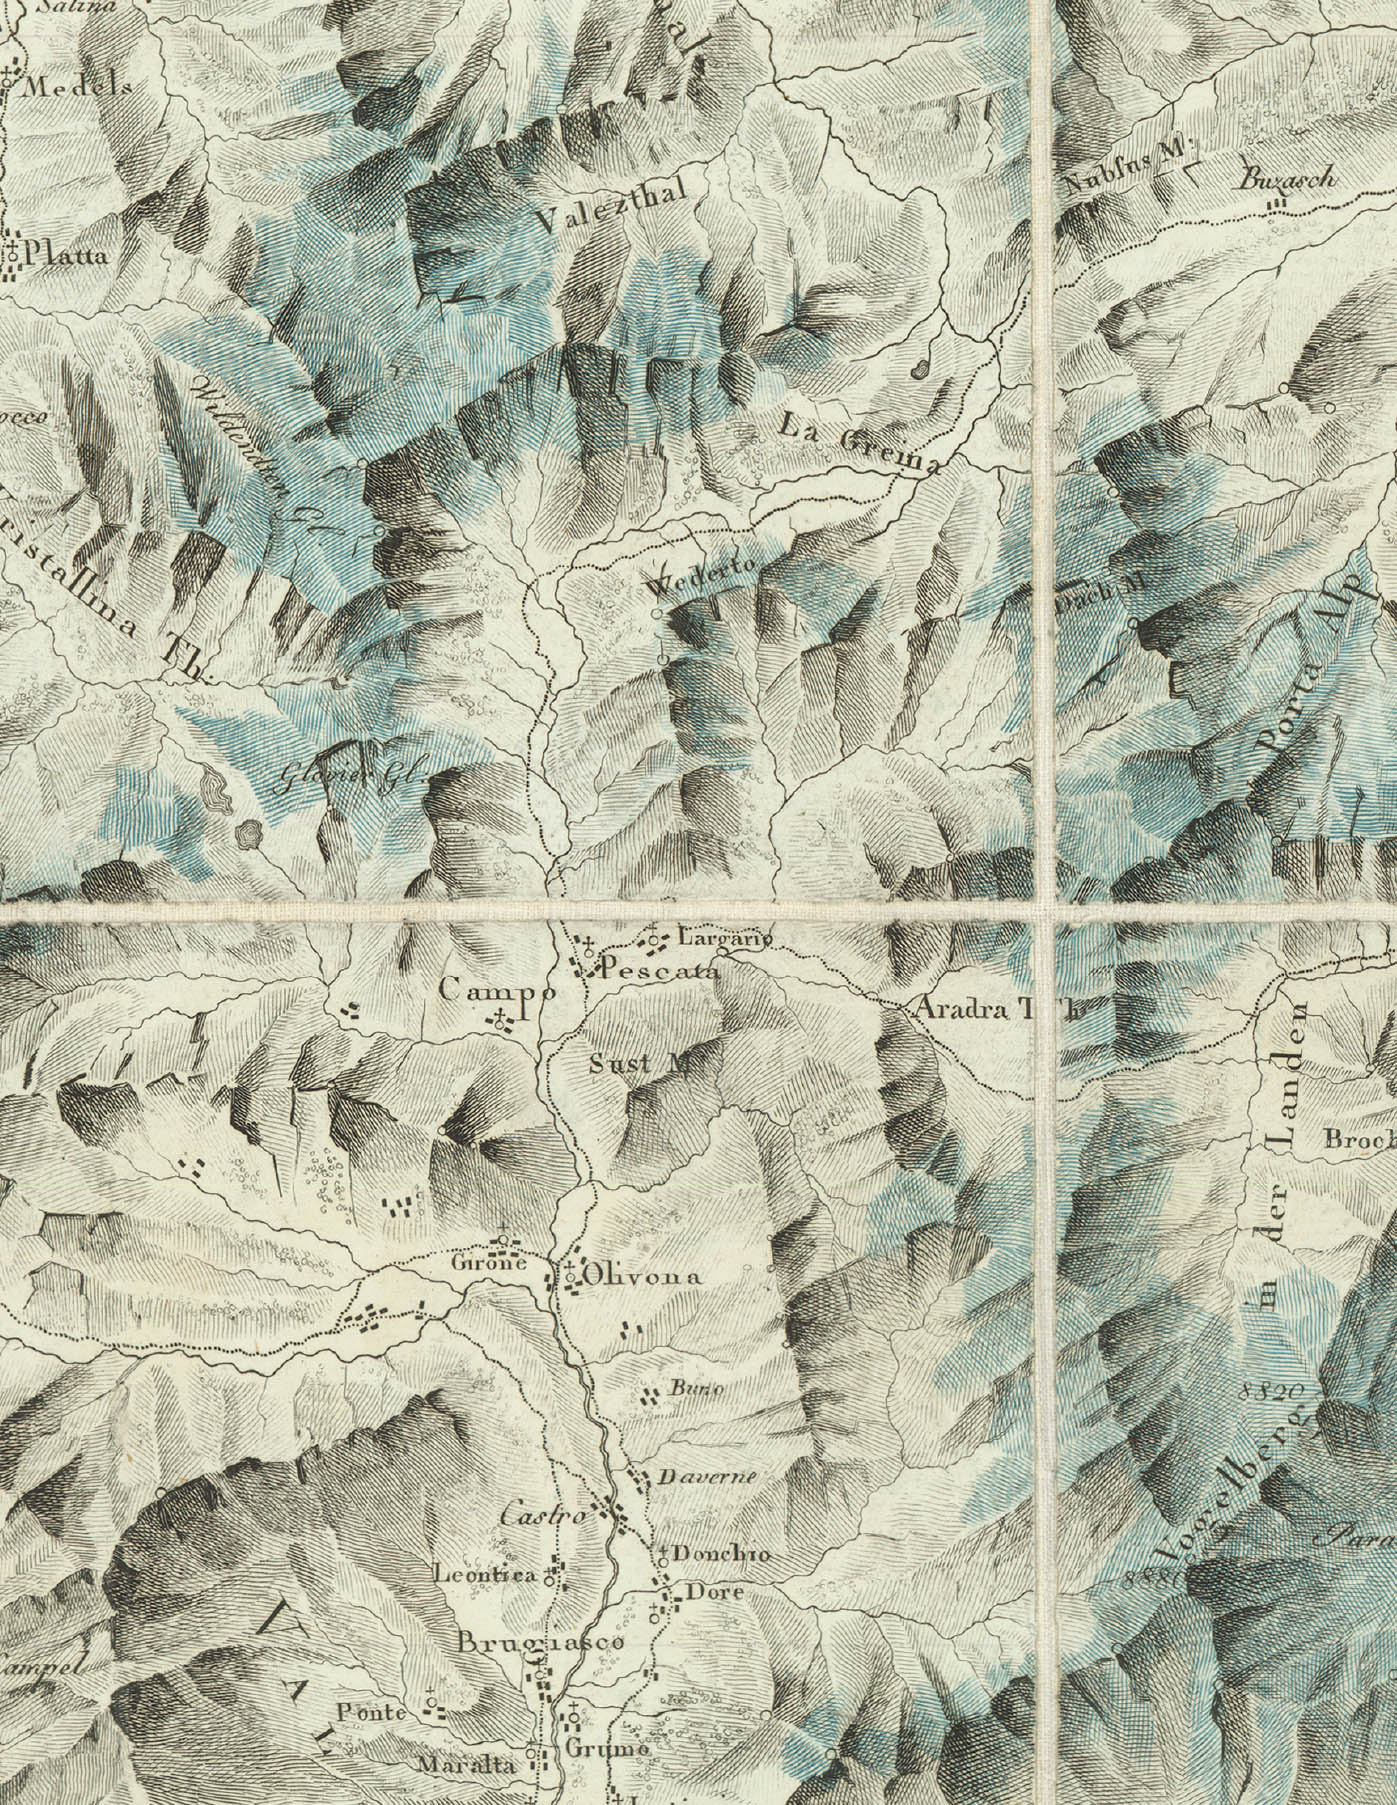
46.5592°N, 8.5614°E, Johann Heinrich Weiss, Atlas Suisse. Le mont Gotthard et partie des Grisons, 1786–1802. Scale: 1:120,000 (shown at full size).
Maps are collaborative efforts. The Atlas Suisse was the vision of the wealthy industrialist Johann Rudolf, who after seeing the Pfyffer relief model [FIG. 3.6] was inspired to commission a modeling and mapping project to further describe the Alps. The final map is the creation of Johann Heinrich Weiss, who used a terrain model built by Joachim Eugen Müller as the basis for his hachured terrain rendering. This pre-trigonometric survey atlas relied on modeling to understand the mountain forms and to guide the representation of them. Relief is represented through horizontal depiction, oblique lighting, and hachuring. The hachures—unlike later, more systematic examples—are random. They are not always drawn perpendicular to the contours; they cross in instances, and their gradation is not even.
3.5
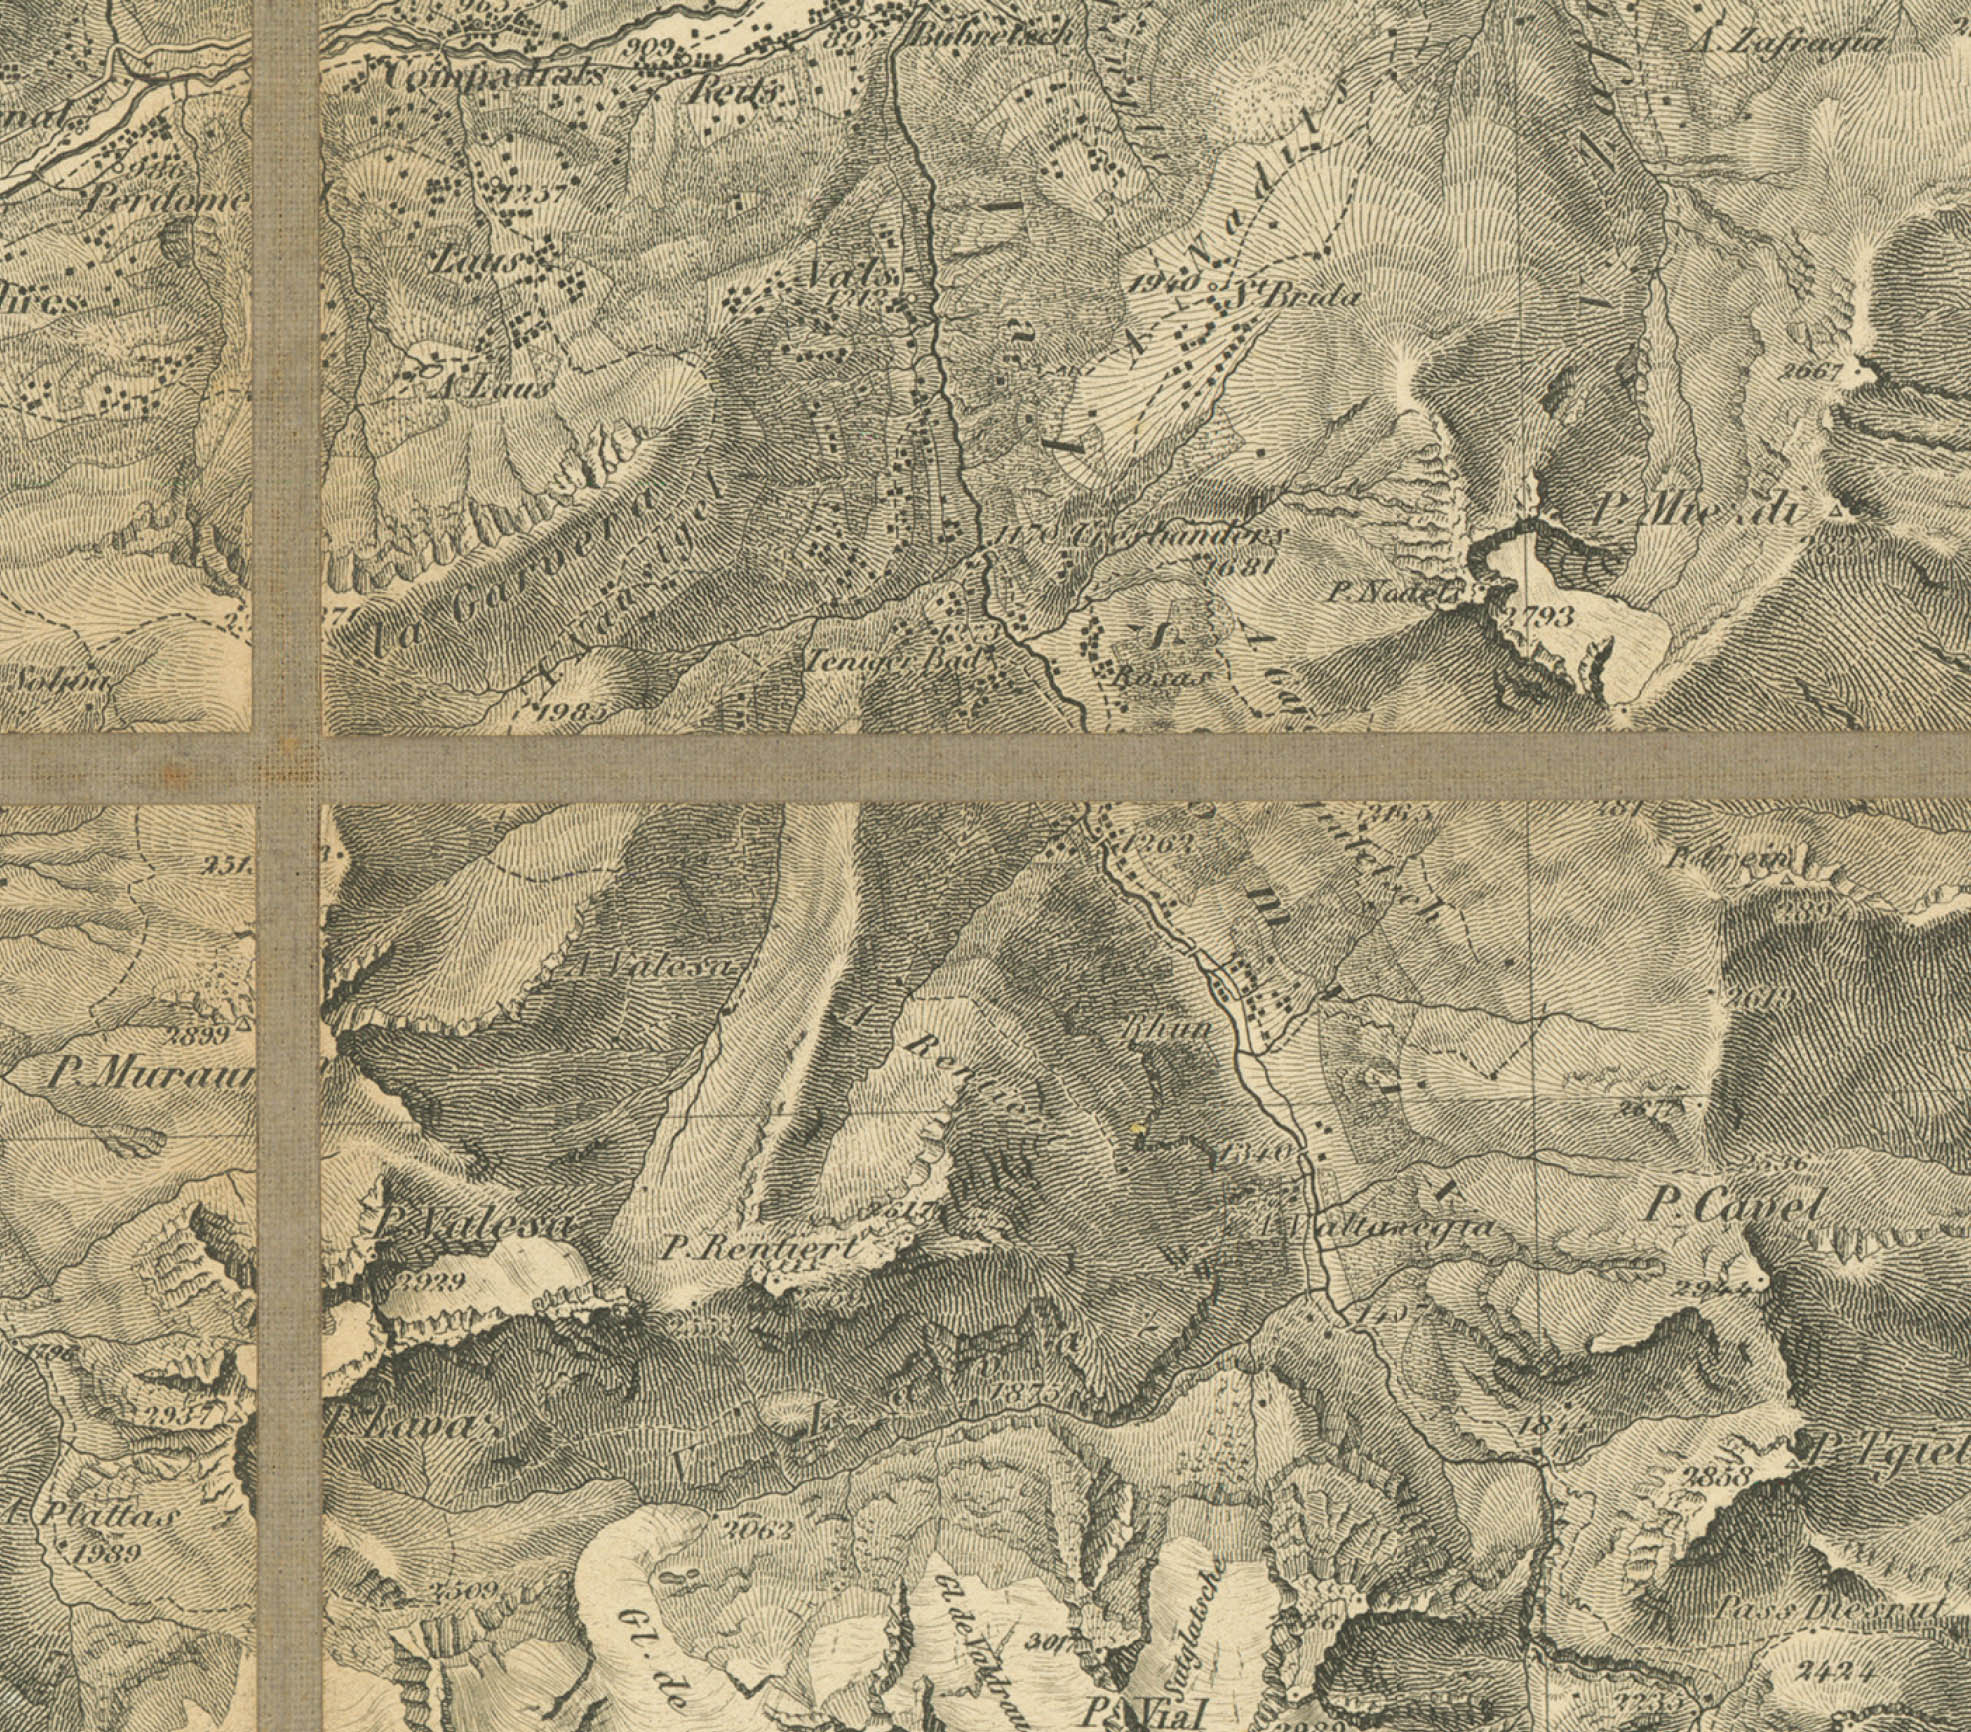
46.5592°N, 8.5614°E, Guillaume-Henri Dufour, Topographische Karte der Schweiz, 1833–63.
Topographische Karte der Schweiz, more commonly known as the Dufourkarte, is the canonical example of the shadow hachure technique. As director of the Eidgenössische Topographischen Bureau between 1832 and 1864, Guillaume-Henri Dufour guided the creation of this first state-sponsored topographical map of Switzerland. Drawn from numerous trigonometric surveys, the Dufourkarte is a unified work in twenty-five sheets, allowing for the complete visualization of the entire country, setting the precedent for subsequent Swiss mapping endeavors. The early drafts of the Dufourkarte include contours, color, and detail up to a scale of 1:50,000, but the published version is streamlined and monochromatic, highlighting the Swiss topography exclusively with hachures.
3.6
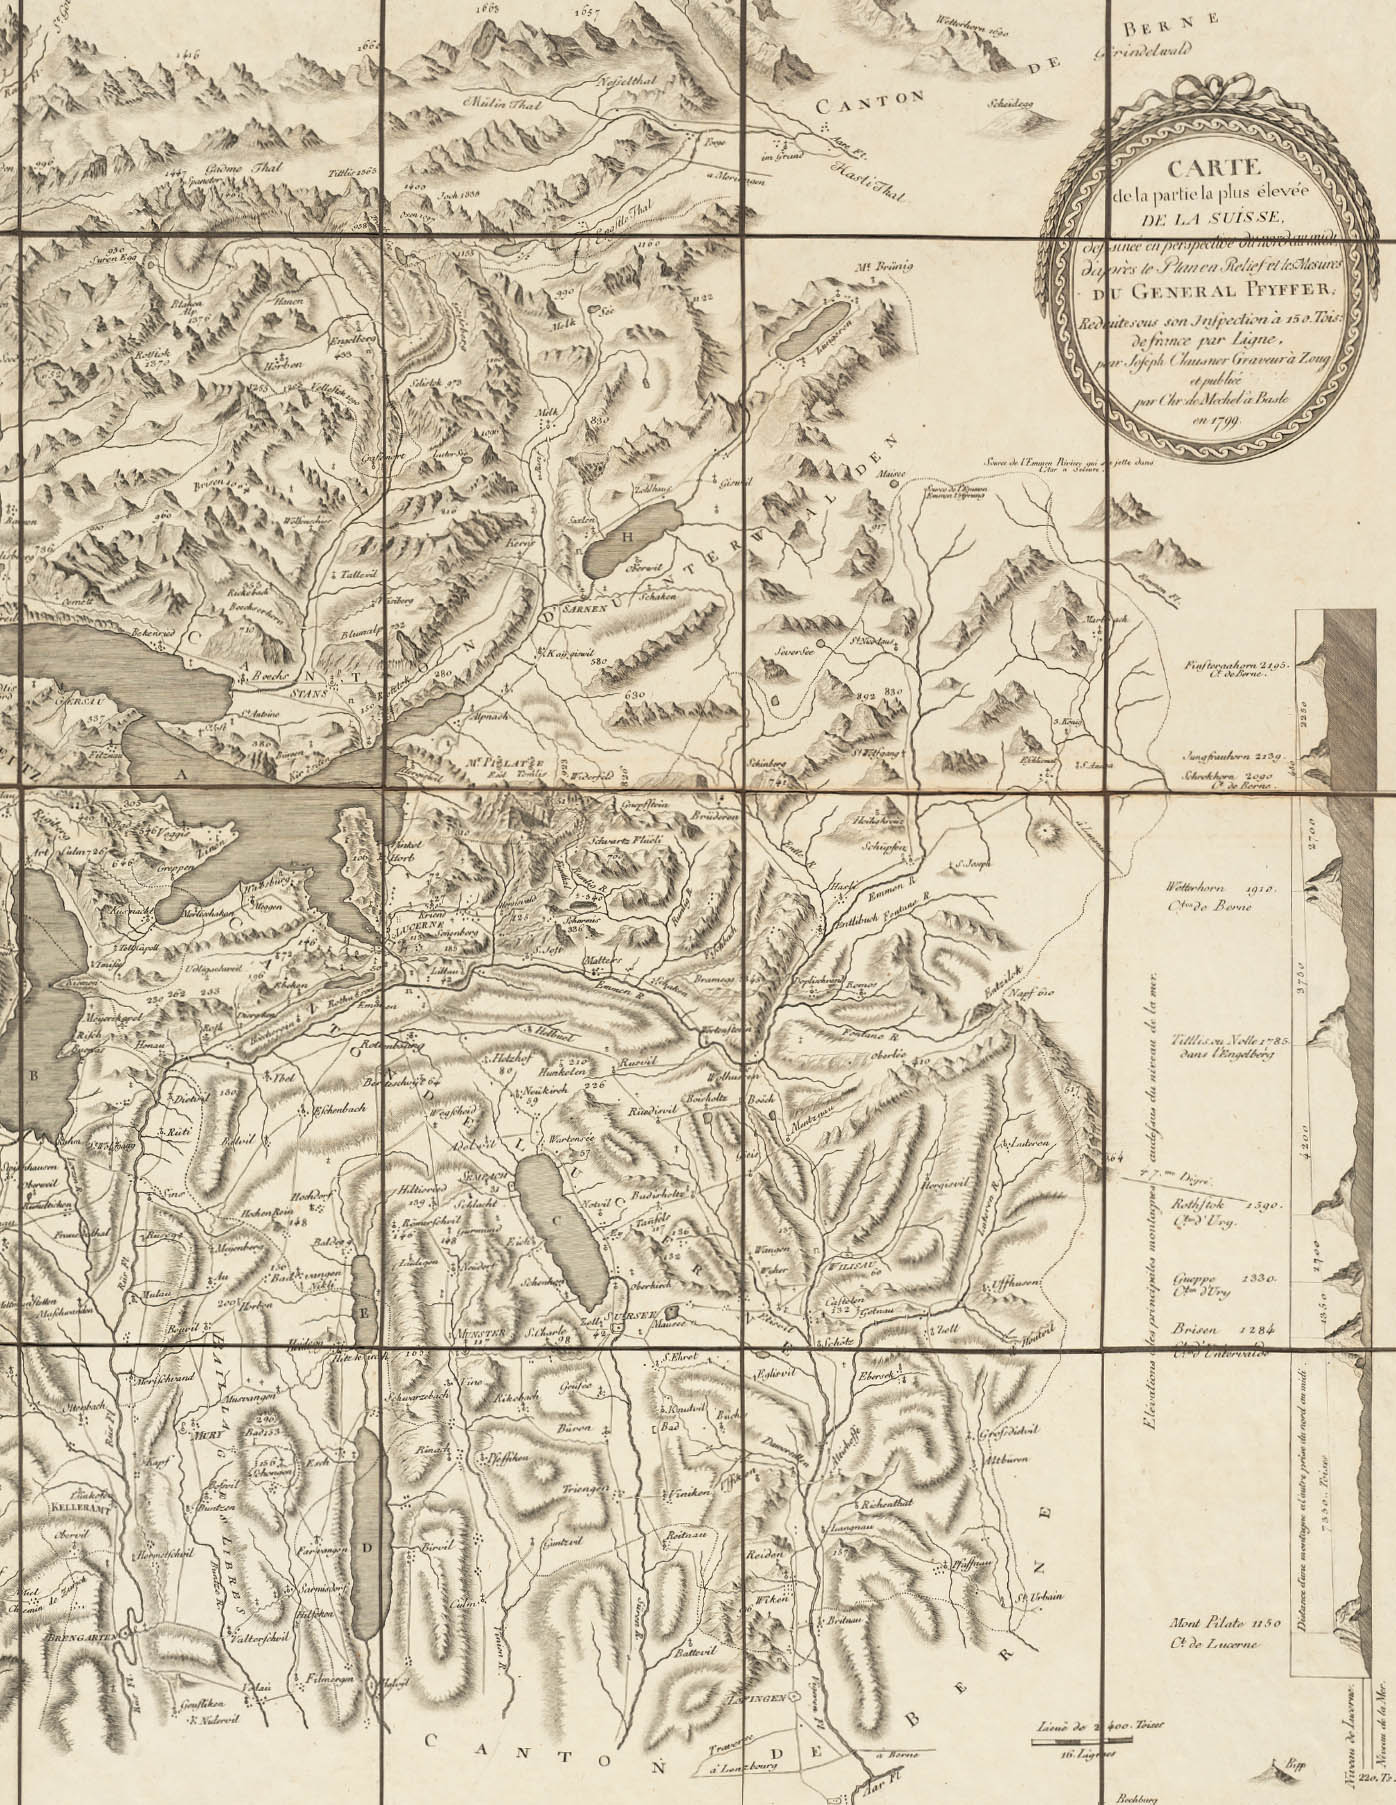
46.8637° N, 8.1028° E, Joseph Clausner, Carte de la partie la plus élevée de la Suisse, 1799. Scale: approx. 1:150,000 (shown at half size).
This map of the high Central Alps is an early example of the translation of landscape model to plan. The model, built by Franz Ludwig Pfyffer, was impressively large, measuring nearly 13 by 22 feet at a scale of 1:11,500. The resultant map, drawn by Joseph Clausner, uses a combination of more pictorial methods to represent dramatic landforms and caterpillar-like hachures for areas of lesser relief. The drawn forms were supplemented with spot elevations, a very early use of this technique and evidence of measurements behind the drawing.
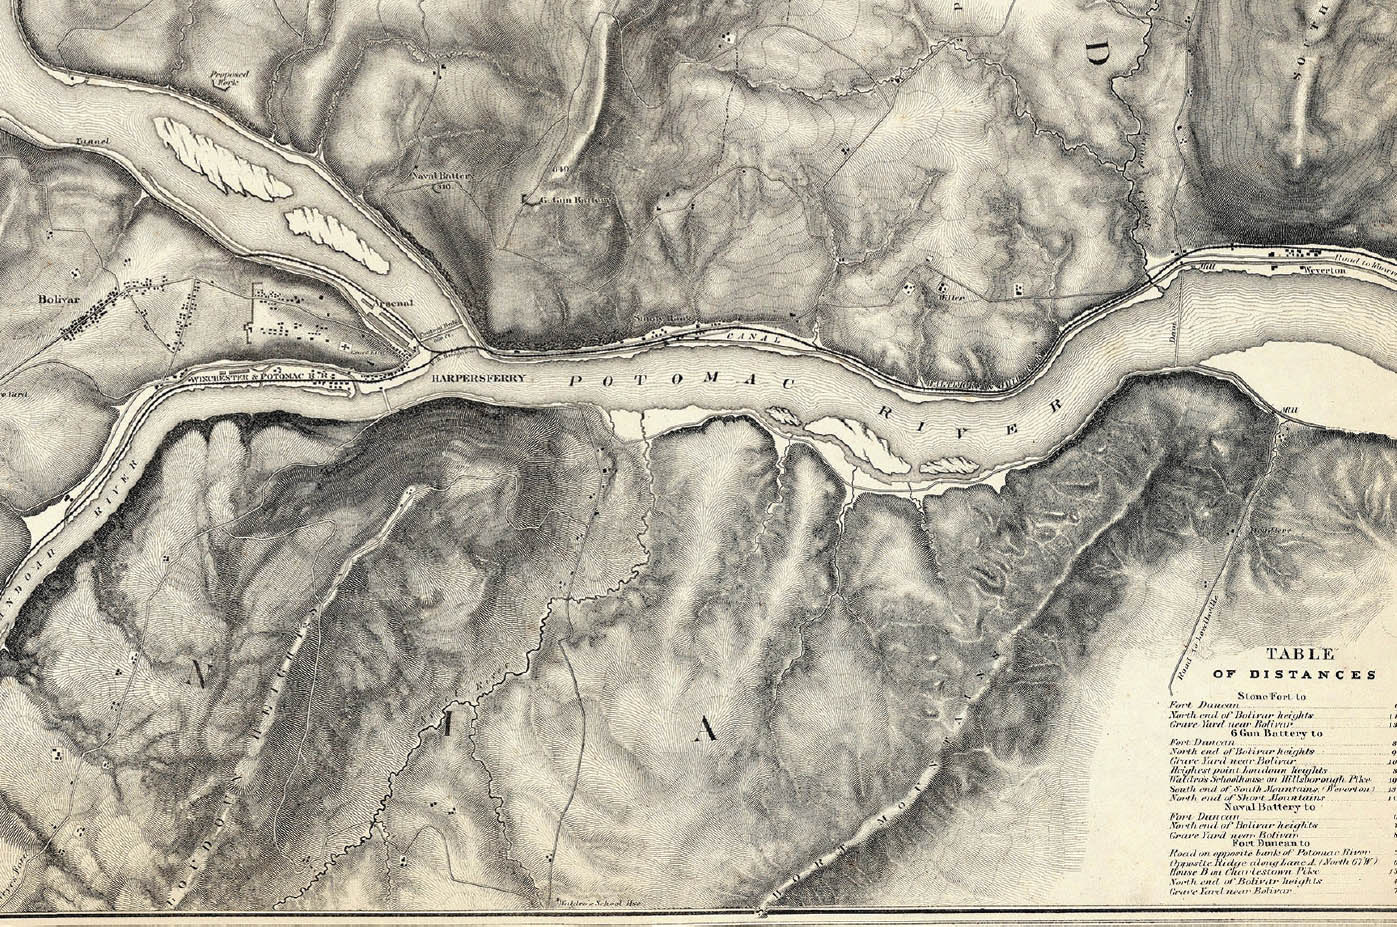
3.7
39.3253° N, 77.7392° W, John E. Weyss, Military Map Showing the Topographical Features of the Country Adjacent to Harper’s Ferry, Virginia, 1863. Scale: 1:15,840 (shown at half size).
The Weyss map of Harper’s Ferry, Virginia, has exemplary slope hachures. Closely derived from contours, the hachures follow the standard rules of hachuring: they are drawn in the direction of the steepest slope gradient, form rows perpendicular to the contour, and have consistent spacing within rows. Thicker lines represent steeper slopes, and the overall density is uniform across the map. The system of short, monochromatic lines effectively indicates the slope and form of a continuous terrain. The river is also given texture, heightening the overall flow and sinuosity of the land and the drawing.
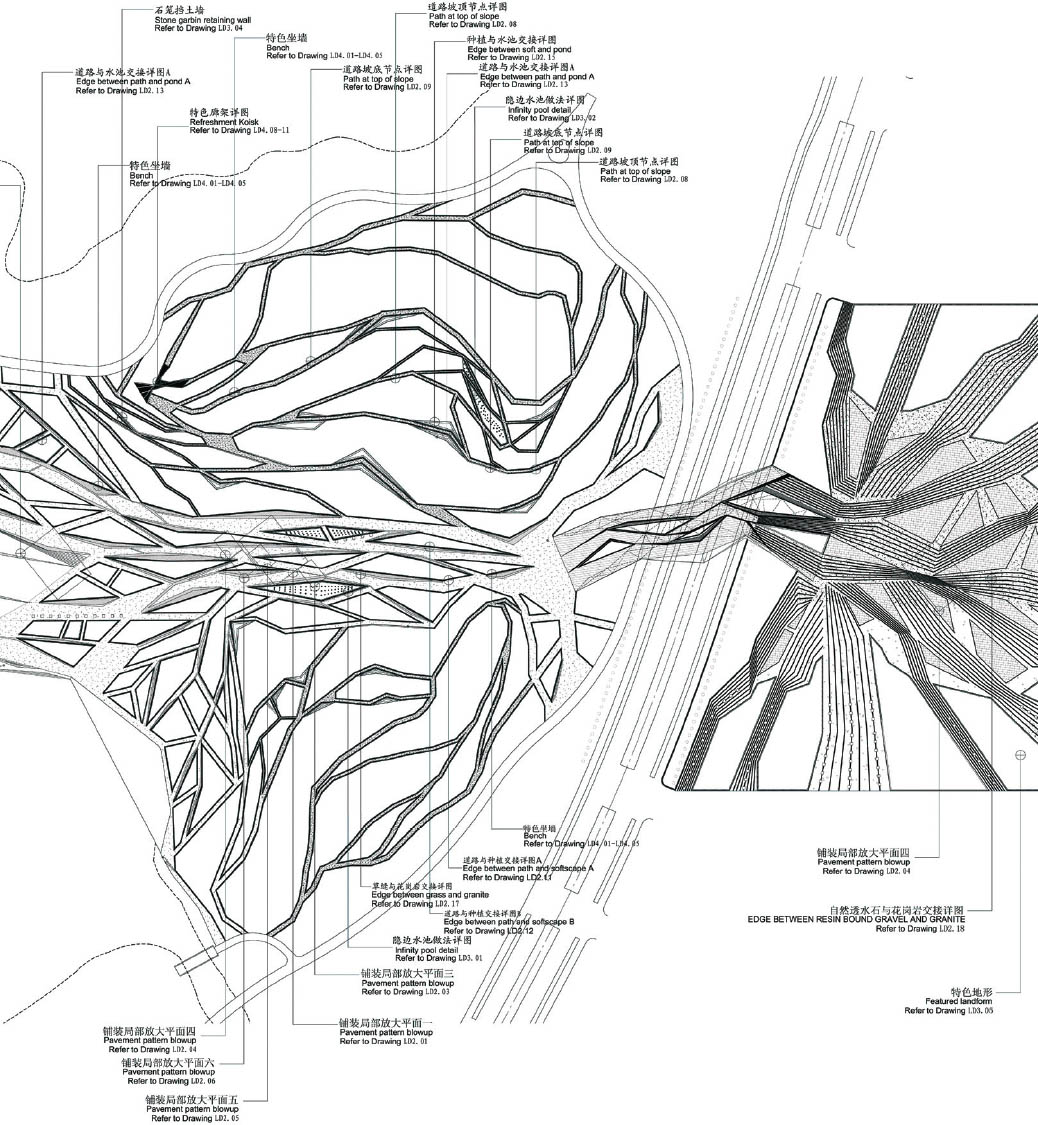
3.8
34.2683° N, 108.9419° E, Plasma Studio and Groundlab, Flowing Gardens—Xi’an International Horticultural Expo General Plan, 2011.
Flowing Gardens—a competition-winning entry for a horticultural exposition campus—emphasizes movement. The site plan drawing calls attention to flow lines by hatching the dynamic spaces, distinguishing these corridors from the rest of the site. The lines pinch and expand in response to constraints, giving an overall dynamism to the drawing. The built form and the landscape blend through the representation, design, and execution of the complex.
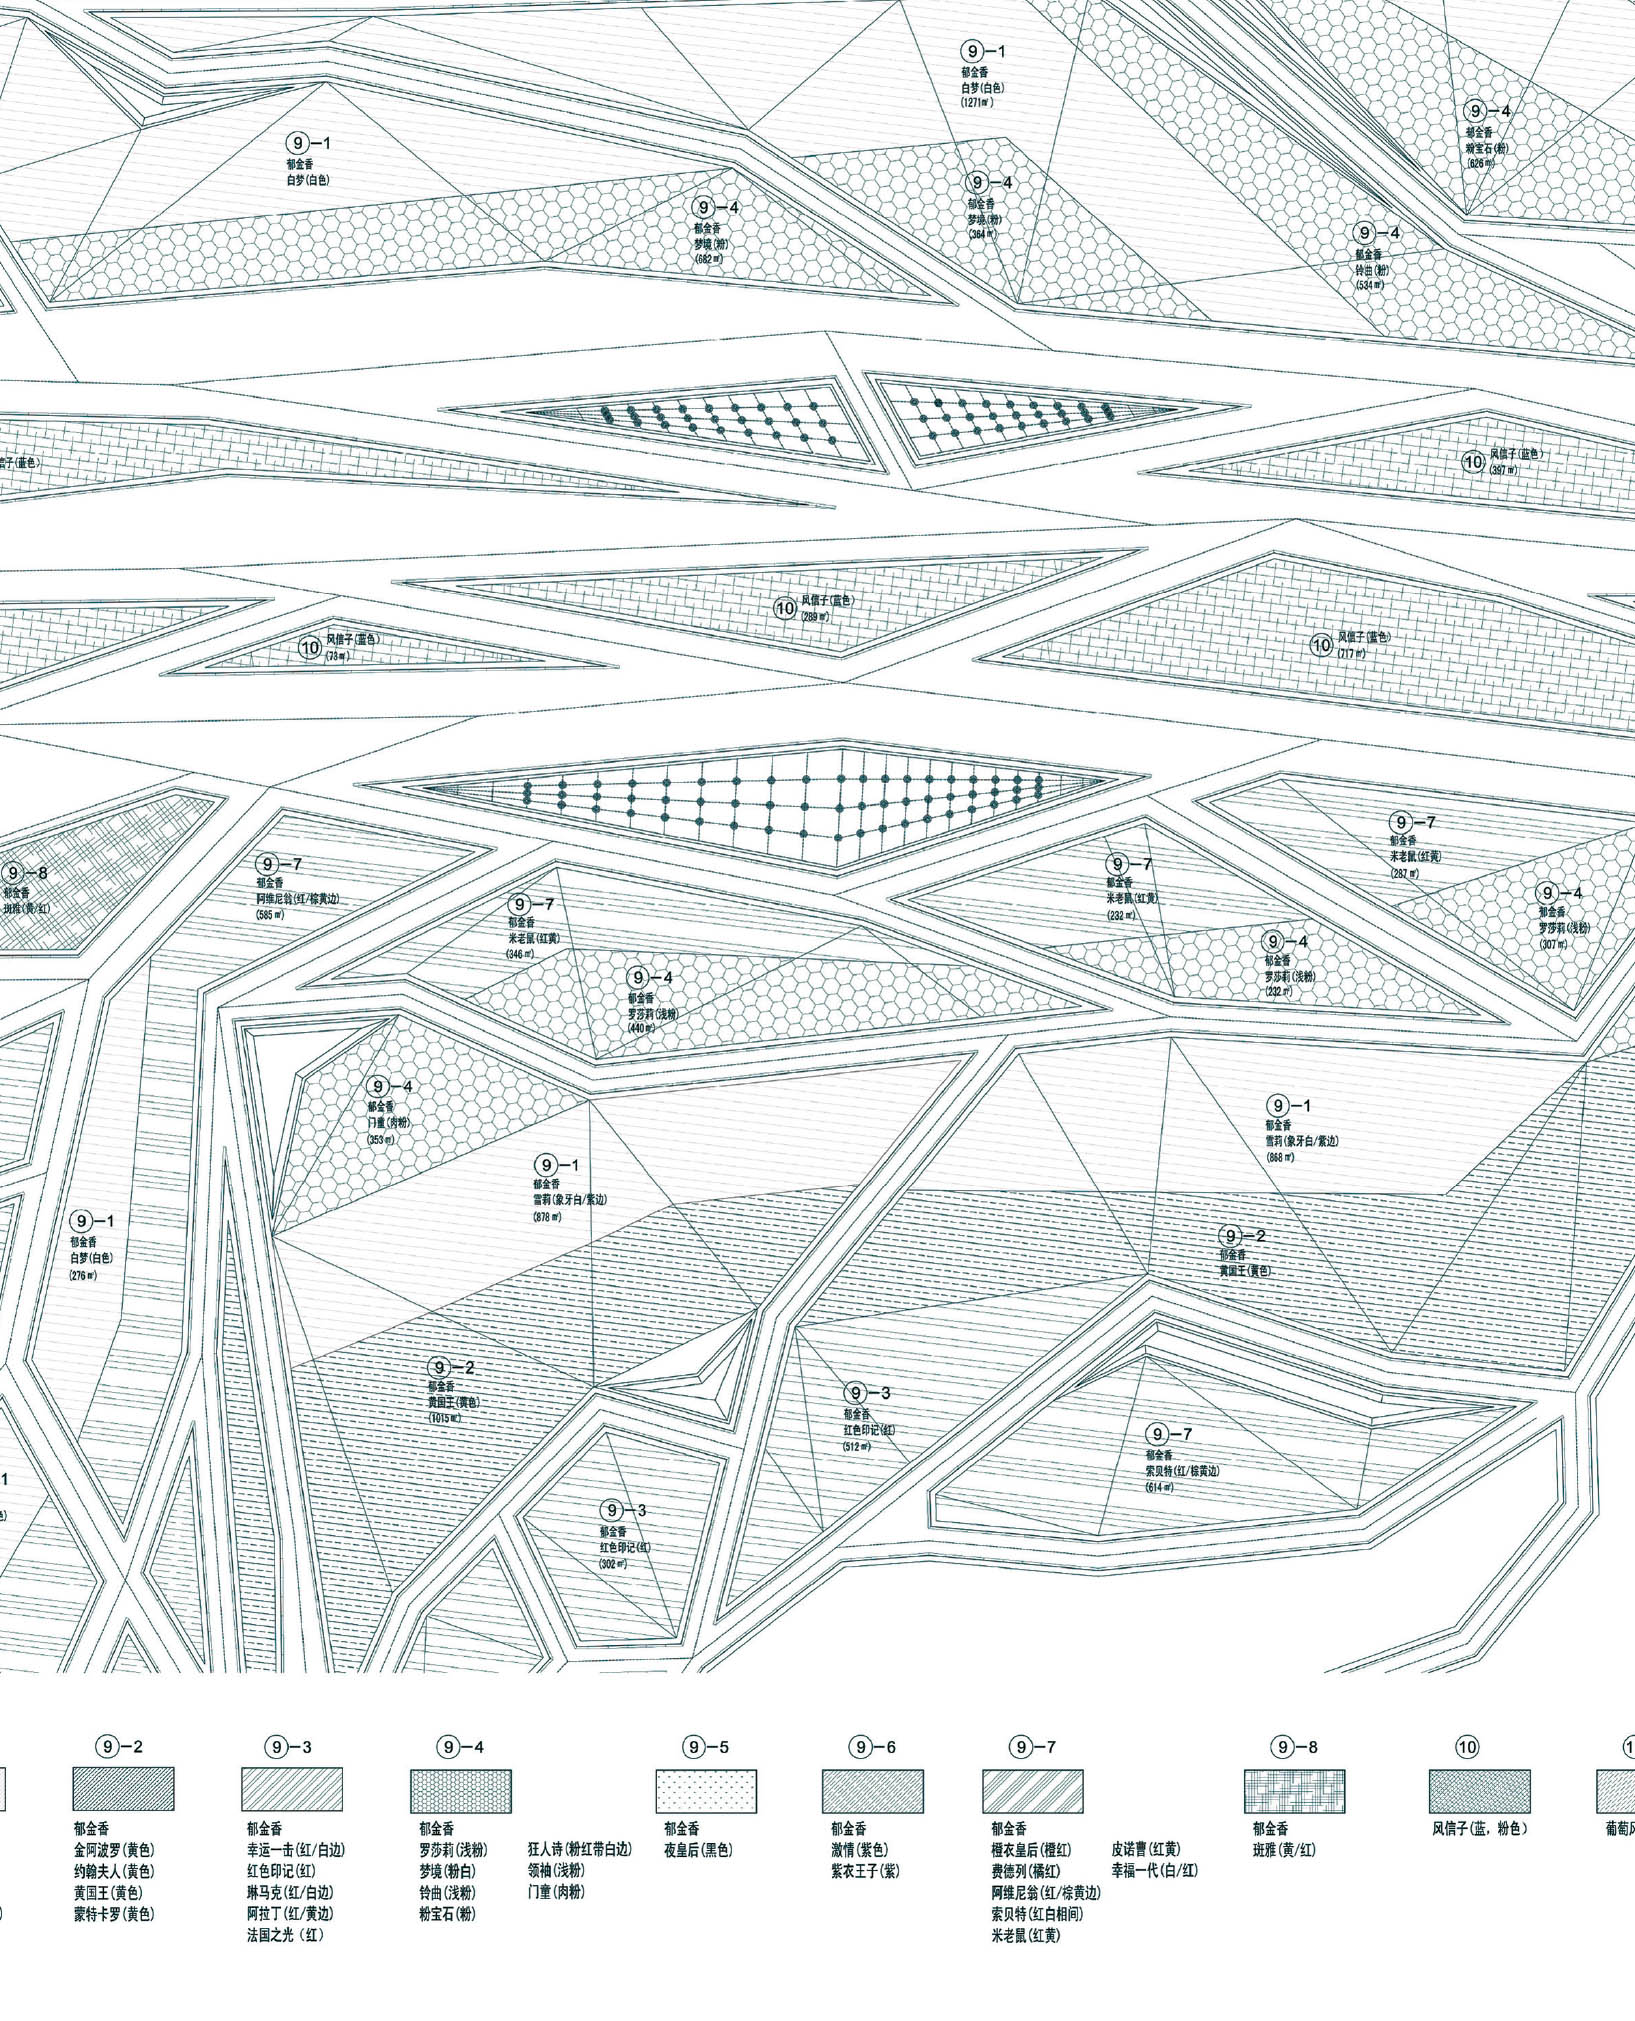
3.9
34.2683° N, 108.9419° E, Plasma Studio and Groundlab, Groundcovers Layout, 2011. Scale: 1:300 (shown at half size).
The hatches refer to the type of planting materials—tulip and hyacinth varieties—populating the exhibition gardens. Hatches are common as a means to communicate material intent between designer and builder. While architectural materials often have standard patterns, planting hatches are varied. In this example, there is a wide array of textures and responses to the hatch boundary. Some patterns are independent, while others shift direction with the frame and give a near topographic reading to the drawing.
3.10
43.6434° N, 79.3676° W, Claude Cormier + Associés, Sugar Beach, 2008–10.
The sheer length of the key indicates the richness of the materials in the Sugar Beach design. Claude Cormier + Associés are known for their bold, graphic landscapes—red and white–striped bedrock outcrops, a leaf paving motif, pink beach umbrellas—and the construction plan for Sugar Beach highlights these elements.
3.11
6.2359° N, 75.5751° W, LCLA Office, Tactical Archipelago, Kiev, 2012.
The hatching versus solid fill offers a clear contrast between land and water, vegetation and open ground. Plantings are rendered in elevation as a planimetric field of implied density. Within this landscape, a system of programmatic units is deployed forming micro islands, objects within a relational field. Through aggregation and repetition, the small architectural interventions populate the land-water interface, adding intricacy and patterning to the edge condition.
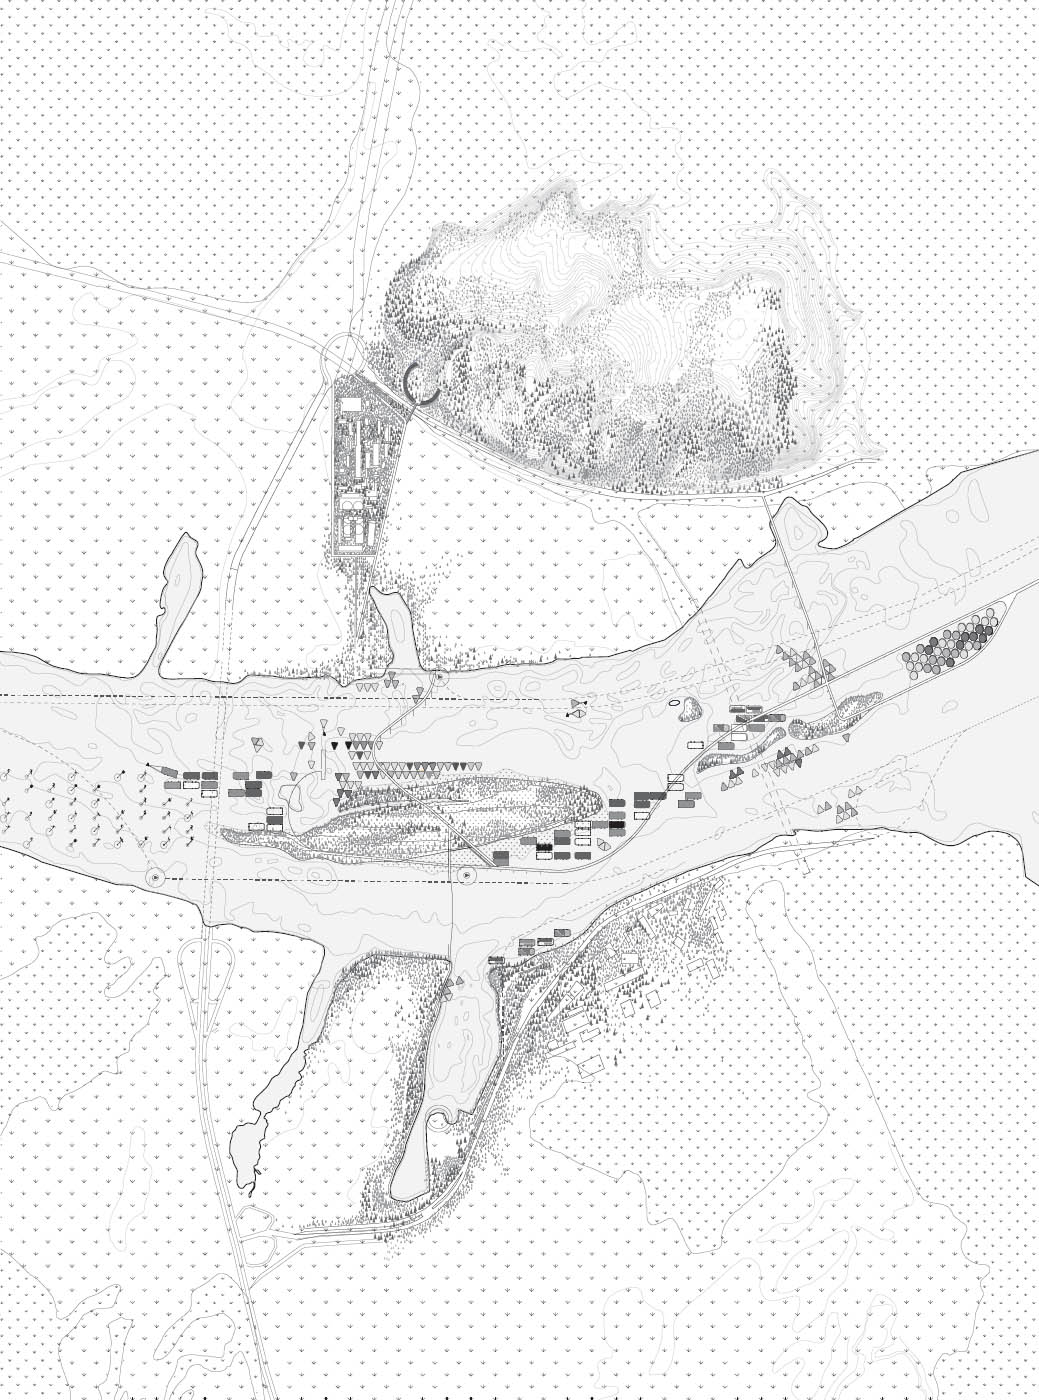
3.12
6.2359° N, 75.5751° W, LCLA Office and AGENdA, The River That Is Not: Master Plan for Medellin’s River, 2013.
This hybrid drawing collapses three parallel projections—plan, section, and axonometric—into a single image. Through the layering of viewpoints, the relationships between channelized river, infrastructure, program, planting, and ground material become clear. The hatching is not indexical but rather describes the grain and detail associated with the project. The texture brings the public realm to life much in the way the design introduces occupation to the riverbanks.
3.13
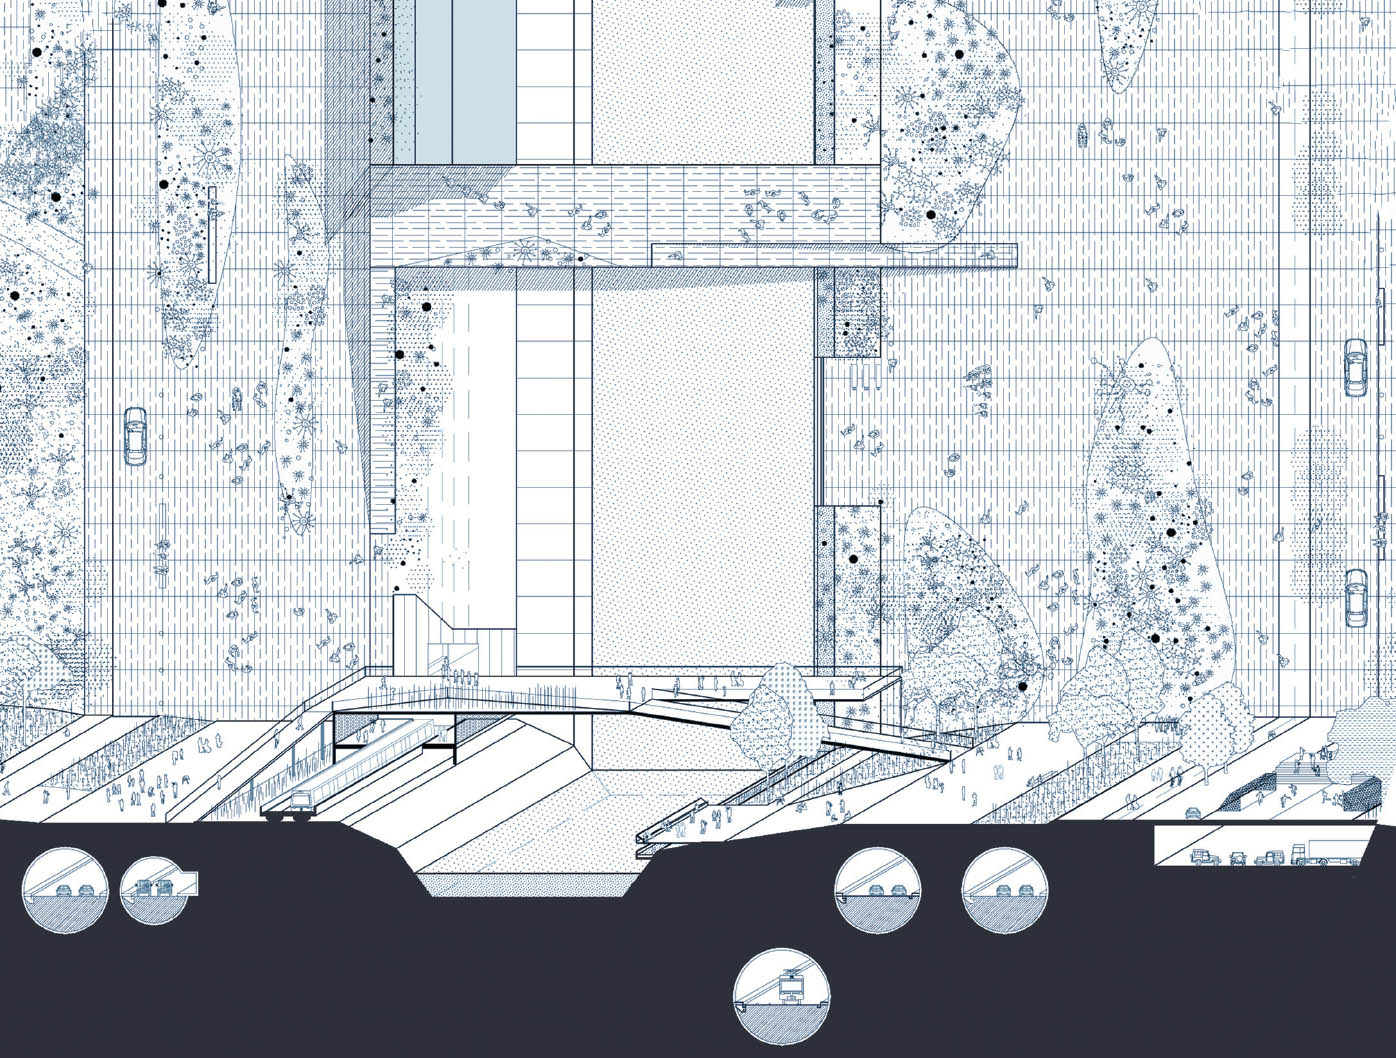
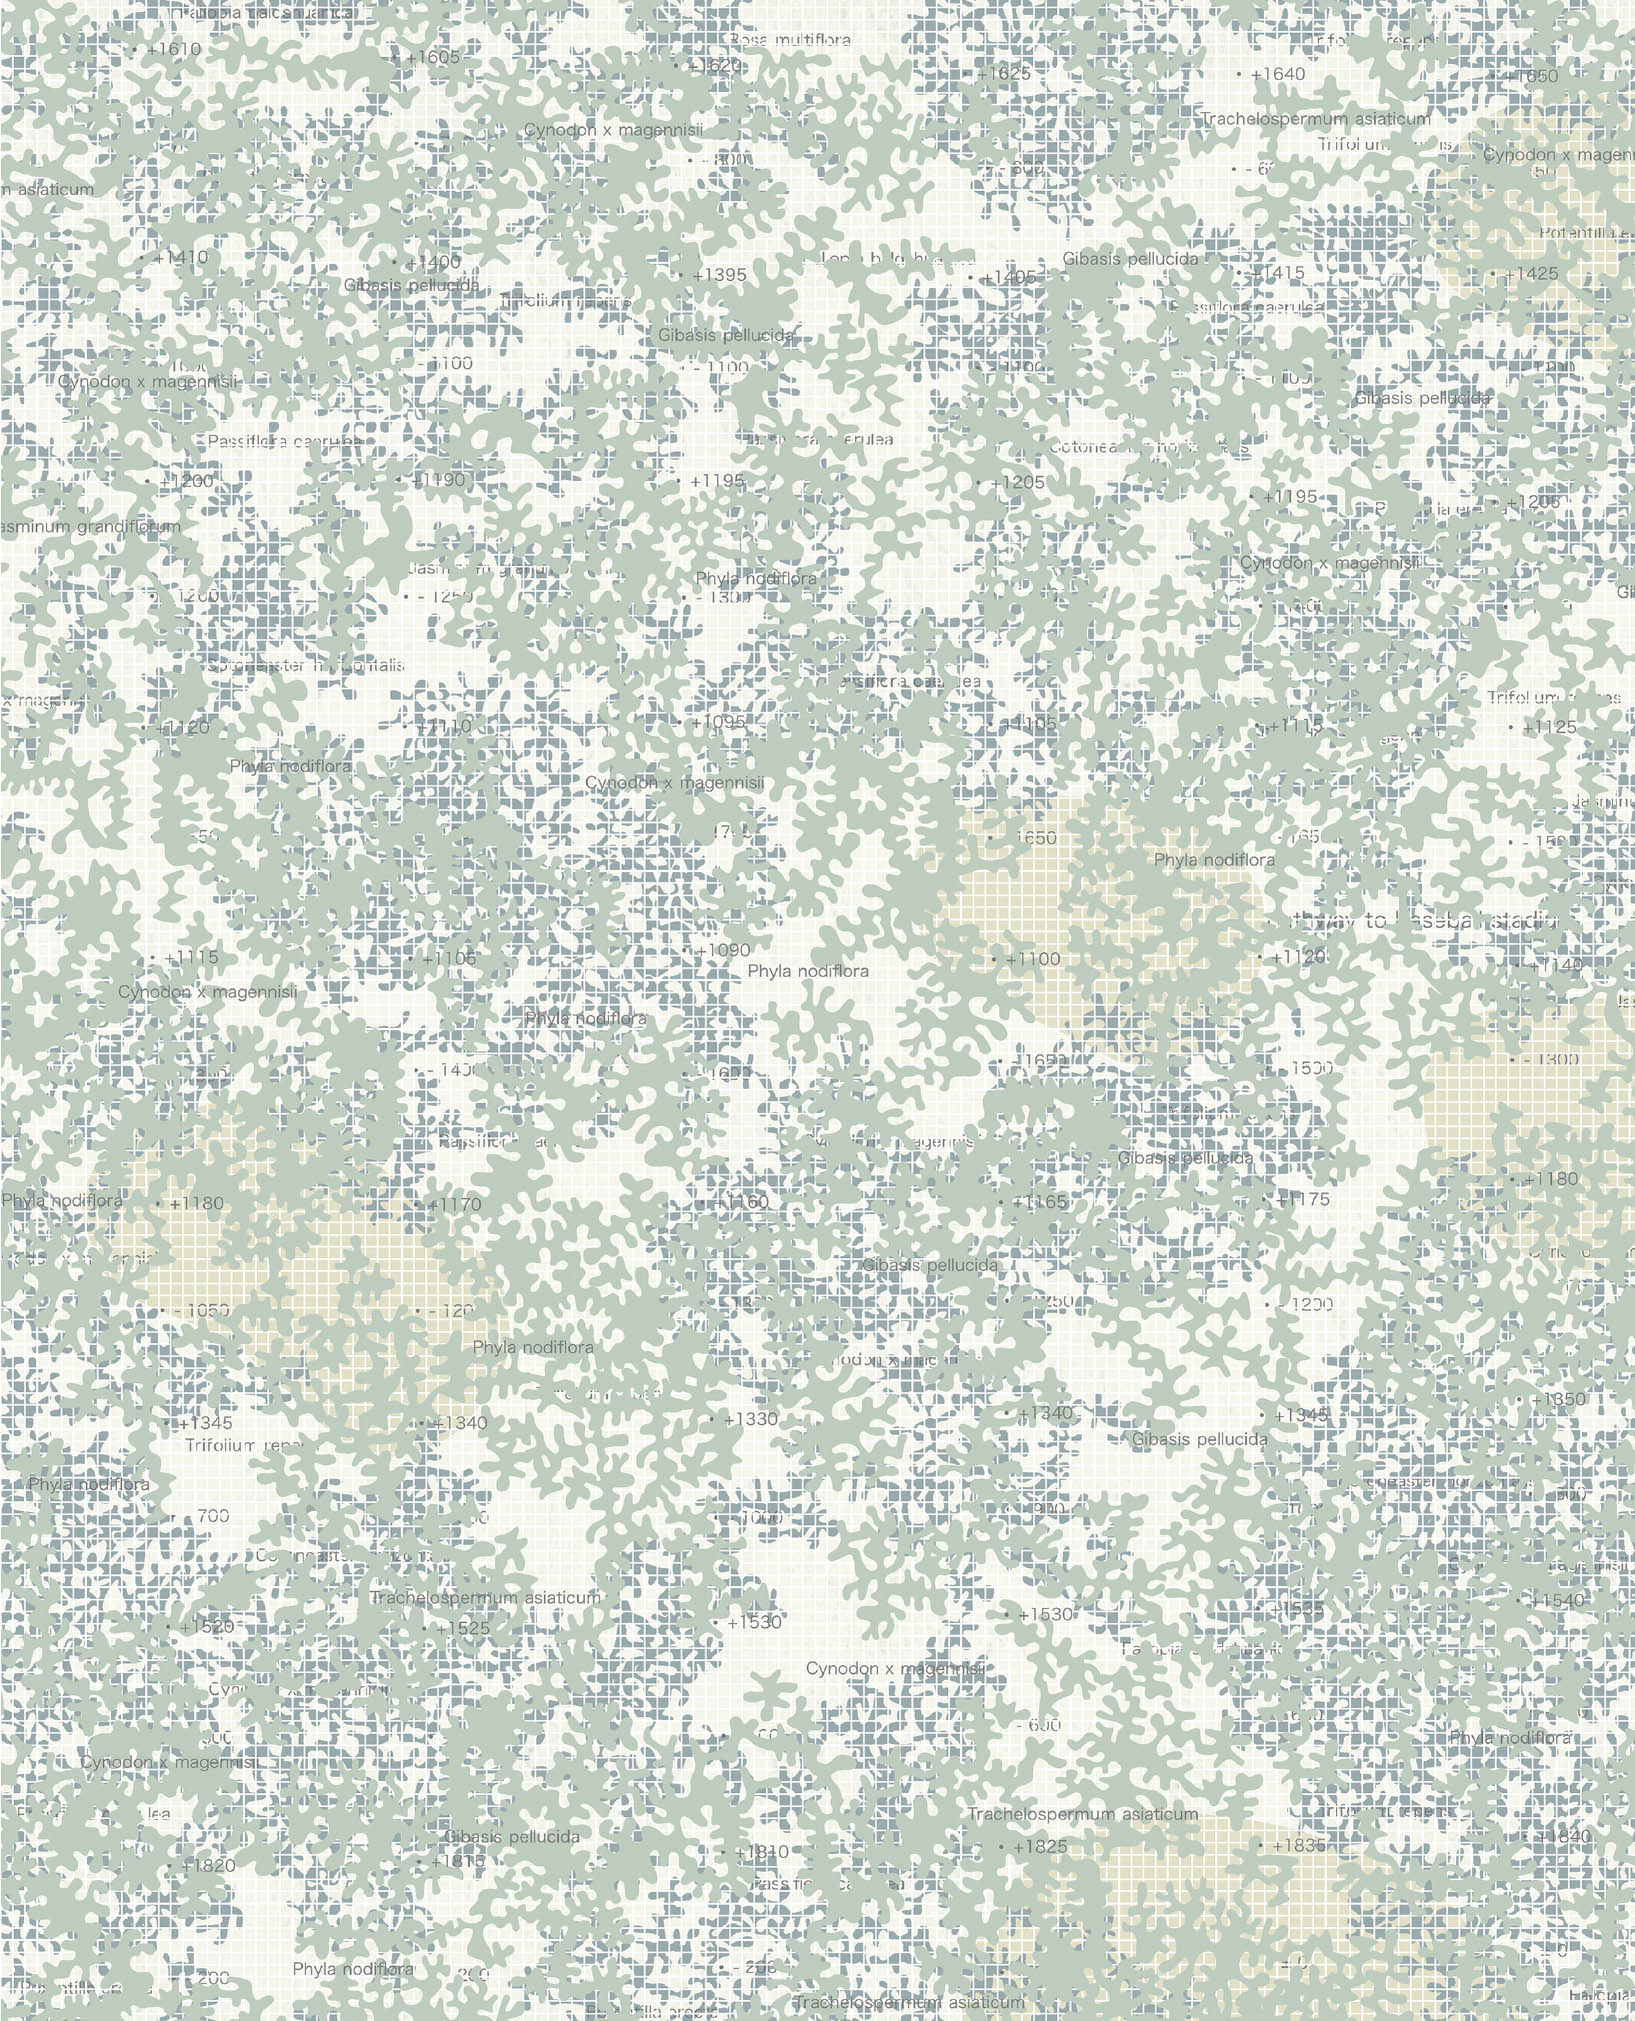
35.4856° N, 139.3433° E, Junya Ishigami + associates, Horizon: Cafeteria at Kanagawa Institute of Technology, 2011. Originally published in Junya Ishigami, Another Scale of Architecture (Kyoto: Seigensha, 2011), 96–97.
This drawing superimposes the floor and roof plans, graphically interrogating the relationship between the two levels. The drawing shows the gridded structure, the amorphous island forms of the sculptural roof, the canopy, and foliage, interspersed with Latin species names and spot elevations. The effect is not a clear architectural plan but the feeling of being immersed in the space. The overlapping of multiple patterns and grains highlights the feeling of being in a forest, with small clearings or gaps emerging through the field.
3.14
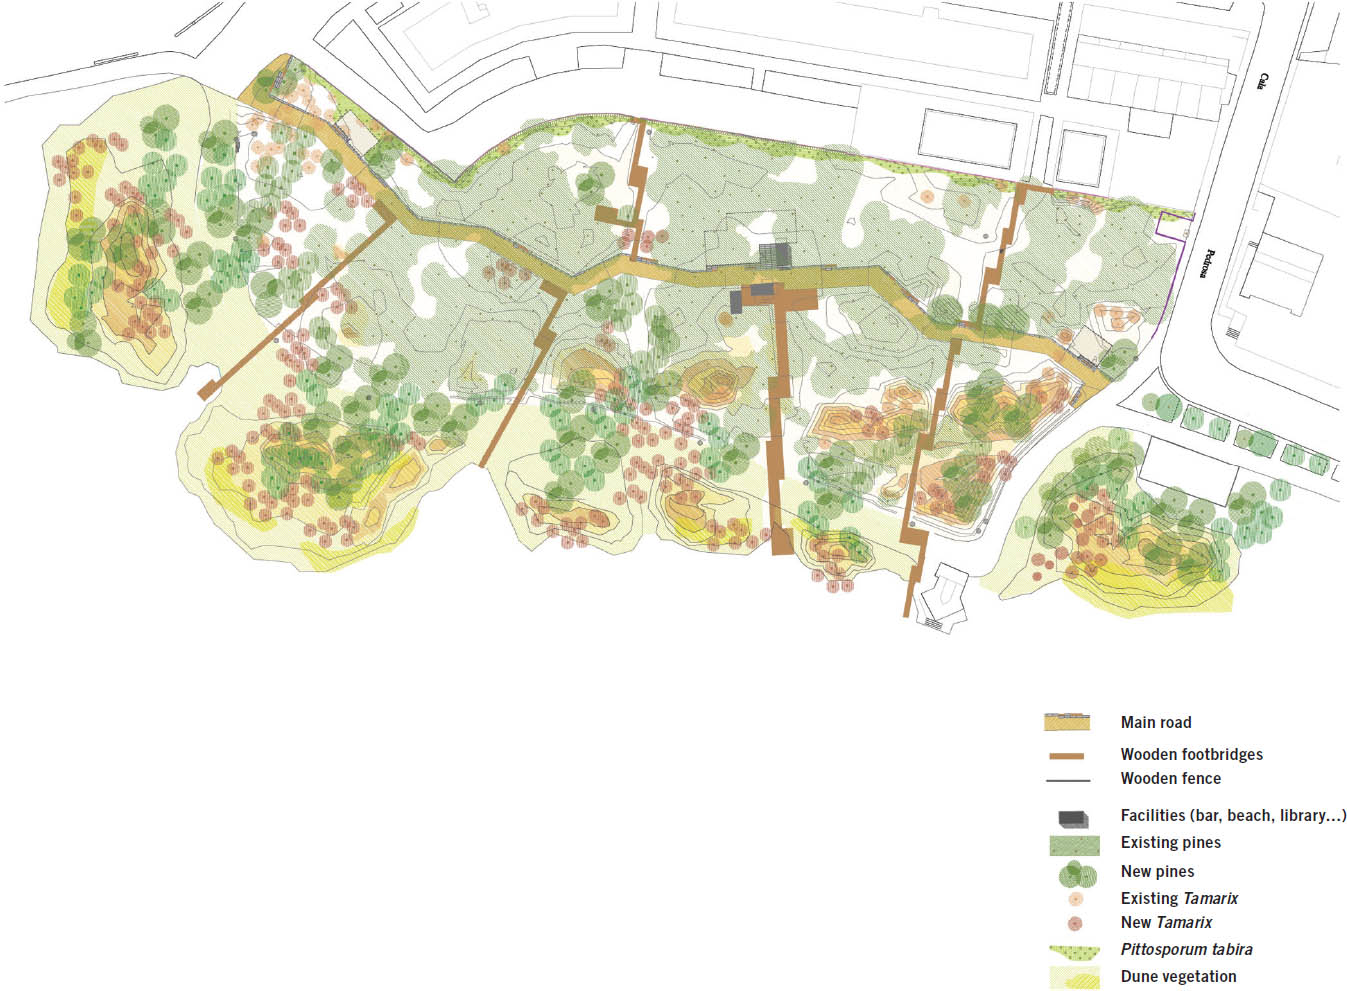
41.0740° N, 1.1787° E, Estudi Martí Franch, La Pineda Park, 2010.
The La Pineda Park project is represented through a series of plans—the last of which is shown here—that indicate the project transformation over time. The layered landscape is represented with hatches of diagonal lines in different colors to indicate existing pine vegetation, three types of proposed trees, and various ground materials. The hatches, with their nonsolid quality, allow materials to overlap without obscuring clarity.
3.15
6.2359° N, 75.5751° W, Gustavus Bechler, Map of the Sources of Snake River, 1872. Scale: 1:316,800 (shown at three-quarter size).
The hachures on Map of the Sources of Snake River are particularly soft and warm, allowing ridgelines to dissipate into plateaus. The sandy tones of the Teton landscape complement the subtle blues of the waterways. The map is inviting, allowing the eye to explore and trace the discoveries of the expedition of 1872, led by Ferdinand Hayden and James Stevenson. Stevenson was responsible for the Snake River mapping, and his team included topographer Gustavus Bechler, as well as a geologist, an ornithologist, a botanist, and a photographer.