Chapter 3. A Framework for Experimentation
IN THIS CHAPTER, WE move from the theoretical to the practical by introducing the framework that we’ll be using over the next three chapters to dive into the practical integration of data and design. This framework is our own particular take on how to think about A/B testing. You’ll find that many people use similar ways of thinking about A/B testing design and implementation, and we hope that you will find your own ways to adapt our framework to suit your needs. There are three phases that we’ll go into more detail on: definition, execution, and analysis. We’ll dedicate a chapter to each of these and go into much more detail about applying the concepts in Chapter 4–Chapter 6.
What is the relationship between data, design, and user experience? We say that there should be no divide between data insight and design insight. We believe designers have a significant role to play in the design of data-gathering activities (what should be captured and why), in the design of data itself (what format should data take, what data types need to be triangulated), and in the presentation and communication of insights and results that derive from the data capture and analysis. We believe that data capture, data validation, data curation and management, and data analysis for insights are central to design practice. We believe that design practice is central to effective data design.
Furthermore, a user experience that is useful, usable, and elegant—and that offers your users a consistent and reliable experience—is a critical foundation for a great business. The best way to assure you are meeting these goals is to gather data, learn from it, and iterate on your designs to enhance the elements that have a positive impact on the user experience while diminishing those that contribute to a negative user experience. A data-aware approach to design enables you to be more systematic and more ambitious about your design and product development process, helps you understand how to determine different user types and their needs and expectations, and effectively relates your design work to your business goals and metrics.
Many of you already have a design process that you are comfortable using on a regular basis. In the upcoming chapters, we want to show you how data can easily fit with and help augment your existing design process. We want to reiterate that experimentation is a mindset. It’s iterative, just like your existing design process, and encourages you to constantly focus on improvement by questioning your assumptions about your users and your design, which you do by seeking out evidence about how your work performs in the world. Taking an experimentation mindset lets you challenge those assumptions to see which ones hold up, and which ones need to be revised for your further work. We hope that the framework and toolkit we introduce in this and the subsequent chapters helps get you excited about applying this lens and mindset to your future work.
Introducing Our Framework
In the previous chapter, we introduced you to a formal definition of experimentation. If we start to think about what we do as designers as being synonymous with experimentation, we’ll find that working with data will require just a few small shifts in mindset from the normal approach. We focus on “experimentation” in this book because we think it’s an important construct for designers working with data. However, we hope that our focus on experimentation generalizes to our belief that it is possible to be disciplined in your usage of data without restricting your freedom.
In fact, there is a lot of flexibility introduced when you think broadly about what the goal of an experiment is. Experimentation implies that you are not sure of your outcomes. You could be exploring ideas and evaluating them. Experiments might be big or small. Similarly, the framework that we introduce isn’t meant to be a “one size fits all” structure that you must memorize and follow precisely.
Experimentation is an activity that you participate in for the purpose of learning or discovering something. In this book we are mostly focused on cause-and-effect relationships between the experiences you design and the impact they have on your user behavior. Experimentation lets you test an idea about that relationship by seeking evidence that supports or disproves that idea. So like any activity, you can improve at it through practice and by expanding your knowledge.
Although we’ve chosen to focus on A/B testing here, this experimentation framework and general approach to working with data should be extendable to other methodologies that leverage data as well, not just A/B testing. Working with data is simply a systematic way to be thoughtful about how you are generating and capturing the insights that help you learn more about what works or doesn’t work for your customers. We’re sure you can imagine how being systematic about data collection could apply to surveys, interviews, diary studies, or other research methodologies as well.
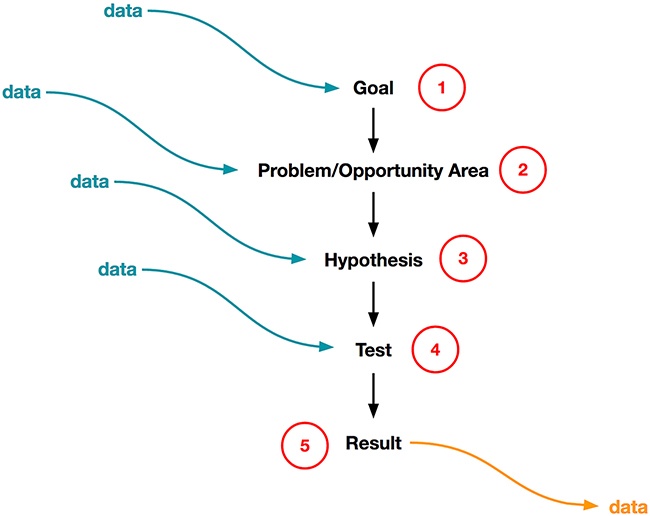
With this in mind, we wanted to introduce you to a slimmed-down version of the experimentation framework that we’ll use in the next three chapters. Each of these components may in practice have many substeps but here, our goal is only to highlight the general roadmap of an experiment. At the basis of the framework is the flow shown in Figure 3-1 and described here:
First you define a goal that you want to achieve; usually this is something that is directly tied to the success of your business. Note that you might also articulate this goal as an ideal user experience that you want to provide. This is because it’s often the case that you believe that delivering that ideal experience will ultimately lead to business success.
You’ll then identify an area of focus for achieving that goal, either by addressing a problem that you want to solve for your users or by finding an opportunity area to offer your users something that didn’t exist before or is a new way of satisfying their needs.
After that, you’ll create a hypothesis statement, which is a structured way of describing the belief about your users and product that you want to test. You may pursue one hypothesis or many concurrently.
Next, you’ll create your test by designing the actual experience that represents your idea. You’ll run your test by launching the experience to a subset of your users.
Finally, you’ll end by getting the reaction to your test from your users and doing analysis on the results that you get. You’ll take these results and make decisions about what to do next.
Data should be used throughout and at every step of the way in this process. We encourage you to think about what kind of data can be brought into the process to help you along the way (shown in blue in Figure 3-1) and what kind of data might result from the process (shown in orange). As we noted in Chapter 2, it’s important to keep in mind that data can come in many forms, be derived from many different activities and sources, and fulfill many different kinds of purposes. You could say that this captures the minimum components of an experiment.
For us, this whole chain of activity is part of the design process. The act of “design” goes beyond defining what your test experience looks like; it’s also articulating a clear goal, coming up with the structure of your test (as captured by the hypothesis), and then participating in the analysis of your results to make sure you can apply what you’ve learned to future design work.
Working with Data Should Feel Familiar...
We wanted to show how working with data might be similar to your existing design process. One example of a commonly used design framework is the “double diamond” introduced by the Design Council in the UK in 2005. Fundamentally, the double diamond is about exploring broadly before narrowing down to either the problem definition or the final design that you will be launching to your users. Other design processes are similar: most designers are encouraged to iterate a lot and explore many ideas or solutions to a problem they’re designing for. It is this notion of going broad and keeping an open mind as you explore which we want to highlight.
In a data aware design process, you should always be thinking about the volume of ideas or potential solutions you are generating, the variation between those ideas or solutions, and how you can learn the most about them. However, unlike the double diamond, which implies that you are narrowing down to a single problem definition or to a single solution at the end of your exploratory process, we want to introduce you to an experimentation framework with the goals of generating and articulating multiple solutions that you can test and learn from along the way. One of the places where working with data truly exercises your creative muscles is in being able to generate multiple divergent perspectives and solutions, to learn from the strengths and weaknesses of these different approaches you might take.
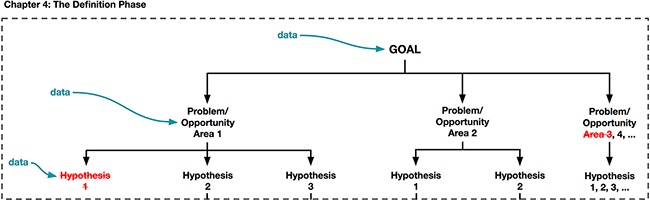
In Figure 3-2 we illustrate what this might look like if you were to take our basic framework (outlined in Figure 3-1) and simply “go broad” with it—identifying multiple problem areas/opportunities, generating multiple hypotheses, and then creating multiple tests for each one. So if you were just focusing on volume and variety, you might get a process that branches out to many possible experiments.

We recognize that it’s not always practical to generate and launch every possible solution to your users. It can be challenging to keep track of so many concurrent experiments, which may introduce the risk of bias, for instance, if a user ends up in multiple test cells at the same time. And every experiment comes with the cost of designing and launching a test to your users, which takes time and energy. Data used intelligently throughout your design process can help inspire new experiments, but also slim down and evaluate your ideas into experiments that might be worth pursuing. This ensures that you’re running meaningful learning tests rather than relying on A/B testing as a “crutch”—that is, where you to stop thinking carefully and critically about your overarching goal(s) and run tests blindly, just because you can. Unfortunately, this is a pitfall that we have seen some teams fall into.
For example, after you’ve generated a number of hypotheses, you might be able to gather additional data by using other methodologies to help you prioritize where you want to focus your efforts. You might also find more evidence from the results of prior experiments that also helps you to refine, change, or eliminate some of the ideas you were considering. Therefore, by leveraging data and insights at every step in this process (shown in blue in Figure 3-3) and taking into consideration how and what you are trying to learn, you might find that you’re able to eliminate some of the possible paths you were considering earlier in the process (shown in red in Figure 3-3). We’ll discuss this in more depth in Chapter 4.
As we pointed out in Chapter 2, you will get different kinds of insights from different sources of data. Every form of data tells a different story, so it’s important to collect varying types of data and triangulate what they might mean with each other. While we won’t be comprehensive in our coverage of the other kinds of data-gathering methods, it’s ultimately important that you find the questions, methods, metrics, measures, and analytic techniques that work best for your context and your needs. We hope that our deep dive into using A/B testing as a way to integrate data in the design process will help to demonstrate how you could employ similar techniques with other forms of data as well.

Finally, one of the things we want to emphasize is that because we are talking about creating a mindset of continual learning it’s also important for you to not just think about each experiment that you are conducting in isolation, but rather to think about the series of experiments you might run to learn about your customers over time. Figure 3-4 illustrates what we mean here.
You might be able to explore multiple problem/opportunity areas at the same time. As you explore each of these, the data that results from each experiment should continuously feed in new information to learn honestly about what is working and what isn’t working to inform the experiments that follow. Along the way, you’ll learn that some of these problem/opportunity areas aren’t worth exploring further (as shown with Area 1 and 3 in Figure 3-4) and that some have great potential (as shown with Area 2).

You won’t be able to learn everything that you need or want to know about your customers in one experiment. Being aware of how everything you’re learning about your users is related, and how what you are learning contributes to a larger body of knowledge about them, is also useful. As part of adopting a learning mindset, you should think not only about honing your own instinct about your users, but also about sharpening the instinct of others at your company. We believe that a culture that supports learning, being challenged, failing, and ultimately gaining a more complete and accurate picture of their users will be most successful at leveraging data in meaningful ways, and therefore most successful at building useful, usable, and elegant experiences. We’ll provide some concrete tips about how to create this organizational culture in Chapter 7.
Three Phases: Definition, Execution, and Analysis
 Let’s return to our summer camp metaphor. As we’ve established in Chapter 1, you’re thinking of making enhancements to your summer camp experience so that you can ultimately improve your business. You’ve decided to take an experimental approach to find the best way to achieve your goal.
There are many different experiments you could run to achieve this goal, but first you’d need to get a little more precise about what your goal is. You’ll have to define your goal and how you plan to measure your progress to it more clearly. First, are you interested in making more money from your summer camp or are you interested in building up the reputation of your camp? If you decide that you’re going to focus on making more money from your camp, there are a couple of ways you could get there. Are you looking to make more money by increasing the number of campers at your summer camp? Do you want to instead focus on keeping the same number of campers but possibly charge more money per camper? Could you do this by adding more bespoke activities (nighttime kayaking, for example) that you could charge more for? Each of these paths that you could take will have different pros and cons. You’ll need to weigh the importance of different factors into your decision about which path to take. What decisions will give the best outcome for your campers? For your business?
Once you decide which things to test for your summer camp, you’ll then get to try some of those ideas out by executing against them using real campers. And, once you’ve set up a few experiments, you’ll be able to start analyzing those results. You might learn things along the way, both about the ideas you test (it’s actually pretty hard to navigate your kayak at night when you don’t have a full moon) and about your campers (even though they say they’re interested in nighttime kayaking, it turns out that they’d rather sleep or relax at the campfire). As you decide what you’ll ultimately put into place, you’ll be juggling all of these factors in your mind and might want to make adjustments along the way.
Thinking ahead of time and having a good overview of the different things you might try and the different factors that might affect your outcomes will help to keep you focused and on track as you work through your experimentation framework.
To get a little more concrete about the experimentation framework and how to apply it in practice, we’ll break it up into three phases: definition, execution, and analysis. We’ll dedicate a chapter to each phase and use examples throughout to help illustrate the concepts that we introduce. For now, we’ll just give you a brief overview of each phase so that you know what to expect in the coming chapters and have a sense of the overarching structure of the framework.
The Definition Phase
In Chapter 4, we focus on defining what it is that you want to learn. We again emphasize the idea of crafting a well-formed hypothesis, and expand on the process of setting measurable goals in the context of your business and the scope of what you want to accomplish. Here, we cover how to articulate your ideas and goals as well-formed hypotheses that capture the “why” and “what” of your test and what you ultimately hope to learn. Once you’ve developed a set of hypotheses that you want to test and learn from, we’ll talk about how you might narrow them down to one or several hypotheses that you’ll then design for and test “in the wild.”
Because we believe that careful planning is an important part of experimentation, this phase is really about thoughtfully capturing what it is you want learn so that you can be more effective and efficient in the execution and analysis phases. Figure 3-5 shows the parts of the experimentation framework that we’ll cover in Chapter 4.
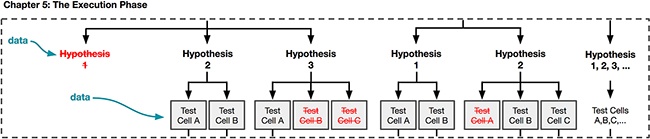
The Execution Phase
In Chapter 5, we get into the designing and building of your experiments so that you can maximize what you learn from your experiments. Now that you have just one or a few hypotheses that you are focusing on, we’ll talk about how you’ll want to make sure that the experience you design reflects your hypothesis. We’ll also speak to the importance of having several design expressions or experiences for each hypothesis. We call each of these a test cell. This is the phase where you really get to practice the craft of design. We’ll also talk about developing a designing-to-learn mindset and then how to select which test cells or experiences you’ll ultimately want to launch to your audience. Figure 3-6 shows the parts of the experimentation framework that we’ll cover in this chapter.
Although you’re doing most of the design craft work in the Execution Phase, we deliberately choose not to call this the “Design Phase” because we wanted to be clear that as a designer you should be involved and active in all three phases. Designing an experiment is still design, and we believe that designers bring a unique perspective to each phase, which makes your input both necessary and invaluable.
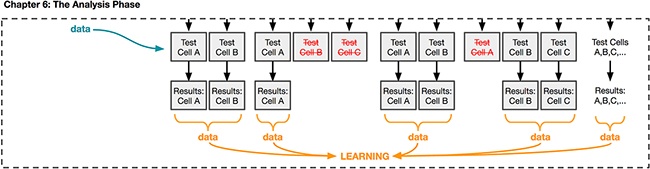
The Analysis Phase
Finally, in Chapter 6, we’ll cover what you should be thinking about when launching your experiments to your users. With A/B testing, this is the first time that your users will be experiencing your ideas through your experiment. We’ll then cover how to decide on your next steps once you’ve gotten your results and a few different common situations that you might encounter. We’ll highlight a few pitfalls that you will want to avoid. The important thing to remember about this phase is that you want to make sure that you really learned what you set out to learn in the Definition Phase. The sections of our experimentation framework that we’ll cover in this chapter are shown in Figure 3-7.
Of course, your experimentation mindset shouldn’t end after you’ve made it to the end of your Definition Phase. All the information that you gather is new data for you to then incorporate into future experiments, and spread within your organization to increase knowledge and improve intuitions about your users and your product. We’ve found that adopting this mindset can fuel increased creativity and curiosity to keep learning and experimenting. We hope that by the time you’ve run through one or a few experiments, you’ll always be inspired by new questions and new things to learn as you wrap up the Analysis Phase.
Examples: Data and Design in Action
What we shared with you in this chapter might feel very structured. As we close out this chapter, we thought it would be nice to hear a real-world overview of how data and design work with each other throughout the development process at Airbnb and Etsy.
Katie Dill is the Director of Experience Design at Airbnb, where she oversees the designers that are responsible for defining Airbnb’s digital products and services. Airbnb is widely recognized as a design leader that is especially thoughtful in their use of data when crafting their customer experiences. We thought it would be useful to share her anecdote, as it shows how you will ultimately need several forms of data throughout your design and development process. As we’ve tried to note throughout this book, it’s important that you don’t look at A/B testing as the sole method that you use in your design process. Katie starts by telling us how the team identifies the problem that they are going to address:
There are countless ways to learn about opportunities to improve products, including anecdotes directly from users, qualitative research interviews, and customer service FAQs. But it is data science that really helps us understand where the big opportunities for improvement are. Data showing the way people are using the product and purchase history can show us when and where there are recurring issues and negative trends. For example, we can look at our data and see that there are certain homes on our site that rarely get booked. We can then compare their characteristics and history to other homes to see where the issues might be. This can give us a hypothesis about the issue, but it’s often not the whole story. We’ll complement this insight with qualitative research to better understand the human behavior behind the issue. Quantitative data is very good at showing the what and where of the issue, but qualitative is often better at uncovering the why.
Based on our insights from qualitative and quantitative data, we’ll develop product solutions. Design, user research, and data science continue to collaborate throughout the product design and development process. In the beginning the qualitative user research is foundational and helps us understand the problem. Once we have something on paper the nature of the research becomes more evaluative as we seek to understand users’ reactions.
As the solution takes shape, it’s time to discuss the testing strategy. If the team is really thoughtful about their rollout strategy, they are having conversations about where they want to be in the long run, and the steps they’re going to take to get there. For example, the end solution might incorporate five new features. If they roll out all at once and there is an issue, they may not know where the issue is. Instead, they can choose to roll out each feature separately so they can study the effect of the feature in comparison to the old version of the product with clean data. Starting this conversation early helps us in our design process. If we know we’re going to launch things separately, we might design them differently so the product feels complete even when it’s delivered in pieces. That’s pretty powerful, as it helps us be more efficient while still delivering a great user experience. These early conversations also help data science and engineering prepare for the things they will eventually measure in the new solution. For example, we might need to build tooling to take the measurements of interest, and we might need to start measuring certain things now with the current product in order to establish a baseline.
By the time we’re ready to launch a feature, we have a good understanding of what we’re going to measure, for how long, and what success looks like. An in-house dashboard—an experiment framework—shows us all the metrics we’re tracking across the product. There we can see what things are going up and what things are going down both in and outside the feature (e.g., number of users, clicks, purchases, etc.). This is important as the new feature may have unintended effects elsewhere in the product and we need to have a comprehensive view of the results. After the feature has run for long enough to gather meaningful data, we assess the results and make a judgment call as to the success or failure of the experiment. Typically, the rule of thumb is that if it achieves its goals and has a positive or neutral affect on all other key metrics, we keep it. And if it fails to meet its goals or has negative repercussions elsewhere, we’ll roll the experiment back and remove the feature. However, there are times when a feature may have negative effects on our metrics, but we decide to keep it due to other benefits to the user experience and/or long-term plans.
Dan McKinley, formerly of Etsy, also shared a lovely example of how iterative A/B testing can fit nicely alongside a large piece of product work, such as a redesign of a page. His story illustrates well how a project might take a global approach at one point in time and then shift to a more local approach. He said:
I think the best test and product release that we ever did at Etsy was redesigning our listing page. Etsy’s listing page is super important. It’s a really complicated page with a lot of edge cases. It has to work in many languages for many different kinds of items. Because it’s so complicated, redesigning the whole thing is not the kind of thing that we could just iteratively get to, it would have been a thousand steps.
So we designed the process in two phases. We said “OK, we’re going to spend until July trying big changes to find one that’s close. And after that, we’re going to hopefully have a release candidate and we’re going to do optimization on that.”
The first phase was to do some big redesigns of the page, and we spent the first half of the year doing big changes. To see if we got a variant that we’re happy with and was even remotely close in terms of performance to what we had. We felt like we could devote 5% of traffic to a new variant without making people too angry. So that’s what we did. We did 2 week iterations from January until July, trying all sorts of different things. We eventually found one which looks very close to what Etsy’s listing page looks like today. Its performance was pretty close, but slightly worse than the existing listing page. So we said “OK, we’re going to take that one and we’re going to try and optimize it until it’s better.”
We did that between July and October. We used optimization tactics as much smaller A/B tests on that variant until we felt like we could release it. When we were finally out of time for the year, we had a variant that was 5% better in terms of conversions on the existing listing page. At the time, it was like 50 million dollars. So that was the best release we ever did measure by the monetary yardstick.
I think it was also the best product work we ever did. It was blending many different disciplines. So when we were doing the first phase, we were blending user feedback and qualitative research to try and figure out like why one would be better than the other. We got the release candidate and then we did A/B testing to get to the final thing.
As we conclude this chapter, we hope that these two examples have provided motivation for how powerful it can be to make data an essential part of the design process. In the next several chapters, we’ll provide a greater look into how to build and apply these practices to your own design work.
Summary
Because Chapter 4, Chapter 5, and Chapter 6 are more focused on practical application, it’s important to remember your business and experience goals, what you are designing for, and why you are testing at all. The aim of these chapters is to recognize that the main goal of gathering, analyzing, and contemplating all this data is to grasp a better understanding of your users so that you can learn to continually build better and more effective solutions for them. Adopting a data-aware approach to your design work and embracing an experimentation framework to structure your design process is fundamentally about adopting a learning mindset to your work. It is about becoming comfortable with testing your ideas and seeing if what you create has the effect or effects you expected. Even if the outcome in reality is different from your beliefs or expectations, adopting a learning mindset means you will capture and keep what you’ve learned for future work.
It is important to note that working with data as part of the design process is equal parts “art”, “craft,” and “science.” Designing tests and interpreting results is not strictly science—it relies on the art and craft of applying science to the task of identifying and addressing important business and experience questions. We want to give you a flavor for how A/B tests play into a bigger program of research, and how determining which test to do, when to do it, how to execute it, and how to interpret results is a design problem, not simply an engineered solution to business questions. We hope that the next few chapters can help you understand how to balance art, craft, and science and translate those into actionable and informative A/B tests.
Questions to Ask Yourself
What are some of the experiments that you would like to run?
Are there areas of user behavior you have addressed using other methods in the past (e.g., user interviews) that you think could be further understood by designing an experiment?
How much do you currently explicitly focus on the act of learning?
What sources of data do you have at your disposal to help you identify goals, problem/opportunity areas and potential hypotheses?