Note
Coaches, Upper Management
We inspire trust in the team’s decisions.
You’re part of a whole team. Everybody sits together. An informative workspace clearly tracks your progress. All the information you need is at your fingertips. Why do you need reports?
Actually, you don’t need them. The people who aren’t on your team, particularly upper management and stakeholders, do. They have a big investment in you and the project, and they want to know how well it’s working.
Progress reports are exactly that: reports on the progress of the team, such as an iteration demo or a release plan. Although progress reports seem to exist so that stakeholders can monitor and correct the team’s direction, that’s not their purpose. Instead, good progress reports allow stakeholders to trust the team’s decisions.
Management reports are for upper management. They provide high-level information that allows management to analyze trends and set goals. It’s not information you can pick up by casually lingering in an open workspace for an hour or two every month; it includes trends in throughput or defect rates.
What kinds of reports do you need to build trust and satisfy strategic needs? It depends on the stakeholders. Some stakeholders are hands-off and just want to see progress toward a goal; others want to know more details so they can build broader knowledge. You may need to produce a variety of reports for different audiences.
Be careful, though—reports take time and energy away from development, so don’t produce every report you can imagine. Provide just enough reporting to satisfy key stakeholders. The project manager and product manager should combine their knowledge of stakeholders to gauge the proper level of reporting. The best way to know, of course, is to ask.
The range of reports you can produce is as broad as your imagination. The following sections list some that I’ve found particularly useful or, contrarily, common and unhelpful. The first set of reports are a normal byproduct of the whole team’s work. The rest are usually the project manager’s responsibility, though they depend on some input from the rest of the team.
XP teams have a pronounced advantage when it comes to reporting progress: they make observable progress every week, which removes the need for guesswork. Furthermore, XP teams create several progress reports as a normal byproduct of their work.
Useful and free? There’s little not to like about these four reports.
Important
Your on-site customers should create and update a vision statement that describes what you’re doing, why you’re doing it, and how you’ll know if you’re successful. This provides important context for other reports. Post it prominently and reference it in conversation.
Important
Nothing is as powerful at demonstrating progress as working software. Invite stakeholders to the weekly iteration demo. They probably won’t attend every week, but the mere fact that you hold weekly demos will build confidence in your work.
The release and iteration planning boards already posted in your workspace provide great detail about progress. (See Figure 8-4, a release planning board, and Figure 8-9, an iteration planning board.) Invite stakeholders to look at them any time they want detailed status information.
For off-site stakeholders, consider using a webcam or regularly posted digital photos to broadcast the plans.
A burn-up chart is an excellent way to get a bird’s-eye view of the project (see Figure 8-7). It shows progress and predicts a completion date. Most teams produce a burn-up chart when they update their release plan.
Important
Only produce reports that are strictly necessary.
If your stakeholders want more information, consider providing one or more of the following reports. Avoid providing them by default; each takes time that you could spend on development instead.
Some stakeholders may want more detail than the vision statement provides, but not the overwhelming detail of the release and iteration plans. For these stakeholders, consider maintaining a document or slide deck that summarizes planned releases and the significant features in each one.
A weekly status email can supplement the iteration demo. I like to include a list of the stories completed for each iteration and their value. I also include our current range of probable completion scope and dates, and I explain any changes from the previous report.
If you added or removed stories from the schedule, explain that here, too. An honest appraisal of your work is part of an accurate status report.
Whereas progress reports demonstrate that the team will meet its goals, management reports demonstrate that the team is working well. As with progress reports, report only what you must.
Software development productivity is notoriously difficult to measure [Fowler 2003]. It sounds simple—productivity is the amount of production over time—but in software, we don’t have an objective way to measure production. What’s the size of a feature?
Note
We can measure the software’s size by counting function points or lines of code, but that’s akin to measuring cell phone features in cubic inches.
Instead of trying to measure features, measure the team’s impact on the business. Create an objective measure of value, such as return on investment. You can base it on revenue, cost savings, or some other valuable result.
Coming up with an objective measure of value is the most difficult part of reporting productivity. I can’t provide specific guidance because the metric depends on what’s important to your business. Your product manager and upper management should be able to help create this measure.
Once you have a measure, track its value every iteration. Until the team releases software to production, this number will trend downward, below zero. The team will be incurring costs but not generating value. After a release, the trend should turn upward.
The primary complaint I hear about this metric is that it’s partially outside of the team’s control. What if the sales staff doesn’t sell the software? What if the business users aren’t interested in the software?
These are valid concerns, but they ignore the reality of organizational success. For your team to achieve an organizational success, not just a technical success, your software must provide business value. This productivity metric reflects that fact.
Important
To score well on this metric, you should have a team that includes on-site customers. These customers will figure out what customers or users want and show key stakeholders how to sell or use the software. By doing so, they will help turn technically excellent software into truly valuable software.
Throughput is the number of features the team can develop in a particular amount of time. To avoid difficult questions such as “What’s a feature?,” measure the amount of time between the moment the team agrees to develop some idea and the moment that idea is in production and available for general use. The less time, the better.
Anyone can produce software quickly if it doesn’t have to work. Consider counterbalancing your throughput report with defect counts.
One of the biggest challenges of counting defects is figuring out the difference between a defect and intentional behavior. Decide who will arbitrate these discussions early so you can avoid arguments.
Important
When you count the defects is just as important as how you count them. On an XP team, finding and fixing defects is a normal part of the process. To avoid overcounting defects, wait until you have marked a story as “done done” and completed its iteration before marking something as a defect.
If the project is under time pressure—and projects usually are—stakeholders may want to know that the team is using its time wisely. Often, when the team mentions its velocity, stakeholders question it. “Why does it take 6 programmers a week to finish 12 days of work? Shouldn’t they finish 30 days of work in that time?”
Although I prefer that stakeholders trust the team to schedule its tasks wisely, that trust takes time to develop. In the beginning, I often produce a report that shows how the programmers are using their time. This report requires that programmers track their time in detail, so I stop producing it as soon as possible, typically after a month or two. To keep the burden low, I ask programmers to write their times on the back of each iteration task card (see Figure 6-5) and hand them in to the project manager for collating into these categories:
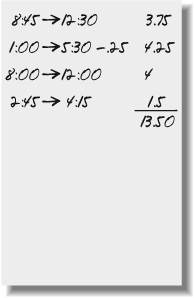
Unaccounted and nonproject work (time spent on other projects, administration, company-wide meetings, etc.)
Out of office (vacation and sick days)
Improving skills (training, research time, etc.)
Planning (time spent in planning activities, including the retrospective and iteration demo)
Developing (time spent testing, coding, refactoring, and designing)
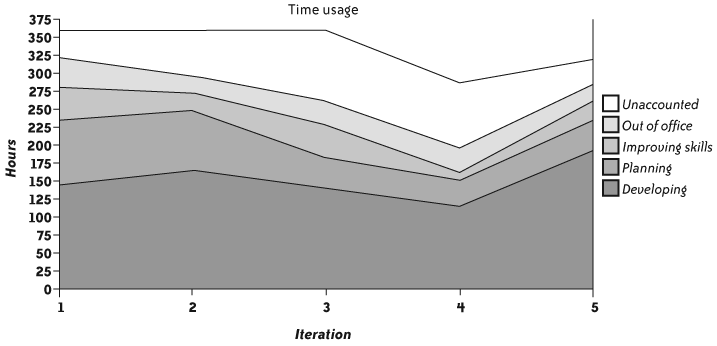
Graph the total time in each category in an area chart with “Developing” on the bottom and “Unaccounted” on top. I mark the bottom three categories green; the fourth yellow; and the top white (see Figure 6-6).
Once the report is in place, stakeholders may still wonder why velocity doesn’t match effort. Explain that velocity includes a scaling factor to account for estimate error and overhead. See Explaining Estimates” in Chapter 8 for more ideas.
Some reports, although common, don’t provide useful information. Estimating” in Chapter 8 provides suggestions for explaining your estimates and velocity.
Note
If a stakeholder asks you for one of these reports, don’t flatly refuse. Instead, find out why she wants the report and see if there’s a better way to meet her need.
Source lines of code (SLOC) and its language-independent cousin, function points, are common approaches to measuring software size. Unfortunately, they’re also used for measuring productivity. As with a fancy cell phone, however, software’s size does not necessarily correlate to features or value.
Well-designed code is modular; it supports multiple features without duplication. The better the design, the less duplication, and thus the fewer lines of code. This sort of careful design takes time and effort, but results in fewer bugs and software that’s easier to change.
Important
Reporting SLOC encourages defects and high costs.
Reporting SLOC (or function points) encourages your team to produce more lines of code per day. Rather than increasing its productivity, your team is most likely to spend less time on design quality. SLOC production will go up, true, but design quality will go down. Research shows that the more lines of code a program has, the more defects it is likely to have and the more it will cost to develop.
All in all, SLOC and function points are flawed productivity metrics. They can be useful for end-of-project comparisons to industry averages, but avoid using it in a weekly report.
Some people think they can use the number of stories delivered each iteration as a measure of productivity. Don’t do that. Stories have nothing to do with productivity.
A normal-sized team will typically work on 4 to 10 stories every iteration. To achieve this goal, they combine and split stories as needed. A team doing this job well will deliver a consistent number of stories each iteration regardless of its productivity.
Important
Never compare velocity across teams.
If a team estimates its stories in advance, an improvement in velocity may result from an improvement in productivity. Unfortunately, there’s no way to differentiate between productivity changes and inconsistent estimates. Because you can artificially improve velocity by incurring technical debt, I strongly recommend against using velocity as a measure of productivity.
Above all, never compare velocity across teams. Different teams will have different ways of estimating. Their velocities have nothing in common.
Note
Measuring the variation in velocity may produce interesting information for discussion in the retrospective (see Retrospectives” in Chapter 5), but the information is too ambiguous to report outside the team.
There’s no substitute for developer expertise in the area of code quality. The available code quality metrics, such as cyclomatic code complexity, all require expert interpretation. There is no single set of metrics that clearly shows design or code quality. The metrics merely recommend areas that deserve further investigation.
Avoid reporting code quality metrics. They are a useful tool for developers but they’re too ambiguous for reporting to stakeholders.
What do you mean, “Progress reports are for stakeholder trust”? Shouldn’t we also report when we need help with something?
Absolutely. However, progress reports are for status; you shouldn’t assume that anyone actually reads them. Sometimes their existence is enough to satisfy stakeholders that you’re on track.
Important
Talk to stakeholders directly when you need their help.
When you need a stakeholder’s help, whether to learn more about the business priorities or to overcome a hurdle, ask for it. Don’t rely on stakeholders to notice something in the reports.
What if some of our stakeholders want to micromanage us?
The product manager and project manager should manage the stakeholders. They should give them what they need while shielding the team from their micromanagement. They need to be tactful, yet firm.
Isn’t this just busywork? We have an informative workspace, stand-up meetings, and iteration demos. Stakeholders and managers can visit any time. Why do they need reports?
Ifyour stakeholders attend your meetings and get sufficient value out of them, you probably don’t need reports. In that case, the project manager should talk to stakeholders about cancelling unnecessary reports.
Until you reach that point, don’t assume that writing solid code, delivering working software, and meeting real business needs will make everyone realize your value as a team. Sometimes you just need to staple a cover page to your TPS report in order to fit in.
What if programmers don’t want to track their time for the time usage report? They say they have better things to do.
They’re right—tracking time is a wasteful activity. However, the team has to balance the need to satisfy stakeholders with the need to use its time wisely.
You can make this decision easier to swallow in two ways. First, don’t mandate the report unilaterally. Instead, discuss the reasons to produce reports as a team and come to a joint conclusion about which reports to provide. Keep in mind that some team members have greater practical insight about the consequences of reporting, or of not reporting, than others.
Second, do everything you can to keep the time-tracking burden low. When it’s time to produce the report, the project manager should collate the data rather than asking programmers to do so.
Why should the project manager do all the grunt work for the reports? Shouldn’t he delegate that work?
The project manager’s job is to help the team work smoothly. He should never add to the workload of the people on the critical path. Instead, he should remove roadblocks from the path, and reports are one of those roadblocks.
Our organization measures employees individually based on the contents of certain reports. What do we do?
XP teams produce work as a team, not individually, so this is a difficult situation. First, the project manager should review the evaluation policy with HR and upper management. If there is any flexibility in the process, take advantage of it.
If there’s no flexibility, work within the review process as much as you can. Highlight teamwork wherever possible. When the team implements a particularly valuable feature, be sure to mention everyone’s contribution.
Appropriate reporting will help stakeholders trust that your team is doing good work. Over time, the need for reports will decrease, and you will be able to report less information less frequently.
Time spent on reports is time not spent developing. Technically speaking, reports are wasteful because they don’t contribute to development progress. As a result, I prefer to produce as few reports as possible.
Important
Don’t let reporting compromise the benefits of card-based planning.
Computerized planning may seem to make reporting easier. Unfortunately, it tends to do so at the expense of collaborative, dynamic planning (see The Planning Game” in Chapter 8), and an informative workspace. That’s backward: it optimizes a wasteful activity at the expense of productive activities.
To avoid creating reports manually, I use the iteration demo, planning boards, and the burn-up chart as my only reports whenever I can. They are a normal part of the process and require no extra effort to produce. I use webcams or a digital camera to broadcast the boards if necessary.
I prefer not to report time usage, as it’s time-consuming to produce and programmers don’t like to collect the data, but I usually have to. While I only report it when I sense concern from important stakeholders about the team’s velocity, that concern is typical for companies new to XP. Reevaluate this need about once a month, and stop producing the time usage report as soon as you can.
Frequent communication can sometimes take the place of formal reporting. If this option is available to you, it’s a better option.
Why Does Software Cost So Much? [DeMarco 1995] contains an essay titled “Mad About Measurement” that discusses challenges of measuring performance, and includes a brief investigation into the results of reporting cyclomatic code complexity.
“Cannot Measure Productivity” [Fowler 2003] discusses the challenges of measuring software development productivity in more detail than I do here. http://www.martinfowler.com/bliki/CannotMeasureProductivity.html.