 Two-Minute Drill
9.01 Elementary System Administration Commands
9.02 Automate System Administration: cron and at
This final RHCSA chapter covers functional system administration tasks not already covered in other chapters. It starts with a discussion of process management and continues with the use of archive files.
In addition, this chapter helps you automate repetitive system administration tasks. Some of these tasks happen when you want to have a “life,” others when you’d rather be asleep. In this chapter, you’ll learn how to schedule both one-time and periodic execution of jobs. This is made possible with the cron and at daemons. In this case, “at” is not a preposition, but a service that monitors a system for one-time scheduled jobs. In a similar fashion, cron is a service that monitors a system for regularly scheduled jobs.
When you’re troubleshooting, system logging often provides the clues you need to solve a lot of problems. The focus in this chapter is local logging.
System Administration
Administrators work on Linux systems in a number of ways. In this chapter, you’ll learn various methods for meeting the following RHCSA objectives. The first of these objectives involves fundamental command skills:
 Archive, compress, unpack, and uncompress files using tar, star, gzip, and bzip2
These other objectives are more closely related to system administration:
Identify CPU/memory-intensive processes, adjust process priority with renice, and kill processes
Schedule tasks using at and cron
Finally, you will look at where to find information logged by the systemd journal and rsyslog. The related RHCSA objective is
Locate and interpret system log files and journals
CERTIFICATION OBJECTIVE 9.01
Several system administration commands in the RHCSA objectives are not covered in previous chapters. They’re associated with system resource management and archives. System resource management commands allow you to see what processes are running, to check the resources they’re using, and to kill or restart those processes. Archive commands support the consolidation of a group of files in a single archive, which can then be compressed.
Linux includes a variety of commands that can help you identify those processes that are monopolizing a system. The most basic of those commands is ps, which provides a snapshot of currently running processes. Those processes can be ranked with the top command, which can display running Linux tasks in order of their resource usage. With top, you can identify those processes that are using the most CPU and RAM memory. Commands that can adjust process priority include nice and renice. Sometimes it’s not enough to adjust process priority, at which point it may be appropriate to send a signal to a process with commands such as kill and killall. If you need to monitor system usage, the sar and iostat commands can also be helpful.


The objective related to system resource management is to “identify CPU/memory-intensive processes, adjust process priority with renice, and kill processes.”
It’s important to know what’s running on a Linux computer. To help with that task, the ps command has a number of useful switches. When you’re trying to diagnose a problem, one common practice is to start with the complete list of running processes and then look for a specific program. For example, if the Firefox web browser were to suddenly crash, you’d want to kill any associated processes. The ps aux | grep firefox command could then help you identify the process(es) that you need to kill.

The pgrep command is also useful because it combines the features of ps and grep. In this case, the pgrep -a firefox command is functionally equivalent to ps aux | grep firefox.
The ps command by itself is usually not enough. All it does is identify those processes running in the current terminal. This command typically returns just the process associated with the current shell, and the ps command process itself.
To identify those processes associated with a username, the ps -u username command can help. Sometimes there are specific users who may be problematic for various reasons. So if you’re suspicious of user mjang, the following command can help you review every process currently associated with that user:

As an administrator, you may choose to focus on a specific account for various reasons, such as activity revealed by the top command, described in the next section. Alternatively, you may want to audit all currently running processes with a command such as the following:

FIGURE 9-1 Output from the ps aux command
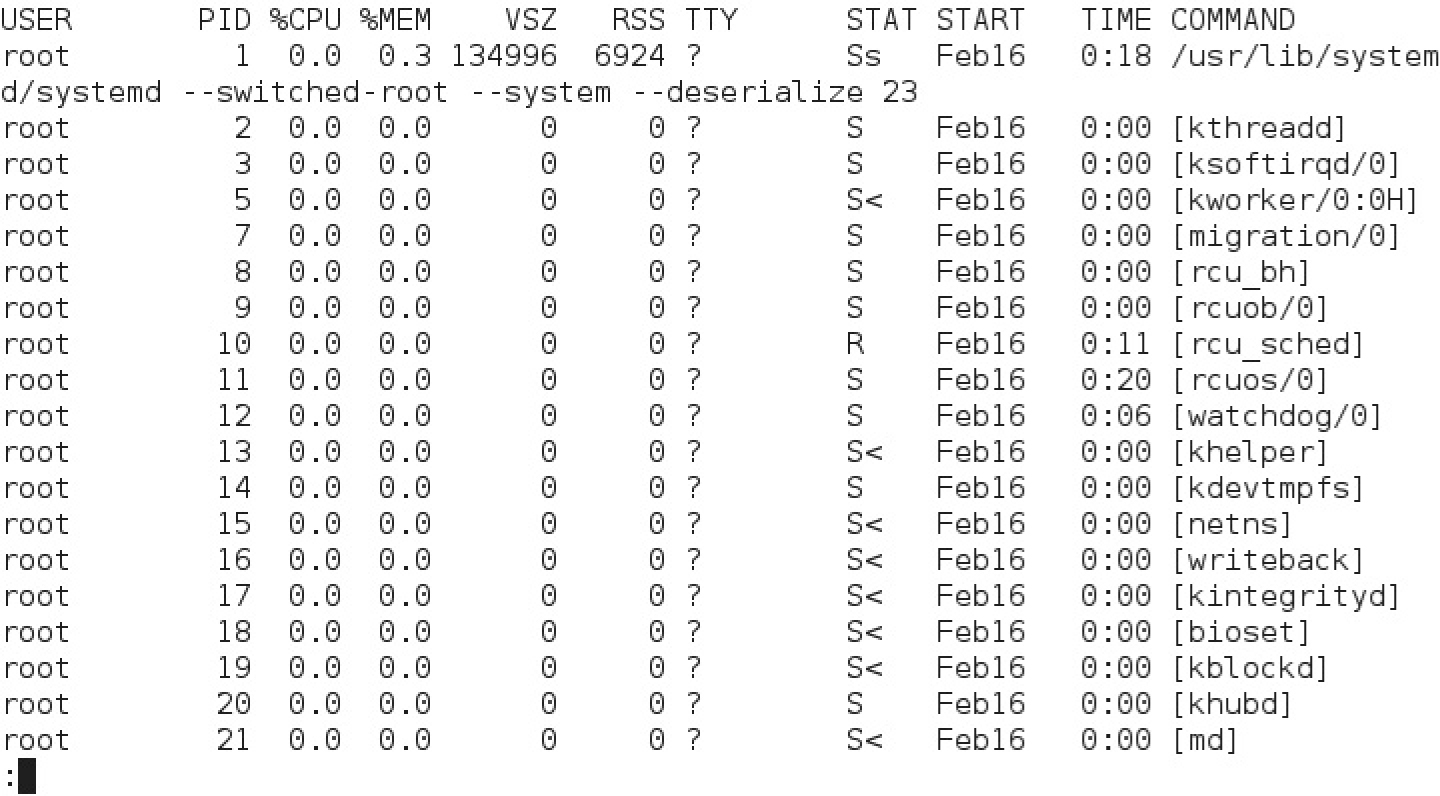
The ps aux command gives a more complete database of currently running processes, in order of their PIDs. The a option lists all running processes, the u displays the output in a user-oriented format, and the x lifts the standard limitation that listed processes must be associated with a terminal or console. One example is shown in Figure 9-1. While the output can include hundreds of processes and more, the output can be redirected for further analysis with commands such as grep. The output columns shown in Figure 9-1 are described in Table 9-1.
Incidentally, you may note that the ps aux command does not include the familiar dash in front of the aux switches. In this case, the command works with and without the dash (although slightly differently). Valid command options with the dash are also known as UNIX or POSIX style; in contrast, options without the dash are known as BSD style. The following alternative includes current environmental variables for each process:

Processes can be organized in a tree format. Specifically, the first process, with a PID of 1, is systemd. That process is the base of the tree, which may be shown with the pstree command. In a few cases, it’s not possible to use a standard kill command to kill a process. In such cases, look for the “parent” of the process in the tree. You can identify the parent of a process, known as the PPID, with the following command:

TABLE 9-1 Columns of Output from ps aux

The l switch displays the output in long format and is not compatible with the u switch. You can view the PID and PPIDs of all running processes in Figure 9-2.
With the -Z switch (that’s an uppercase Z), the ps command can also identify the SELinux contexts associated with a process. For example, the following command includes the SELinux contexts of each process at the start of the output. If you’ve read Chapter 4, the contexts should already seem familiar. For example, contrast the context of the vsFTP server process with the following excerpt:

FIGURE 9-2 Output from the ps axl command

Contrast that with the context of the actual daemon. The object role works with the actual daemon; you can review it with other daemons in the /usr/sbin directory. The vsftpd daemon works with the associated configuration file with the etc_t type. In contrast, the vsftpd daemon alone is executable with the ftpd_exec_t type.

The role of different daemons and their corresponding processes should match and contrast in a similar fashion. If they don’t, the daemon may not work, and the problem should be documented in the audit log, described in Chapter 4, in the /var/log/audit directory.
The top command sorts active processes first by their CPU load and RAM memory usage. Take a look at Figure 9-3. It provides an overview of the current system status, starting with the current uptime, number of connected users, active and sleeping tasks, CPU load, and more. The output is, in effect, a task browser.
FIGURE 9-3 Output from the top command
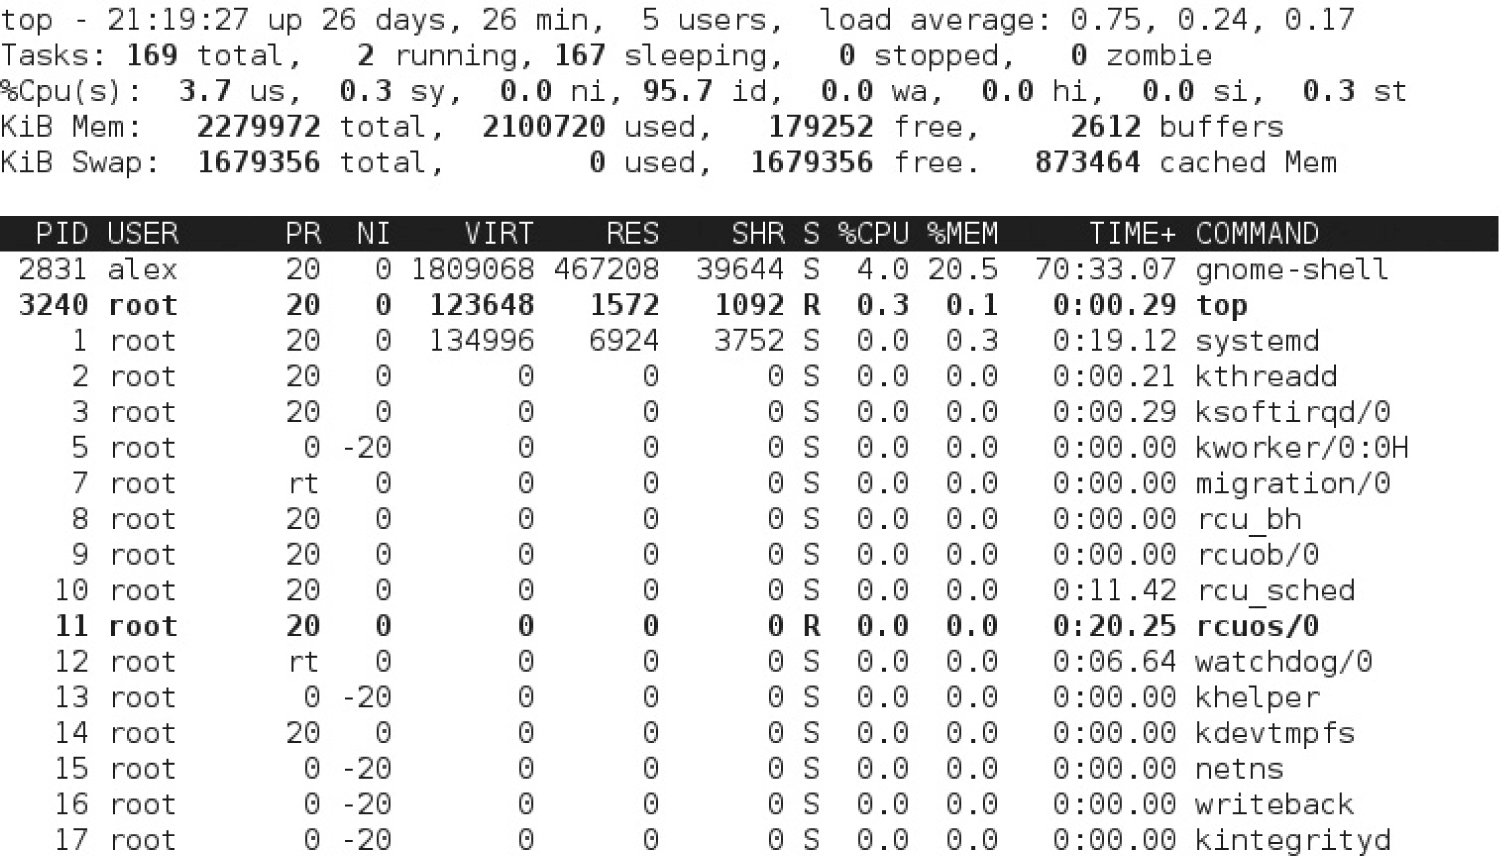
TABLE 9-2 Additional Columns of Output from top

The default sort field is CPU usage. In other words, the process that’s taking the most CPU resources is listed first. You can change the sort field with the help of the left and right directional (<, >) keys. Most of the columns are the same as shown in Figure 9-2, as detailed in Table 9-1. The additional columns are described in Table 9-2.
One problem with the top and ps commands is that they display the status of processes on a system as a snapshot in time. That may not be enough. Processes may load a system for just a blip of time, or even periodic blips in time. One way to find more information about the overall load on a system is with two commands from the sysstat package: sar and iostat. That system activity information is logged courtesy of the sa1 and sa2 commands associated with the /etc/cron.d/sysstat script, which will be described shortly.
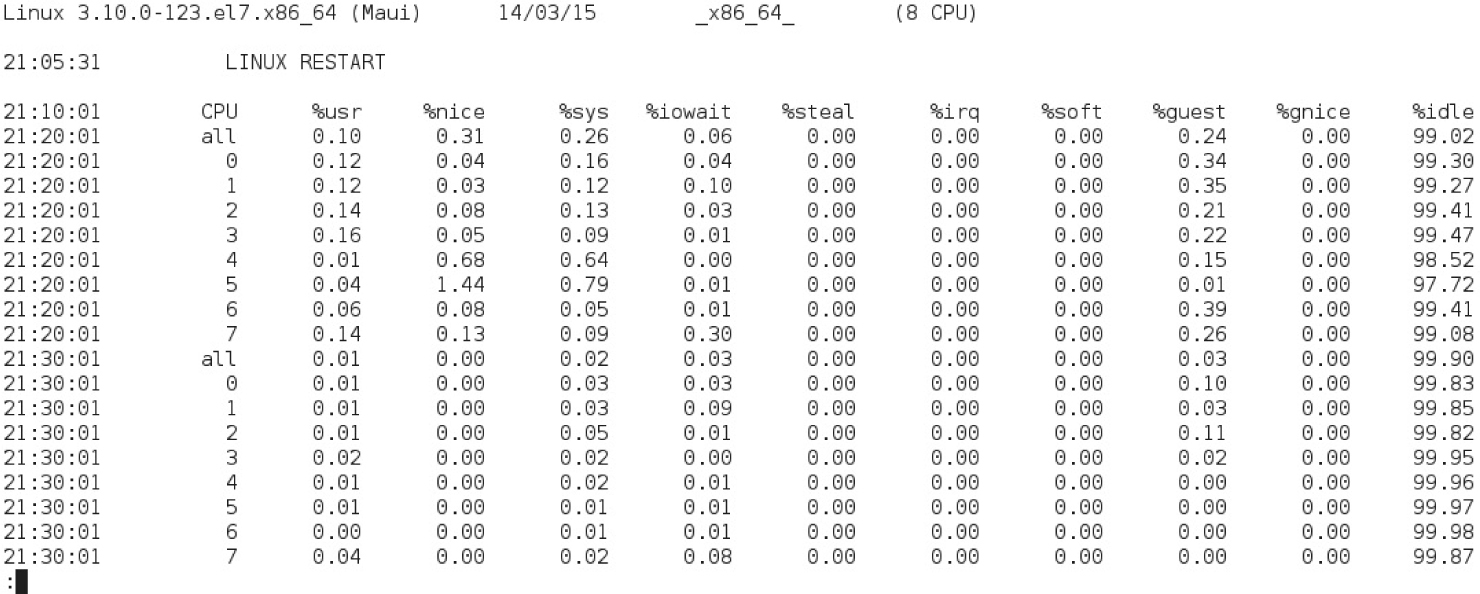
The sar command, in essence, can be used to provide a system activity report. For example, Figure 9-4 shows the output of the sar -A command. As you can see, the output shows various CPU measures at different points in time. The default settings measure CPU load at 10-minute intervals. This system has eight logical CPUs (four cores with hyper-threading enabled), which are measured individually and as a whole. The large idle numbers shown in the figure are a good sign that the CPU is not being overloaded; however, the figure shows the load for less than an hour.
The 10-minute intervals associated with the sar command output are driven by a regular job in the /etc/cron.d directory. The output from those reports is collected in log files in the /var/log/sa directory. The filenames are associated with the numeric day of the month; for example, system activity report status for the 15th of the month can be found in the sa15 file in the noted directory. However, such reports are normally stored at least for the last 28 days, based on the following default in the /etc/sysconfig/sysstat file:

FIGURE 9-4 Output from the sar -A command
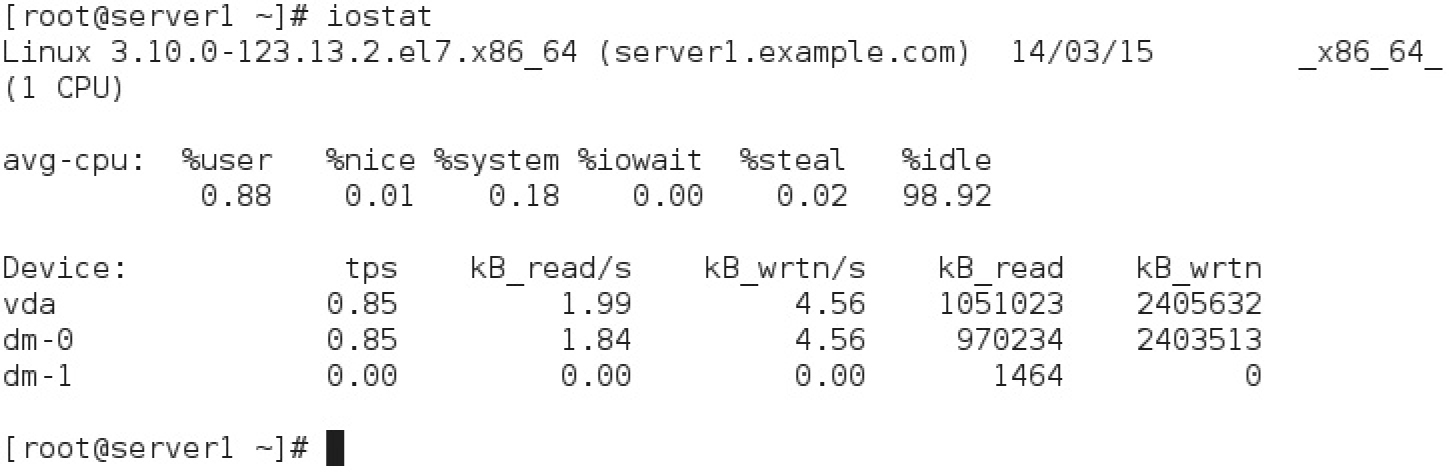
In contrast to sar, the iostat command reports more general input/output statistics for the system, not only for the CPU, but also for connected storage devices, such as local drives and mounted shared NFS directories. The example shown in Figure 9-5 displays information for the CPU and the storage devices since system startup on server1.example.com.
Both the sar and the iostat command can capture statistics at regular intervals. As an example, the following command shows CPU and storage device statistics every five seconds and stops after a minute (12 reports):

FIGURE 9-5 CPU and storage device statistics
The sa1 and sa2 commands are often used to collect system activity report data. In the /etc/cron.d/sysstat script, the sa1 command is used to gather system activity data every 10 minutes. In that same cron file, the sa2 command writes a daily report in the /var/log/sa directory. As noted in the script, that report is processed every day, at seven minutes before midnight.
The nice and renice commands can be used to manage the priority of different processes. Whereas the nice command is used to start a process with a different priority, the renice command is used to change the priority of a currently running process.
Process priorities in Linux specify numbers that seem counterintuitive. The range of available nice numbers can vary from –20 to 19. The default nice number of a process is inherited from the parent and is usually 0. A process given a priority of 19 will have to wait until the system is almost completely free before taking any resources. In contrast, a process given a priority of –20 takes precedence over all other processes. In practice, this is true for almost all processes because “real-time” tasks take precedence over the lowest nice value of –20. But this is outside of the scope of the RHCSA exam, so ignore the existence of real-time processes for now, and for the sake of this discussion assume that all normal processes can be assigned a nice value from –20 to 19.
The nice command prefaces other commands. For example, if you have an intensive script to be run at night, you might choose to start it with a command like the following:

This command starts the noted script with the lowest possible priority. If started at night (or at some other time when a system is not loaded by other programs), the script is run until just about any other job, such as a script in one of the /etc/cron.* directories, is scheduled for execution. Because such scripts are run on a schedule, they normally should take priority over some user-configured programs.
Sometimes a program is just taking up too many resources. If you don’t want to kill a process, you can lower its priority with the renice command. Normally, the easiest way to identify a process that’s taking up too many resources is with the top command. Identify the PID that’s taking up too many resources. That PID number is in the left-hand column of the output.
If the PID of your target process is 1234, the following command would change the nice number of that process to 10, which gives that process a lower priority than the default of 0:

If you want to decrease the nice level of a process, you must run renice as root. Even though the output of the command refers to the “priority,” it really is just listing the old and new “nice” numbers for the process:

The new nice number is shown in the output to the top command, under the NI column.
Sometimes, it’s not enough to reprioritize a process. Some processes can just overwhelm a system. In most cases, you can stop such difficult processes with the kill and killall commands. In many cases, you can kill a process directly from the top task browser.
If there’s a situation where a process is taking up a lot of memory or CPU, it’s probably slowing down everything else running on that system. As shown in Figure 9-6, Firefox has loaded the CPU of the noted system pretty heavily. If it were unresponsive, we’d press k from the top task browser.
As shown in the figure, the k command reveals the PID To Signal/Kill: prompt, where we enter the PID of the Firefox process or accept the default of 4537, which appears to be Firefox. It applies the default signal (SIGTERM) to the process with that PID number.
Of course, you could apply the kill command directly to a PID number. For example, the following command is equivalent to the steps just described in the top task browser:

FIGURE 9-6 The top task browser with heavy Firefox load

TABLE 9-3 A List of Common POSIX Signals

The kill command can be run by the owner of a process from his account. Thus, user alex could run the kill 4537 command from his regular account because he has administrative privileges over processes associated with his username.
Despite its name, the kill command can send a wide variety of signals to different processes. For a full list, run the kill -l command or type man 7 signal. Table 9-3 lists some of the most common signals.
Before the advent of systemd and scripts in the /etc/init.d directory, the kill -1 command was used to send a configuration reload signal to service daemons. For example, if the PID number of the main process associated with the Apache web server is 2059, the following command is functionally equivalent to the systemctl reload httpd command:

Without the -1 switch (and that’s a dash number 1), the kill command, under normal circumstances, would terminate the given process. In this case, it would terminate the Apache web server. But sometimes, processes get stuck. In some such cases, the kill command does not work by itself. The process continues running. In that case, you can try two things.
First, you could try the kill -9 command, which attempts to stop a process “uncleanly” by sending a SIGTERM signal. If it is successful, other related processes may still remain in operation.
Sometimes, a number of processes are running under the same name. For example, as you’ll see in Chapter 14, the Apache web server starts several processes that run simultaneously. It’s at best inefficient to kill just one process; the following command would kill all currently running server processes, assuming no other issues:

Linux includes a variety of commands to archive groups of files. Some archives can be reprocessed into packages such as RPMs. Other archives are just used as backups. In either case, archives can be a terrific convenience, especially when compressed. This section explores the archive and compression commands specifically cited in the RHCSA objectives. These “essential tools” include the gzip, bzip2, tar, and star commands.
The gzip and bzip2 commands are functionally similar as they compress and decompress files, just using different algorithms. The gzip command uses the DEFLATE algorithm, whereas the bzip2 command uses the Burrows-Wheeler block sorting algorithm. While they both work well, the bzip2 command has a better compression ratio. For example, either of the two following commands could be used to compress a big document file named big.doc:
This adds a .gz or a .bz2 suffix to the file, compressed to the associated algorithms. With the -d switch, you can use the same commands to reverse the process:

As an alternative, the gunzip and bunzip2 commands can be used for the same purpose.
The tar command was originally developed for archiving data to tape drives. However, it’s commonly used today for collecting a series of files, especially from a directory, in a single archive file. For example, the following command backs up the information from the /home directory in the home.tar.gz file:

Like the ps command, this is one of the few commands that does not require a dash in front of the switch. This particular command creates (c) an archive, compresses (z) it, in verbose (v) mode, with the filename (f) that follows. Alternatively, you can extract (x) from that file with the following command:

The compression specified (z) is associated with the gzip command; if you wanted to use bzip2 compression, substitute the j switch. The tar command can store and extract access control list settings or SELinux attributes with the --selinux option.
If you have a tar archive created without the --selinux option, you can compensate. You can use commands such as restorecon, as described in Chapter 4, to restore the SELinux contexts of an archive.
The star command gained some popularity because it was the first to introduce support for archiving files in a SELinux system. As the star command is not normally installed, you’ll need to install it; one method is with the following command:

Unfortunately, the star command doesn’t quite work in the same fashion as tar. If you ever have to use the star command, do practice the command. For example, the following command would create an archive, with all SELinux contexts, from the current /home directory:

The -xattr switch saves the extended attributes associated with SELinux. The -H=exustar switch records the archive using the exustar format, which allows you to store ACLs if the -acl option is specified. The -c creates a new archive file. The -f specifies the name of the archive file.
Once the archive is created, it can be unpacked with the following command, which extracts the archive:

If desired, the archive can be compressed with the aforementioned gzip or bzip2 command, or from star with the -z or -bz command-line option. The star -x command can detect and restore files from archives configured with various compression schemes. For example, based on a gzip-compressed archive, the star command unpacks that archive, as noted by the following log information message:

The cron system is essentially a smart alarm clock. When the alarm sounds, Linux runs the commands of your choice automatically. You can set the alarm clock to run at all sorts of regular time intervals. Many cron jobs are scheduled to run during the middle of the night, when user activity is lower. Of course, that timing can be adjusted. Alternatively, the at system allows users to run the commands of their choice, once, at a specified time in the future.
Because cron always checks for changes, you do not have to restart cron every time a change has been made.
RHEL 7 installs the cron daemon by default and incorporates the anacron system in cron. The cron daemon starts jobs on a regular schedule. The anacron system helps the cron daemon work on systems that are powered off at night. This ensures that important jobs are always run, even if a system was powered off for a period of time.
The cron system is configured to check the /var/spool/cron directory for jobs by user. In addition, it incorporates jobs defined in the /etc/anacrontab file, based on the 0anacron script in the /etc/cron.hourly directory. It also checks for scheduled jobs for the computer described in the /etc/crontab file and in the /etc/cron.d directory.
The /etc/crontab file is set up in a specific format. Each line can be blank, a comment (which begins with #), a variable, or a configuration line. Naturally, blank lines and comments are ignored. In some Linux distributions, that file includes a schedule of jobs. In RHEL 7, the default crontab file just includes the format for other related configuration files.
Users run regular commands. Anyone who runs a new process, whether it be you or a daemon, inherits an “environment” that is made of various environmental variables. To see the environmental variables for the current user, run the env command. If that user is your account, some of the standard variables in RHEL include HOME, which should match your home directory, SHELL, which should match the default shell, and LOGNAME as the username.
Other variables can be set in the /etc/crontab and other cron files (in /etc/cron.d, /etc/cron.daily, and so on):

Some variables are already set for you. For example, MAIL is /var/spool/mail/michael if your username is michael, LANG is en_US.UTF-8, and PATH is where the shell looks for commands. You can set these variables to different values in various cron configuration files. For example, the default /etc/crontab file includes the following variables:

Note that the values of PATH and MAILTO are different from standard environment variables. The PATH variable in a cron configuration file may be different from the PATH variable associated with a shell. In fact, the two variables are independent. Therefore, you’ll want to specify the exact path of every command in each cron configuration file if it isn’t in the crontab PATH.
The MAILTO variable can help you administer several Linux systems. The cron daemon sends by e-mail any output that a job sends to stdout or stderr. Just add a line such as MAILTO=me@example.net to route all the output of cron jobs to that e-mail address.
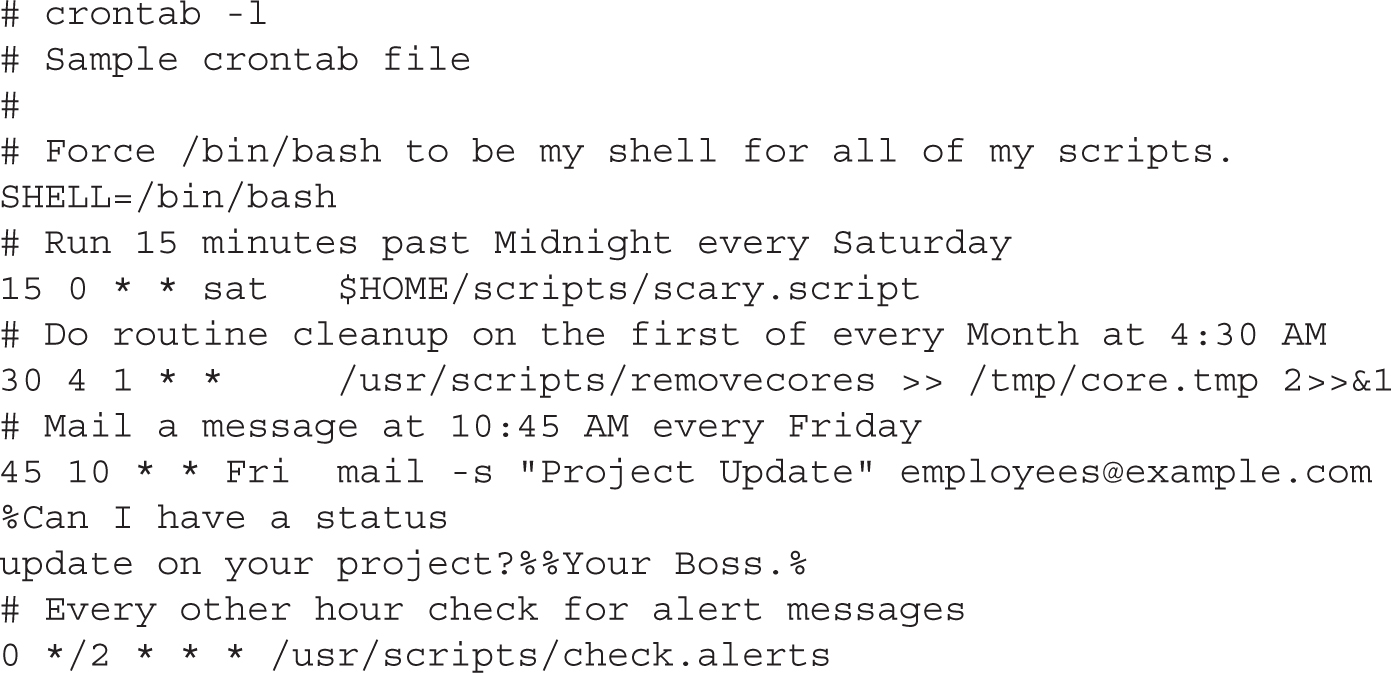
The format of a line in /etc/crontab is now detailed in comments, as shown in Figure 9-7. Each of these columns is explained in more detail in Table 9-4.
If you see an asterisk in any column, the cron daemon runs that command for all possible values of that column. For example, an * in the minute field means that the command is run every minute during the specified hour(s). Consider the example shown here:

This line runs the ls command every April 3 at 5:01 A.M. The asterisk in the day of week column simply means that it does not matter what day of the week it is; crontab still runs the ls command at the specified time.
FIGURE 9-7 The format of a crontab

TABLE 9-4 Columns in a cron Configuration File
The entries associated with the cron daemon are flexible. For example, a 7–10 entry in the hour field would run the specified command at 7:00 A.M., 8:00 A.M., 9:00 A.M., and 10:00 A.M. A list of entries in the minute field, such as 0,5,10,15,20,25,30,35,40,45,50,55, would run the specified command every five minutes. But that’s a lot of numbers. The entry */5 in the minute field would lead to the same result. The cron daemon also recognizes abbreviations for months and the day of the week.
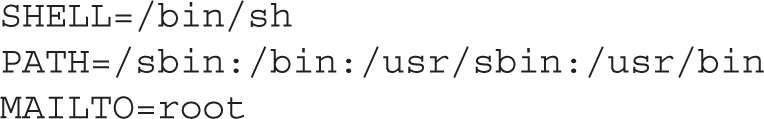
The actual command is the sixth field. You can set up new lines with a percent (%) symbol. All the text after the first percent sign is sent to the command as standard input. This is useful for formatting standard input. The following is an example of a cron file:
Now it’s time for some sample cron files. The files and scripts discussed are limited to those seen on the server1.example.com system. A number of different packages add their own cron jobs. Certain jobs associated with the cron daemon are run every hour, based on the 0hourly script in the /etc/cron.d directory. This file includes the same variables as the /etc/crontab file just described. For hourly jobs, it includes one line:

Given the information provided in the preceding section, you should be able to read this line. The run-parts command loads each script in the directory that follows; the scripts in that directory are executed as the root user. Of course, the first five columns specify the time; the scripts are run at one minute past the hour, every hour, every day, every month, on each day of the week.
The script of interest in the /etc/cron.hourly directory is 0anacron, which reviews the contents of the /var/spool/anacron/cron.daily file to see if the anacron command has been run in the current day. If not, and if the system is not running on battery (for example, on a laptop disconnected from main power), the /usr/sbin/anacron -s command is executed, which runs scripts defined in the /etc/anacrontab configuration file.
The system status script described earlier is stored in the /etc/cron.d/sysstat file. There are two active commands in that file. The first command, sa1, is run every 10 minutes, as depicted by */10. This command is run every hour, every day, and so on.

The second command, sa2, is run at 53 minutes after the hour, on the 23rd hour of each day. In other words, the system activity report is not collected until 11:53 P.M. at night.

The 0anacron script in the /etc/cron.hourly directory described earlier executes the anacron command after a system has been powered up. That command executes three scripts defined in the /etc/anacrontab file. This includes three environment variables that should seem familiar:
The SHELL directive may appear a bit different, but the ls -l /bin/sh command should confirm a soft link to the /bin/bash command, which starts the default bash shell. The following directive means that scripts are run at a random time of up to 45 minutes after the scheduled time:

With the following directive, anacron jobs are run only between the hours of 3 A.M. and 10:59 P.M.

While the format of /etc/anacrontab is similar to the format listed in a script for a regular cron job, there are differences. The order of data in each line is specified by the following comment:

The period in days is 1, 7, or @monthly, because the number of days in a month varies. The delay in minutes is associated with the RANDOM_DELAY directive. Since the /etc/anacrontab file is executed through the /etc/cron.d/0hourly script, the clock starts one minute after the hour, after the system has been started. The delay in minutes comes before the RANDOM_DELAY directive.
In other words, based on the following line, the scripts in the /etc/cron.daily directory may be run anywhere from 5 to 50 minutes after the anacron command is run, or 6 to 51 minutes after the hour:

For more examples, review some of the scripts in the /etc/cron.daily directory. Here are three key scripts you should investigate:
logrotate Rotates log files
mlocate Updates the “locate” file database
man-db.cron Creates or updates the mandb database
Each user can use the crontab command to create and manage cron jobs for their own accounts. Four switches are associated with the crontab command:
-u user Allows the root user to edit the crontab of another specific user.
-l Lists the current entries in the crontab file.
-r Removes cron entries.
-e Edits an existing crontab entry. By default, crontab uses vi, unless a different editor is specified via the EDITOR environment variable.
To set up cron entries on your own account, start with the crontab -e command. Normally, it opens a file in the vi editor, where you can add appropriate variables and commands, similar to what you’ve seen in other cron job files.
Once the cron job is saved, you can confirm the change with either the crontab -l command or, as the root user, by reading the contents of a file in the /var/spool/cron directory associated with a username. All current cron jobs for a user can be removed with the crontab -r command.
EXERCISE 9-1
In this exercise, you will modify your crontab to read a text file at 1:05 P.M. every Monday in the month of January. To do this, use the following steps:
1. Log in as a regular user.
2. Create a ~/bin directory. Add a file called taxrem.sh, which reads a text file from your home directory. A command such as the following in the taxrem.sh file should suffice:

Make sure to add appropriate lines to the reminder.txt file in your home directory, such as “Don’t forget to do your taxes!” Make sure the taxrem file is executable with the chmod +x ~/bin/taxrem.sh command.
3. Open up the crontab for your account with the crontab -e command.
4. Add an appropriate command to the crontab. Based on the conditions described, it would read as follows:

5. Don’t forget directives such as MAILTO=user@example.com at the start of the crontab.
6. Save and exit. Run crontab -l and confirm the existence of the user cron file in the /var/spool/cron directory. That file should have the same name as the user.
Like cron, the at daemon supports job processing. However, you can set an at job to be run once. Jobs in the cron system must be set to run on a regular basis. The at daemon works in a way similar to the print process; jobs are spooled in the /var/spool/at directory and run at the specified time.
TABLE 9-5 Examples of the at Command
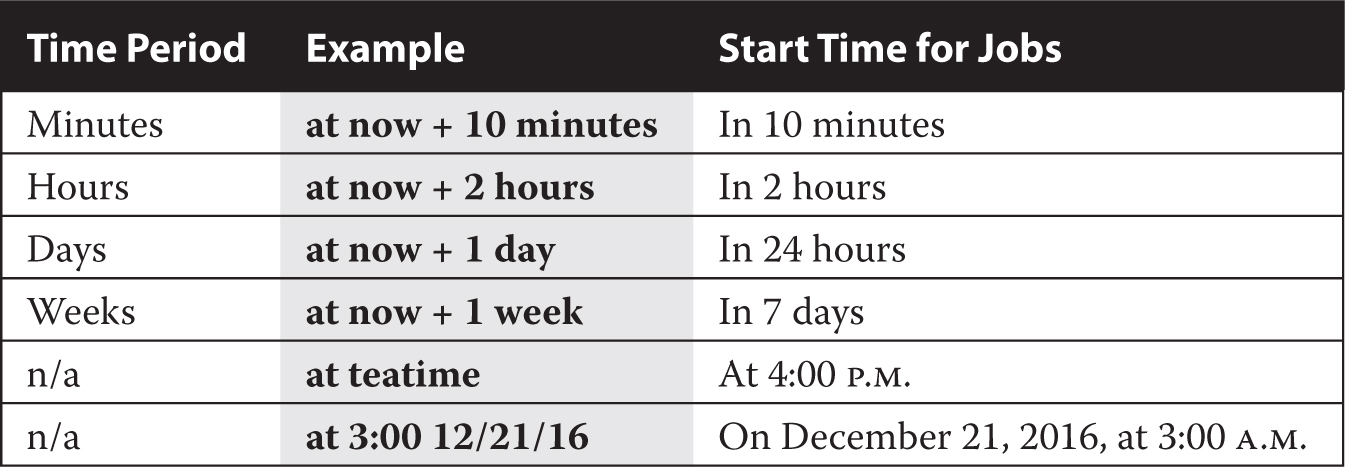
You can use the at daemon to run the command or script of your choice. For the purpose of this section, assume that user michael has created a script named 797.sh in his home directory to process some airplane sales database.
From the command line, you can run the at time command to start a job to be run at a specified time. Here, time can be now; in a specified number of minutes, hours, or days; or at the time of your choice. Several examples are illustrated in Table 9-5.
You can use one of the sample commands shown in Table 9-5 to open an at job. It opens a different command-line interface, where you can specify the command of your choice. For this example, assume you’re about to leave work and want to start the job in an hour. From the conditions specified, run the following commands:

The CTRL-D command exits the at shell and returns to the original command-line interface. As an alternative, you can use input redirection, as follows:

The atq command, as shown here, checks the status of the current at jobs. All jobs that are pending are listed in the output to the atq command:

If there’s a problem with the job, you can remove it with the atrm command. For example, you can remove the noted job, labeled job 1, with the following command:

You may not want everyone to be able to run a job in the middle of the night. You may also want to restrict this privilege for security reasons.
Users can be configured in /etc/cron.allow and /etc/cron.deny files. If neither of these files exist, cron usage is restricted to the root administrative user. If the /etc/cron.allow file exists, only users named in that file are allowed to use cron. If there is no /etc/cron.allow file, only users named in /etc/cron.deny can’t use cron.
These files are formatted as one line per user; if you include the following entries in /etc/cron.deny, and the /etc/cron.allow file does not exist, users elizabeth and nancy aren’t allowed to set up their own cron scripts:

However, if the /etc/cron.allow file does exist with the same list of users, it takes precedence. In that case, both users elizabeth and nancy are allowed to set up their own cron scripts. The range of possibilities is summarized in Table 9-6.
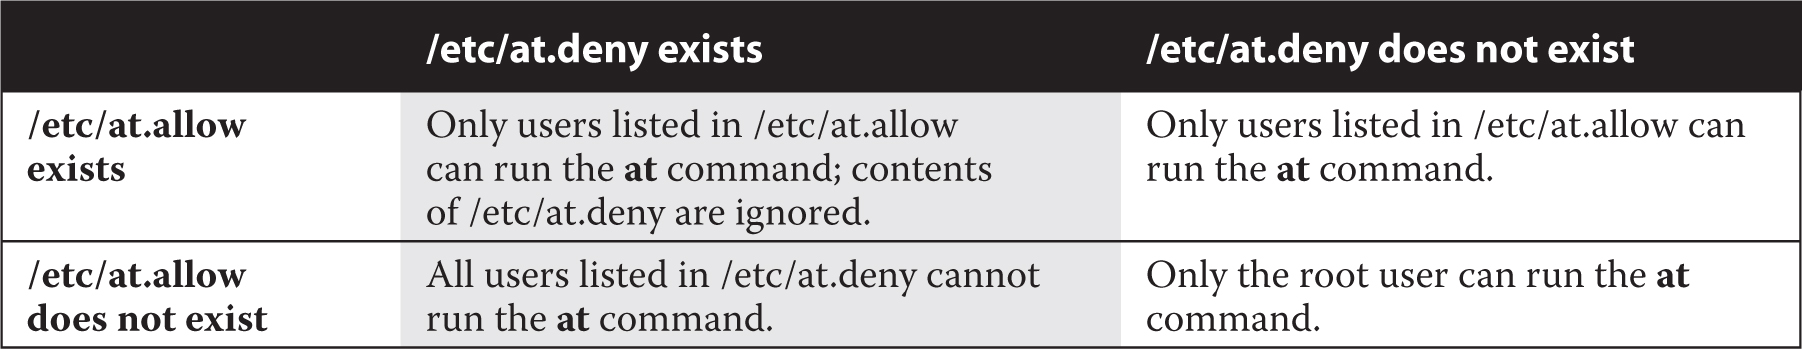
User security for the at system is almost identical. The corresponding security configuration files are /etc/at.allow and /etc/at.deny. The range of possibilities is summarized in Table 9-7.
If you’re paranoid about security, it may be appropriate to include only desired users in the /etc/cron.allow and /etc/at.allow files. Otherwise, a security breach in a service account may allow a “black hat” hacker to run a cron or at script from the associated account.
TABLE 9-6 Security Effects of cron.allow and cron.deny

TABLE 9-7 Security Effects of at.allow and at.deny
An important part of maintaining a secure system is monitoring those activities that take place on the system. If you know what usually happens, such as understanding when users log in to a system, you can use log files to spot unusual activity. Red Hat Enterprise Linux comes with new system-monitoring utilities that can help identify the culprit if there is a problem.
RHEL 7 comes with two logging systems: a traditional logging service, rsyslog, and an enhanced logging daemon known as systemd-journald. We briefly discussed systemd logging in Chapter 5. Thanks to its architecture, systemd can intercept and save all boot and syslog messages, along with the output that services send to standard error and to standard output. This is much more than what a traditional syslog server can do. By default, systemd journal logs are stored temporarily (in a RAM tmpfs filesystem) in the /run/log/journal directory.
The rsyslog daemon includes the functionality of the kernel and system logging services used through RHEL 7. You can use the log files thus generated to track activities on a system. The way rsyslog logs output to files is based on the configuration defined in the /etc/rsyslog.conf file and on the files in the /etc/rsyslog.d directory.
In many cases, services such as SELinux, Apache, and Samba have their own log files, defined within their own configuration files. Details are addressed in the chapters associated with those services.
You can configure what is logged through the /etc/rsyslog.conf configuration file. As shown in Figure 9-8, it includes a set of rules for different facilities: authpriv, cron, kern, mail, news, user, and uucp.
Each facility is also associated with several different levels of logging, known as the priority. In ascending order, log priorities are debug, info, notice, warn, err, crit, alert, emerg. There’s also a generic none priority that logs no messages of the specific facility; for example, an authpriv.none directive would omit all authentication messages.
For each facility and priority, log information is sent to a specific log file. For example, consider the following line from /etc/syslog.conf:

FIGURE 9-8 The rsyslog.conf configuration file

This line sends log information from all of the given facilities to the /var/log/messages file. This includes all facility messages of info level and higher, except for log messages related to the mail, authpriv (authentication), and cron services.
You can use the asterisk as a wildcard in /etc/syslog.conf. For example, a line that starts with *.* tells the rsyslogd daemon to log everything. A line that starts with authpriv.* means you want to log all messages from the authpriv facility.
By default, rsyslogd logs all messages of a given priority or higher. In other words, a cron.err line will include all log messages from the cron daemon at the err, crit, alert, and emerg levels.
Most messages from the rsyslogd daemon are written to files in the /var/log directory. You should scan these logs on a regular basis and look for patterns that could indicate a security breach. It’s also possible to set up cron jobs to look for such patterns.
Logs can easily become very large and difficult to read. By default, the logrotate utility creates a new log file on a weekly basis, using the directives in the /etc/logrotate.conf file, which also pulls in directives from files in the /etc/logrotate.d directory. As shown in Figure 9-9, the directives in the file are straightforward and well explained by the comments.
FIGURE 9-9 Log rotation configured in /etc/logrotate.conf

Specifically, the default settings rotate log files on a weekly basis, storing the past four weeks of logs. New log files are created during the rotation, and older files have the date of rotation as a suffix. Different provisions are given to wtmp and btmp logs, related to user login records.
Various log files and their functionality are described in Table 9-8. These files are created based on the previously described configuration of the /etc/rsyslog.conf file and of service configuration files in the /etc/rsyslog.d directory. Some of the log files (such as those in /var/log/httpd) are created directly by applications. All files shown are in the /var/log directory. If you haven’t installed, activated, or used the noted service, the associated log file may not appear. In contrast, you may see log files not shown here based on additional installed services.
TABLE 9-8 Standard Red Hat Log Files

As suggested earlier, a number of services control their own log files. The log files for the vsFTP server, for example, are configured in the vsftpd.conf file in the /etc/vsftpd directory. As noted from that file, the following directive enables the logging of both uploads and downloads in the /var/log/xferlog file:

The logging of other services may be more complex. For example, separate log files are configured for access and errors in the Apache web server in the /var/log/httpd directory.
EXERCISE 9-2
In this exercise, you’ll inspect the log files on a local system to try to identify different problems.
1. Restart the Linux computer. Log in as the root user. Use the wrong password once.
2. Log in properly with the correct password as the root user.
3. In a console, navigate to the /var/log directory and open the file named “secure.” Navigate to the “Failed password” message closest to the end of the file. Review what happened. Close the file.
4. Review other logs in the /var/log directory. Use Table 9-8 for guidance. Look for messages associated with hardware. What log files are they in? Does that make sense?
5. Most, but not all, log files are text files. Try reading the lastlog file in the /var/log directory as a text file. What happens? Try the lastlog command. Are you now reading the contents of the /var/log/lastlog file? Can you confirm this from the associated man page?
Aside from initializing the system and managing services, systemd also implements a powerful logging system. By default, logs are stored in a ring buffer using a binary format inside the directory /run/log/journal, and they do not persist a system reboot. In Chapter 5 we briefly introduced journalctl and explained how to enable persistent logging. In this section, we will review some of the basic functionalities of the journalctl command and show how to perform advanced searches.
One of the main advantages of the systemd journal over rsyslog is that it can store not just kernel and syslog messages, but also any other output that services send to their standard output or standard error. You don’t need to know where a daemon sends its logs because everything is captured by systemd and logged into the journal. The journal is indexed so that it can be easily searched using different options.
By default, the journalctl command shows all the messages in the journal in a paged format, chronologically. It displays messages of err and crit severity in bold, and it shows alert and emerg lines in red. A useful command switch is -f, which works in a similar way to the tail -f command, by displaying the last 10 log entries and continuously printing any new log entries as they are appended to the journal.
You can filter the output of journalctl in several ways. You can use the -p switch to display messages whose priority is the same or higher than the one specified. As an example, the following command shows only entries of priority err or above:

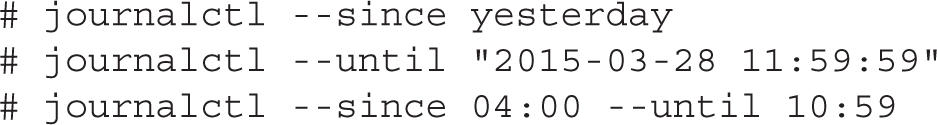
The command switches --since and --until can restrict the output to a specified time range. The next examples should be self-explanatory:
You can also filter the output by looking at the most recent journal entries via the -n option. For example, you can run the next command to show the last 20 lines in the journal:

But there’s more. Each entry in the systemd journal has a set of metadata that you can display with the -o verbose switch. Figure 9-10 shows how a journal entry looks when enabling verbose output.
The journalctl command can filter the output using any of the fields listed in Figure 9-10. For example, the following command shows all log entries associated with user ID 1000:

Similarly, the next example displays all journal entries related to the nslcd daemon:

You can also specify multiple conditions on the same line. As you get more practice with the journalctl command, you will find that the systemd journal is very robust and flexible, and can be queried using a myriad of different options.
FIGURE 9-10 A journal entry with metadata


RHEL 7 includes a variety of system administration commands that can help you monitor and manage the resources used on a system. These commands include ps, top, kill, nice, and renice. In addition, with the right commands, you can create archives. However, special command options are required to back up files with specialized attributes such as those based on ACLs and SELinux.
The cron and at daemons can help you manage what jobs are run on a system on a schedule. With related configuration files, access to these daemons can be limited to certain users. While cron configuration files follow a specific format documented in /etc/crontab, those configuration directives have been integrated with the anacron system that supports job management on systems that are powered off on a regular basis.
RHEL 7 includes two logging systems—the systemd journal and the rsyslog daemon—that are configured primarily for local systems in the /etc/rsyslog.conf file. Log entries are normally collected by systemd in the /run/log/journal directory, whereas rsyslog stores log files permanently in the /var/log directory. The rsyslog daemon also supports the creation of a logging server that can collect log file information from a variety of systems.
 TWO-MINUTE DRILL
Here are some of the key points from the certification objectives in Chapter 9.
 The ps command can identify currently running processes.
The top command starts a task browser that can identify processes utilizing excessive resources on the system.
The sar and related commands provide system activity reports.
The iostat command can provide CPU and storage device statistics.
The nice and renice commands can be used to reprioritize processes.
The kill and killall commands can be used to stop currently running processes and even daemons with a variety of signals.
Archives can be created, extracted, and compressed with the gzip, bzip2, tar, and star commands.
The cron system allows users to schedule jobs so they run at given intervals.
The at system allows users to configure jobs to run once at a scheduled time.
The crontab command is used to work with cron files. Use crontab -e to edit, crontab -l to list, and crontab -r to delete cron files.
The /etc/cron.allow and /etc/cron.deny files are used to control access to the cron job scheduler; the /etc/at.allow and /etc/at.deny files are used to control access to the at job scheduler in a similar fashion.
Red Hat Enterprise Linux includes the rsyslog daemon, which monitors a system for kernel messages as well as other process activity, as configured in /etc/rsyslog.conf.
You can use log files generated in the /var/log directory to track activities on a system.
Other log files may be created and configured through service configuration files.
Log files may be rotated on a regular basis, as configured in the /etc/logrotate.conf file.
The systemd journal logs all boot, kernel, and service messages in a ring buffer inside the /run/log/journal directory.
The journalctl command is used to display and filter journal entries.

The following questions will help measure your understanding of the material presented in this chapter. As no multiple choice questions appear on the Red Hat exams, no multiple choice questions appear in this book. These questions exclusively test your understanding of the chapter. It is okay if you have another way of performing a task. Getting results, not memorizing trivia, is what counts on the Red Hat exams.
1. What command identifies all running processes in the current terminal console?

2. What is the highest priority number you can set for a process with the nice command?
3. What tar command option can be used to archive the files of an existing directory while saving its SELinux contexts?
4. You want to create an archive of the /etc directory. What command do you need to run to create a compressed bzip2 archive of that directory? Assume that archive is named /tmp/etc.tar.bz2
5. You want to schedule a maintenance job, maintenance.pl, to run from your home directory on the first of every month at 4:00 A.M. You’ve run the crontab -e command to open your personal crontab file. Assume you’ve added appropriate PATH and SHELL directives. What directive would you add to run the specified job at the specified time?
6. Suppose you see the following entry in the output to the crontab -l command:

When is the next time Linux will run the jobs in the /etc/cron.monthly directory?
7. If the users tim and stephanie are listed in both the /etc/cron.allow and the /etc/cron.deny files, and users donna and elizabeth are listed only in the /etc/cron.allow file, which of those users is allowed to run the crontab -e command?
8. What file is used to configure log file rotation?
9. What entry in the /etc/rsyslog.conf file would notify logged-in users whenever there is a critical problem with the kernel?
10. There are several files in the /var/log directory related to what happened during the installation process. What is the first word shared by the name of these log files?
11. What command displays all systemd journal entries with a priority equal to alert or higher?
12. How you can show the systemd journal entries related to the httpd daemon logged since the 16th of March 2015?
Several of these labs involve exercises that can seriously affect a system. You should do these exercises on test machines only. The second lab of Chapter 1 sets up KVM for this purpose.
Red Hat presents its exams electronically. For that reason, the labs for this chapter are available as part of the Media Center download, in the Chapter9/ subdirectory. They’re available in .doc, .html, and .txt formats. In case you haven’t yet set up RHEL 7 on a system, refer to the first lab of Chapter 2 for installation instructions. However, the answers for each lab follow the Self Test answers for the fill-in-the-blank questions.

1. This is a bit of a trick question because the ps command by itself identifies any currently running processes in the current console.
2. The highest priority number that can be used with the nice command is -20. Remember, priority numbers for processes are counterintuitive.
3. The tar command option that preserves SELinux contexts in an archive is --selinux.
4. The command that creates a compressed bzip2 archive of the /etc directory is

5. The directive that runs the maintenance.pl script from a home directory at the noted time is

6. Based on the noted entry in /etc/crontab, the next time Linux will run the jobs in the /etc/cron.monthly directory is on the first of the upcoming month, at 4:42 A.M.
7. When usernames exist in both the /etc/cron.allow and /etc/cron.deny files, users listed in /etc/cron.deny are ignored. Thus, all four users listed are allowed to run various crontab commands.
8. The configuration file associated with the rotation of log files over time is /etc/logrotate.conf. Additional service-specific configuration files can be created in the /etc/logrotate.d directory.
9. There’s a commented entry in the /etc/rsyslog.conf file that meets the requirements of the question. Just activate it and change the priority to crit to notify you (and everyone) whenever a serious problem with the kernel logs occurs:

Of course, that means there are other acceptable ways to meet the requirements of the question.
10. The log files in /var/log that are most relevant to the installation process start with anaconda.
11. The command that displays all systemd journal entries with a priority equal to alert or higher is journalctl -p alert.
12. To show all systemd journal entries related to the httpd daemon and logged since the 16th of March 2015, run the command journalctl _COMM=httpd --since 2015-03-16.
One way to modify the login messages as noted is with the following steps (there is at least one other method, related to the /etc/cron.d directory):
1. Log in as the root user.
2. Run the crontab -e command.
3. Add the appropriate environment variables, at least the following:

4. Add the following commands to the file to overwrite /etc/motd at the appropriate times:

5. Save the file. As long as the cron daemon is active (which it is by default), the next user who logs in to the console after one of the specified times should see the message upon a successful login. If you want to test the result immediately, the date command can help. For example, the command

sets a date of June 12, at 6:59 A.M., just before the cron daemon should execute the first command in the list. (Of course, you’ll want to substitute today’s date and wait one minute before logging in to this system from another console.)
To set up an at job to start 5 minutes from now, start with the at command. It’ll take you to an at> prompt.
Currently installed RPMs are shown in the output to the rpm -qa command. Since there is no PATH defined at the at> prompt, you should include the full path. So one way to create a list of currently installed RPMs in the /root/rpms.txt file in a one-time job starting five minutes from now is with the following commands:

Within five minutes, you should see an rpms.txt file in the home directory of the root user, /root. If five minutes is too long to wait (as it might be during the RHCSA exam), proceed to Lab 3 and come back to this problem afterward. Don’t forget to set up the other at job to be run in 24 hours.
One way to set up the cron job specified in the lab requirements is detailed here:
1. Log in as the root user.
2. The lab requirements don’t allow you to use the crontab -e command to edit the root crontab file. Hence, create a system crontab in the /etc/cron.d directory, using the following command:

3. Type the following line to set up the cron job:

4. Don’t forget to escape the % characters in the crontab entry; otherwise, they will be interpreted as newlines.
5. Type the EOF sequence:

6. To test the job, modify the crontab entry so that it runs a few minutes from now. Then, change the directory to /tmp and extract the generated archive using the following command:

7. Confirm that SELinux contexts have been preserved by running the following command:

There are no secret solutions in this lab; the intent is to get you to review the contents of key log files to understand what should be there.
When you review the anaconda.* files in /var/log and compare them to other files, you may gain some insight on how to diagnose installation problems. In future chapters, you’ll examine some of the log files associated with specific services; many are located in subdirectories such as /var/log/samba and /var/log/httpd.
The failed login should be readily apparent in the /var/log/secure file. You may be able to get hints in the output to the utmpdump btmp command.
When you review the /var/log/cron file, you’ll see when standard cron jobs were run. Most of the file should be filled (by default) by the standard hourly job, run-parts /etc/cron.hourly, from the /etc/cron.d/0hourly configuration file. If you’ve rebooted, you may see the anacron service, and you should be able to search for the job of the same name.
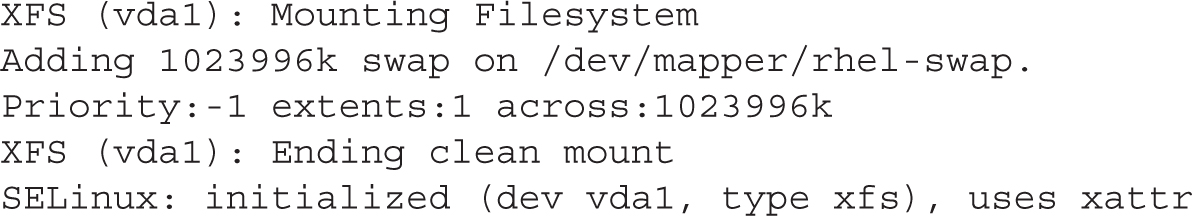
While /var/log/dmesg includes the currently booted kernel, it may be the same kernel as the one associated with /var/log/anaconda/syslog, if you haven’t upgraded kernels. At the end of /var/log/dmesg, you can find the filesystems mounted to the XFS format, as well as currently mounted swap partitions. For example, the following lists the partitions from a KVM-based virtual drive:
As you’ve hopefully discovered, the /var/log/maillog file does not include any information on mail clients, only servers.
Red Hat has included a GUI configuration tool in RHEL 7. The automatic configuration for hardware graphics is now sufficiently reliable, but in case you face any problems, you can look into /var/log/Xorg.0.log.