File Analysis
Windows systems contain a number of files of various formats. These files can also contain data consisting of various structures, some of which are well documented, while others have been discovered through analysis.
Keywords
File analysis; MFT; Jump List; DestList; Prefetch; Scheduled Tasks; Recycle Bin; hibernation; Apple; image; Skype; EXIF; metadata
Information in This Chapter

Introduction
As with any computer system, Windows systems contain a great number of files, many of which are not simply a standard, ASCII text format. Many of these files may not have any relevance to the analysis at all, and only a few may provide critical information to the analyst. There also may be a number of files that are unknown to the analyst, and due to their format, may not result in hits from keyword searches. These files can often provide an analyst with a great deal of insight into their examination, if they know that the files exist, if they understand the underlying data structures within the binary contents of the files and how to interpret and analyze them.
The purpose of this chapter is not to reiterate analysis techniques that have been discussed in detail in other resources. Instead, I’d like to discuss the existence of a number of files and artifacts, as well as analysis techniques that may be of value with respect to these files, that haven’t been widely discussed in other venues.
As I mentioned, Windows systems contain a number of files of various formats. These files can also contain data consisting of or embedded in various structures, some of which are well documented, while others have been discovered through analysis. Many analysts start their examinations by running keyword searches in order to identify likely sources of information, but there are a number of files that may provide critical information related to these keywords even though they don’t return any search hits.
Many times, the structure where the data exists within a file adds relevance or provides context to that data. For example, during a data breach investigation, I got several hits for potential credit card numbers within a Registry hive file (Registry analysis is discussed in detail in Chapter 5). Further analysis indicated that the credit card numbers were neither key names nor value data; instead, they were located in the unallocated space within the hive file. It turned out that the numbers detected in the search had been in sectors on the disk that had previously been part of another file, which had been deleted. As such, the sectors had been marked as available for use, and several of those sectors had been incorporated into the hive file as it grew in size (Registry hives “grow” 4 kilobytes at a time). What this demonstrates is that analysis must (and can) go beyond simply running a search, and it’s critical that it actually does, in order to answer some very important questions. For example, consider the finding I just discussed: Would “I found credit card numbers in the Registry” really provide any value to the customer? Or would it be more important to develop an understanding of where those credit card numbers were found and how they got there? Understanding the structures of various files, and the value that understanding can provide, will be the focus of this chapter.
MFT
Within the NTFS file system, the master file table (MFT) serves as the master list of files and contains metadata regarding every file object on the system, including files, directories, and metafiles. This metadata can be extremely valuable during an examination, particularly if you suspect that file metadata has been manipulated in an effort to hide or mask activities (commonly referred to as “anti-forensics”).
This chapter will not be a comprehensive treatise covering the complete structure of the MFT. Rather, we will focus on specific data structures (or “attributes”) that can be extracted from MFT entries and limit our discussion to a brief description of MFT entries and two specific attributes. Further, while we will be discussing various tools that you can use to parse the MFT, we won’t be doing so to the depth that you would expect to be able to write your own such tools from scratch. Perhaps the best source for additional, detailed information regarding the MFT, the structure of MFT entry attributes, and the forensic analysis of file systems in general is Brian Carrier’s book, File System Forensic Analysis[1].
Each file and directory (folder) on a Windows system has a record in the MFT. Each record is 1024 bytes in length. As NTFS views each file as a set of attributes, the file’s MFT record contains some number of attributes which hold metadata about the file or, in some cases, the file data (content) itself. The first 42 bytes of each record comprise the File Record Header, which provides information such as the link count (how many directories have entries for this file, which helps determine the number of hard links for the file); whether the record is for a file or directory; whether the file or directory is in use or deleted; and the allocated and used size of the file.
All file and directory records will have a $STANDARD_INFORMATION attribute ($SIA) which is 72 bytes in length (for Windows 2000 and later systems) and contains (among other things) a set of time stamps. These time stamps are 64-bit FILETIME objects, as defined by Microsoft, which represent the number of 100-nanosecond intervals since January 1, 1601. These time stamps are what we most often “see” when interacting with the system (via the command prompt when using the “dir” command, or via the Windows Explorer shell), and are written into the MFT record in Universal Coordinated Time (UTC) format on NTFS systems; this means that when we see these time stamps through Windows Explorer (or via the “dir” command at the command prompt), they are translated for display to the user in accordance with the time zone information stored in the Registry for that system.
Note
Displaying Time Stamps in Forensic Analysis Applications
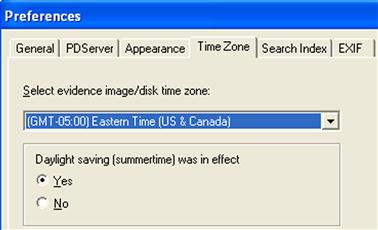
Most commercial forensic analysis applications have the ability to display file MAC time stamps in accordance with the time zone settings on the analyst’s system, although this functionality can be disabled. In ProDiscover Incident Response Edition, that setting can be found by clicking the File menu option, and choosing the Preferences option, which opens the Preferences dialog, as illustrated in Figure 4.1.
The time stamps that are stored within the $SIA attribute are the last modified time, the last accessed time, the MFT entry modified (changed) time, and the creation (“born”) time, and are referred to collectively as the “MACB” times, where each letter corresponds to each of the time stamps, respectively. Another way of referring to these times is “MACE times” (for file modified, file accessed, file created, and MFT entry modified); note that the last two times (MFT entry modified and file creation times) are transposed, with respect to the MACB format. For consistency, we will refer to these times as “MACB” times throughout the rest of this chapter. These time stamps are modified and updated during the course of normal operating system activity; for example, when a file is created, the time stamps are set to the current date and time. Whenever a change is made to the file itself (data is added, modified, or removed by the user or a service), the last modification time is updated. As we’ll see in the “Last Access Time” sidebar, modification to this time stamp is subject to a couple of conditions.
In addition, every file within the NTFS file system will have at least one $FILE_NAME ($FNA) attribute in its MFT record. This attribute contains 66 bytes of file metadata, plus the file name itself. An MFT record for a file can have more than one $FNA attribute, as the file system may require that for files with long file names, there is also a DOS 8.3 format name (this can be disabled via a Registry value). This simply means that if you have a file named “This is a long file named file.doc,” there will also be an $FNA attribute containing the name “this_i~1.doc,” which consists of eight characters, the dot separator, and the three-character extension. As such, this file would have a $SIA and two $FNA attributes. In addition to the file name, the metadata contained in the $FNA attribute includes a reference to the parent directory (which allows tools to completely reconstruct the full path to the file), as well as four time stamps, similar to and in the same format as those within the $SIA attribute. The primary difference with the $FNA time stamps is that Windows systems do not typically update these values in the same way as those in the $SIA attribute; rather, the $FNA times correspond to the original date for when the file was created, moved, or renamed. As such, accessing the MFT, parsing the various attributes for the specific files, and noting any anomalies between the $SIA and $FNA values is a technique that analysts use to determine the likelihood of the $SIA time stamps being purposely modified in an attempt to disguise the file.
MFT records will also contain several $DATA attributes. The $DATA attributes may contain the contents of the file itself, if the fie is resident. Some sources indicate that if the file is around 700 bytes in size or so, for systems with MFT records that are 1024 bytes in size, the file will be resident. In my own limited testing of such systems, I’ve found resident files up to 744 bytes in length. This can be very valuable, as these small files may be DOS batch files (often used to automate tasks by attackers), configuration files, or some other remnants left by an attacker or even a user. If an attacker deletes the file and you’re able to acquire a copy of the MFT before the record is reused, you can retrieve the contents of the file. Another aspect to consider is if the file itself grows to the point where it becomes nonresident; the MFT record may contain “attribute slack,” in that as the $DATA attribute becomes populated with the data runs that point to sectors on disk, the remaining available space that once contained the file contents may not be overwritten. As such, generating a hex dump of the record will clearly show some portion of the previously resident file contents. On systems where the MFT records are larger than 1024 bytes, such as 4096 bytes in size, there would be considerably more resident data available. On March 20, 2013, Kyle Oetken published an article on the Trace Evidence blog (found online at http://traceevidence.blogspot.com/2013/03/a-quick-look-at-mft-resident-data-on.html), in which he demonstrated the results of his own testing and clearly showed that the larger MFT records were able to hold considerable my resident data.
$DATA attributes can also refer to alternate data streams (ADSs). Working closely with MFT records, all of those things that analysts know about ADSs become abundantly clear, particularly how they don’t have their own time stamps.
The MFT record attributes that we’ve discussed up to this point are not the only ones available. There are several others, but it is beyond the scope of this book to describe in detail the other attributes. One final attribute that I will discuss very briefly is the “extended attribute,” or $EA. Much as the functionality that allows for ADSs was intended for compatibility with the Macintosh Hierarchal File System (HFS, which uses resource forks), the $EA attributes were intended for compatibility with the OS/2 High-Performance File System, and it really doesn’t have a great use unless you have OS/2 systems in your environment. Midway through 2012, a variant of the ZeroAccess malware was found to be crafted to store its payload (a DLL file) in the $EA attribute of an MFT record; Corey Harrell discussed this in an article on his blog, which can be found online at http://journeyintoir.blogspot.com/2012/12/extracting-zeroaccess-from-ntfs.html. As such, a technique that can be used to look for malware that uses this technique is to scan the MFT and report any records that contain an $EA record (the $EA attribute type is 224 in decimal format, 0xE0 in hex format). Corey includes a means for not only locating $EA attributes within MFT records in his blog article, but also a technique (using free tools) to extract the information stored within those attributes.
There are several free, open source tools available that can be easily retrieved from the Internet that will allow us to extract the $SIA and $FNA attributes from the MFT. One such tool is David Kovar’s Python script named “analyzeMFT.py” (information about this script is available online at http://www.integriography.com/, and the code is available on GitHub at https://github.com/dkovar/analyzeMFT/). David originally created analyzeMFT.py as a Python script, and then Matt Sabourin created an objected-oriented version of the script, allowing the functionality to be accessed by other scripts.
I’ve also written my own tools (i.e., Perl scripts) for parsing the time stamps (and other information) for files and directories listed in the MFT. This Perl script is included with the materials provided in association with this book and provides a good framework from which I’ve been able to write other Perl scripts, with additional functionality. As you’ll see later in this chapter, the script displays information from the MFT File Entry Header, as well as the $SIA and $FNA attributes in an easy-to-view format.
TZWorks provides a tool called ntfswalk (found online at https://www.tzworks.net/prototype_page.php?proto_id=12) that allows the analyst to access the MFT records for a given volume, filter those records, and display various statistics about the records. The use of this tool requires that the analyst mount an acquired image, which can be done quite easily using methods such as those described in Chapter 3.
When analyzing the information derived from the MFT, it is important to keep in mind that other user actions (besides simply reading from or writing to a file) can have an effect on the file time stamps within the $SIA entry, as well, and several are described in Microsoft KnowledgeBase (KB) article 299648 (found online at http://support.microsoft.com/?kbid=299648). For example, copying or moving a file between directories within an NTFS partition retains the last modification date on the file, but the copy operation will reset the creation date to the current date, whereas the move operation retains the original creation date of the file. Refer to the KB article for details, but keep in mind that when transferring files, whether or not time stamps are updated (and which time stamps are actually updated) depends on a number of factors, including whether the file is being copied or moved, and whether it is being transferred to a different location within the same drive partition, or from one partition to another.
Not only do the aforementioned actions affect the time stamps in the $SIA attribute, but these values (within the $SIA) can be manipulated arbitrarily, as well. Essentially, if a user has write access to a file, they can modify the time stamps of that file to arbitrary values, and those modifications are written to the time stamps in the $SIA attribute (technically, per http://msdn.microsoft.com/en-us/library/cc781134, these are also written to the directory entry). This is an anti-forensic technique that is often referred to as “time stomping,” named for a tool used to perform this function, which allowed the user of that tool to set the time stamps to arbitrary times (at the time of this writing, the graphical version of timestomp.exe is available online at http://sourceforge.net/projects/timestomp-gui/files/Windows/). Consider the effect on an investigation of finding illegal images on a system confiscated in 2011, only to find that the files had creation dates in 2014 and last access dates in 1984. Even one or two files with time stamps similar to this would be enough to cast doubt on other files. One of the drawbacks of using timestomp.exe, however, was that the application reportedly had a resolution of 32 bits for the times, leaving the upper 32 bits of the 64-bit FILETIME object all zeros. This makes the use of this technique relatively easy to detect.
Another technique for modifying time stamps on files is copying the time values from another file, particularly one that was part of the original Windows installation, such as kernel32.dll (found in the C:\Windows\system32 directory). This technique avoids the resolution issue faced by timestomp.exe, does a better job of hiding the file from analysis techniques (see Chapter 7), and is easily accessible via native application programming interface (API) functions.
Extracting the $SIA and $FNA time stamps for comparison and analysis is only one example of how understanding the MFT can be beneficial to an analyst. Understanding additional elements of the MFT, as well as the structure of each individual MFT record, can provide additional details with respect to the status of various files.
File system tunneling
Another aspect of Windows file systems that can affect the time stamps that you observe during your analysis (and isn’t often discussed) is file system tunneling. This process applies to both FAT and NTFS file systems and is described in Microsoft KB article 172190 (found online at http://support.microsoft.com/kb/172190). “File system tunneling” refers to the fact that within a specific time period (the default is 15 seconds) after a file is deleted, file table records (FAT or MFT) will be reused for files of the same name. In short, if you have a file named “myfile.txt” that is deleted or renamed, and a new file of the same name is created shortly after the deletion or rename operation, then the file table record is reused, and the original file’s creation date is retained. According to KB article 172190, this “tunneling” functionality is meant to maintain backward compatibility with older 16-bit Windows applications that perform “safe save” operations.
To demonstrate file system tunneling, I created a text file named “test3.txt” on my Windows XP SP3 system that is 31 bytes in size and waited few days. Using the Perl stat() function, the $SIA time stamps appear as follows, in UTC format:
I then deleted test3.txt and immediately (within 15 seconds) recreated the file using the echo command (i.e., echo “A tunnel test”>test3.txt) at the command prompt. The new version of test3.txt is 18 bytes in size, and the time stamps appear as follows (again, in UTC format):
As you can see, the creation date of the new file remains the same as the original test3.txt, even though the new file was “created” on June 3, 2011. Using FTK Imager, I then exported the MFT and parsed it with the mft.pl Perl script; the $SIA and $FNA information for the test3.txt file appears as follows:
As you can see from the above excerpt from the MFT, the “born” or creation dates in both the $SIA and $FNA attributes remain the same as the original file, but all other time stamps are updated to the current date and time, with respect to the file creation. Remember, all I did was create the file (from the command line)—I didn’t access (open) or modify the file in any way after creating it.
More than anything else, I’ve found the information discussed thus far to be very useful in establishing when files were really created on a compromised system. By comparing the creation dates from the $SIA and $FN attributes for suspicious files, I’ve often found clear indications of attempts to hide the existence of those files from detection and closer inspection. This will become a bit clearer when we discuss timeline analysis in Chapter 7.
TriForce
Early in 2013 (very early, in fact, on January 4), David Cowen described, via his blog, a means of analyzing several NTFS artifacts together that he refers to as the “TriForce”; he uses “tri,” as this technique involves the MFT, the $LogFile, and the USN Change Journal ($USNJrnl). The $LogFile is an NTFS metadata file that is used by Windows to restore metadata consistency after a system failure. From David’s blog post, the $LogFile “… contains the before and afters or undo/redo for each change to the MFT. It contains the full entry of what is being changed (File records, $STDINFO blocks, etc…) and the metadata contained within them (with the exception of resident files on windows 7 journals whose contents appear to be nulled out). The $logfile is great for getting a very granular level exactly what changes have occurred to a file system.” The update sequence number (USN) change journal maintains a persistent log of all changes made to files within a volume. David’s TriForce analysis technique takes advantage of the fact that the individual records within the three files examined all contain elements that can be used to relate the artifacts to one another. In fact, this very likely isn’t too different from what the NTFS file system does itself, when it needs to, and is simply being applied to digital forensic analysis. David’s blog post can be found online at http://hackingexposedcomputerforensicsblog.blogspot.com/2013/01/happy-new-year-new-post-ntfs-forensic.html. Be sure to also read the article that David posted three days later (January 7) that goes much deeper into describing the various artifacts used by TriForce, and how they can be correlated.
Event logs
Windows systems are capable of recording a number of different events in the Event Log, depending upon the audit configuration (we will discuss in Chapter 5 how to determine the audit configuration). The Event Log files on Windows 2000, XP, and 2003 systems are made up of event records that are stored in a well-documented binary format (which can be found online at http://msdn.microsoft.com/en-us/library/aa363646(v=VS.85).aspx). Part of this format includes a “magic number” that is unique to individual event records (including the header record, which contains information about the Event Log file itself), as illustrated in Figure 4.2.
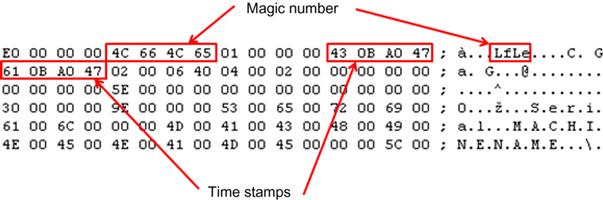
As illustrated in Figure 4.2, the “LfLe” “magic number” can be used to identify event records within the Event Log file. The 4 bytes immediately prior to the event record (0xE0 in Figure 4.2) tell us the size of the event record in bytes. This information is not only useful in parsing through the Event Log file on a binary level, extracting each record in turn (and writing tools to help us do this), but it can also be used to extract event records from relatively unstructured data, such as unallocated space (or the page file), which will be described later in this section.
Many analysts have discovered that when extracting Event Log files from an acquired image and opening them in the Event Viewer on their analysis system, they will often encounter a message stating that the Event Log is “corrupt.” This is usually not due to the Event Log files actually being corrupted, but instead is often due to the fact that some message dynamic linked library (DLL) files may not be available on the analysis system. As such, I’ve written several tools to assist me collecting information pertinent to my analysis from Event Log files. The first is the Perl script evtrpt.pl, which collects information about the event records, such as the frequency of events based on event sources and identifiers (IDs), an excerpt of which, from an Application Event Log, appears as follows:
This information is a quick way to determine the type and number of the various event records within the Event Log, based on event sources and IDs. This is a great way of providing an overview of the Event Log content, and whether or not I can expect to find any records of value to my analysis. Having this information available has let me see some things very quickly. For example, if I’m working a malware detection issue and see that there are several event records with the source “Symantec AntiVirus” (or for another antivirus (AV) product, such as “McLogEvent” for McAfee), I know that the system had the application installed at one point and that may help provide insight for my analysis. In particular, if I opt (as part of my malware detection process, something we will discuss in Chapter 6) to mount the image as a volume and scan it with an AV product, I know not to use the product that was installed on the system. Similarly, while I most often start my analysis of the Event Logs by looking at what is actually being audited via the audit policy, there have been times when, although logins are being audited, the system has been running for so long that no one has needed to log into it. As such, I have found Security Event Logs with no login events available in the visible event records.
Evtrpt.pl also provides the date range of all of the event records within the file, as follows:
The date range information can be very useful, as well. There have been times when I’ve been asked to provide information regarding which user was logged into the system on a certain date or within a specific timeframe. Evtrpt.pl provides me with a quick view into whether or not digging deeper into the Event Logs is of value, or perhaps I should decrease the priority of the logs as source of information and focus my analysis on more profitable targets.
Another tool that I like to use is for parsing Event Log records is the Perl script evtparse.pl. This Perl script reads through the Event Log files on a binary level, locating and parsing the records without using any of the native Windows API functions. This has a couple of benefits: one is that you don’t have to worry about the Event Log file being deemed “corrupted,” as will sometimes occur when using tools (such as the Windows Event Viewer) that rely on native Windows API functions. The other is that the Perl script is platform-independent; it can be used on Windows, Linux, and even MacOS X. The script is capable of parsing event records into either comma-separate value (CSV) format, suitable for opening Excel, or into a format suitable for timeline analysis (which will be discussed in greater detail in Chapter 7).
Parsing the values is only half the battle, though. There are a number of resources available that provide information and details regarding what the various event records, either individually or correlated together, can mean. One of my favorite resources is the EventID web site (http://www.eventid.net). The $24 annual registration fee is well worth the expense, as I can log into the site and run searches to not only get additional information about MS-specific events, but also see information with respect to issues that others (mostly system administrators) have observed or encountered, as well as links to pertinent Microsoft KB articles. All of this can be very revealing, even if it only provides me with additional leads or places to look. Application-specific event records are usually best researched at the vendor’s web site, as blogs and forum posts can provide a great deal of information about various events generated by these applications.
Another resource for finding information about Security Event Log entries is the Ultimate Windows Security Log Events site (found online at http://www.ultimatewindowssecurity.com/securitylog/encyclopedia/default.aspx). This site provides an easily searched list of Security Event Log entries, with some explanations to provide context. The site provides information regarding Security Event Log entries for Windows XP and 2003 systems, as well as corresponding entries for Vista and Windows 2008 systems.
The Event Logs themselves are not always the sole source of event records on a system. Event log records, like other data, may be found within the page file or within unallocated space. I was once asked to analyze a system from which very few event records were found in the Event Logs and the Security Event Log had an event ID 517 record, indicating that the Event Log had been cleared. As such, one of the steps in my analysis was to attempt to recover deleted event records. My first step was to use the Sleuthkit (found online at http://www.sleuthkit.org/) tool blkls.exe to extract all of the unallocated space from the acquired image into a separate file. I then loaded that file into BinText (available online at http://www.mcafee.com/us/downloads/free-tools/bintext.aspx) and saved the list of strings located within the file. I then wrote a Perl script to go through the list of strings and locate all those that contained the event record “magic number” (i.e., “LfLe”); when BinText reports the strings that it locates, it also provides the offset within the file where that string is located (strings.exe available from Microsoft will do the same thing if you add the “-o” switch to the command line—the utility can be downloaded from http://technet.microsoft.com/en-us/sysinternals/bb897439). For every string that BinText located that began with “LfLe,” the Perl script would go to the offset within the file containing the unallocated space, “back up” 4 bytes (a “DWORD”) and read the size value. As the event record structure begins and ends with this 4-byte size value, the script would then read the total number of bytes, and if the first and last DWORDs in the sequence were the same, the event record was assumed to be valid, extracted, and parsed. Using this technique, I was able to recover over 330 deleted event records. Another way to do this would be to simply have a slightly modified version of either the evtrpt.pl or evtparse.pl script parse through unallocated space 4 bytes at a time, looking for the event record magic number, and then processing each event found to be a valid record. However you go about doing this, it can be a very valuable technique, particularly if you’re trying to construct a timeline, as discussed in Chapter 7. The point of this is to illustrate how understanding the various data structures on Windows systems can lead to the recovery of additional data that may significantly affect your overall analysis.
Windows Event Log
With Vista, Microsoft modified a great deal about how events are recorded, as well as the types of events recorded, the location where the events are recorded, and the structure of those recorded events. This new mechanism is referred to as the “Windows Event Log,” rather than just “Event Log” as seen on Windows XP and 2003 systems. On Vista through Windows 7 systems, the Windows Event Logs are stored in the C:\Windows\system32\winevt\Logs folder (by default) and are stored in a binary extensible markup language (XML) format.
On a system with a default installation of Windows 7 and only MS Office 2007 installed, I found 134 different .evtx files in the winevt\Logs directory. There are two types of Windows Event Logs: Windows logs and Application and Services logs. Figure 4.3 illustrates these logs, visible via the Event Viewer.
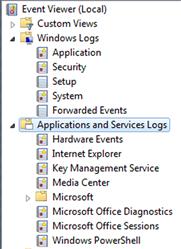
You can see a number of the Event Logs that you’d expect to see on a Windows system in Figure 4.3. For example, there are the Application, System, and Security event logs, which correspond to appevent.evt, sysevent.evt, and secevent.evt, respectively, on Windows XP/2003 systems. The Security Event Log records many of the same events as you may be used to seeing on Windows XP systems, including logons and logoffs (depending upon the audit configuration, of course); however, there is a difference—many of the event ID you would be interested in are different for the same event. For example, on Windows XP, an event ID of 528 would indicate a logon; for Windows 7, that same event would have an event ID of 4624. The difference between these two event IDs is 4096; this holds true for a number of Security events. The Ultimate Windows Security site has a fairly exhaustive listing of both Windows XP and Windows 7 Security Event Log records that you might expect to see, which can be found online at http://www.ultimatewindowssecurity.com/securitylog/encyclopedia/default.aspx.
You will also see the Setup and Forwarded Events logs in Figure 4.3. According to Microsoft, the Setup log contains events related to application setup; however, reviewing the various entries on live system reveals that the statuses of Windows Updates are also recorded in this log. The Forwarded Events log is intended to store events forwarded from other systems.
The remaining logs are Applications and Services Logs and store events for a single application or component, rather than events that would affect the entire system. These logs have four subtypes: Operational, Admin, Analytic, and Debug. By default, on a normal Windows 7 system, you’re likely to see Operational and Admin logs, although now and again you’ll see Analytic logs. Admin events are targeted at end users and system administrators, and provide information that an administrator may use to fix an issue or take some other action. Operational logs are generally used to diagnose an issue. For example, the Microsoft-Windows-WLAN-AutoConfig/Operational log provides information about wireless networks that the system has associated with, and through which network adapter, as illustrated in Figure 4.4.
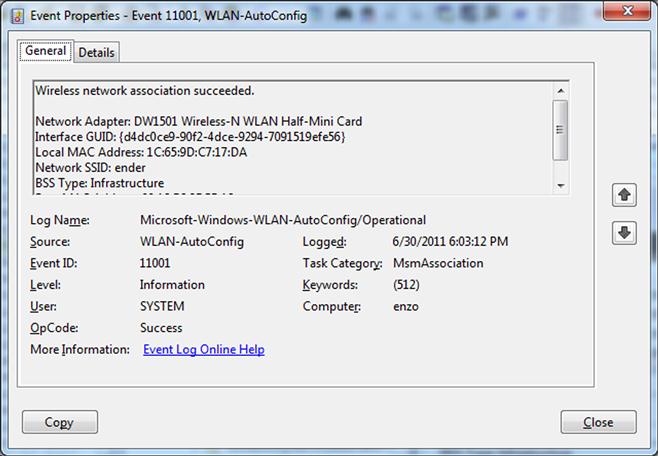
Events such as this can be instrumental not just in diagnosing problems, but can also provide clues to examiners during an investigation. For example, this information can help an analyst determine if a user is connecting to a WiFi access point in a nearby building in order to exfiltrate data, or determine where a user may have taken the laptop by submitting access point MAC addresses to a geo-location lookup service such as WiGLE.net.
The Debug and Analytic logs are intended for developers and used to diagnose problems that cannot be handled through user intervention.
All this aside, what are some of the ways to get at the data within the Windows Event Logs? One means for parsing Windows Event Logs that I’ve found to be very effective is to install Microsoft’s free Logparser tool (available online at http://www.microsoft.com/download/en/details.aspx?displaylang=en&id=24659) on a Windows 7 analysis system, and then either extract the Windows Event Log files from the acquired image, or mount the acquired image as a volume. From there, I then use the following command to extract all of the event records from, in this example, the System Event Log extracted from an image:
logparser -i:evt -o:csv “SELECT RecordNumber,TO_UTCTIME(TimeGenerated),EventID,SourceName,ComputerName,SID,Strings FROM D:\Case\System.evtx”>output.csv
This command accesses the extracted System Event Log file and parses the various individual items from each record found in the file. If you were to extract more than just the System Event Log from an acquired image, you may want to run the command against all of the files without having to enter each one individually. You can do this using the “*” wildcard, as illustrated in the following command:
logparser -i:evt -o:csv “SELECT RecordNumber,TO_UTCTIME(TimeGenerated),EventID,SourceName,ComputerName,SID,Strings FROM D:\Case\*.evtx”>output.csv
Using this command lets you open the output file using Excel, and sort that file on any of the columns (time stamp, Event ID, etc.), which depending upon the type of analysis you’re doing, may be very helpful.
When using this command, it’s important to remember that Logparser relies on the APIs (available via DLLs) on the analysis system. As such, you won’t be able to use it to parse Vista, Windows 7, and Windows 8 Event Logs if you’re running Windows XP on your analysis system, as the Event Log APIs on Windows XP aren’t compatible with the Vista/Windows 7 Windows Event Log format. Similarly, you can’t use Logparser to parse Windows XP or 2003 logs on a Vista/7 analysis system. Sending the output of the Logparser command to CSV format allows for easy viewing and analysis via Excel, in addition to providing additional columns for you to add references or your own notes. The format also allows for easy parsing, as we will see in Chapter 7.
Andreas Schuster, whose blog can be found at http://computer.forensikblog.de/en/, has put a good deal of effort into deciphering and decoding the Windows Event Log format, and creating a Perl-based library and tools collection for parsing the events from a log. As of this writing, the version of his library is 1.1.1 (last updated on November 28, 2011). You can download and install Andreas’ library, or you can use tools that have the library and tools already installed, such as the SANS Investigative Forensic Toolkit (SIFT) Workstation that Rob Lee developed. SIFT version 2.14 was available online at http://computer-forensics.sans.org/community/downloads when this chapter was being written.
Recycle bin
Windows systems have a great deal of event recovery built into them. Microsoft understands that users make mistakes or may delete a file that they later wish they hadn’t. As such, the Windows Recycle Bin acts as a repository for files deleted by the user through normal means, such as hitting the Delete key or right-clicking the file and selecting “Delete” from the context menu (files deleted from remote shares or from the command line are not sent to the Recycle Bin).
Tip
Bypassing the Recycle Bin
According to http://support.microsoft.com/kb/320031, the Recycle Bin can be bypassed by right-clicking on the Recycle Bin, choosing Properties, and checking the “Do not move files to the Recycle Bin” checkbox, as illustrated in Figure 4.5.
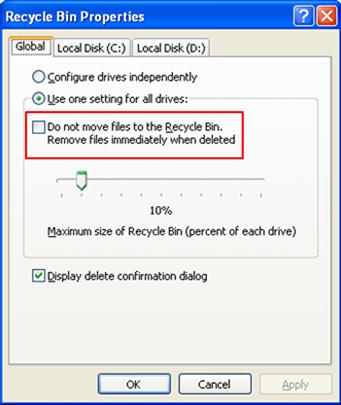
Checking this checkbox creates the NukeOnDelete value within the Registry (beneath the HKLM\SOFTWARE\Microsoft\Windows\CurrentVersion\Explorer\BitBucket key) if it doesn’t exist and sets it to 1. If the checkbox is unchecked, the value is set to 0 and the functionality is disabled. This functionality can be set globally (for all available volumes) or on a per-volume basis. Given this capability, if you have a case involving potentially deleted files and do not find anything of value in the Recycle Bin, you may want to check for the existence of the NukeOnDelete value.
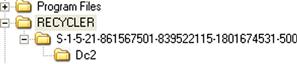
On Windows XP systems, deleted files are moved to the Recycler directory, within a subdirectory based on the security identifier (SID) for the user. Figure 4.6 illustrates the subdirectory for the Administrator user on a Windows XP system.
When a file is deleted on a Windows XP system and moved to the Recycle Bin, the file is renamed in accordance with a standard format, which is outlined in the “How the Recycle Bin Stores Files” Microsoft KB article (found online at http://support.microsoft.com/kb/136517). The name is changed so that the first letter is “D” (for “deleted”), the second letter is the drive letter from which the file originated, which is followed by the number of the deleted file, and the name ends with the original file extension. Figure 4.7 illustrates a deleted executable file that originated from the Z:\ drive.
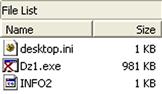
As illustrated in Figure 4.7, the Recycle Bin also maintains an index file (named “INFO2”) that keeps track of the original file name and location of deleted files, as well as when the files were deleted. The Perl script recbin.pl can be used to extract specific data from the INFO2 file, as illustrated here:
C:\tools>recbin.pl -f d:\cases\info2
1 Mon Sep 26 23:03:27 2005 C:\Documents and Settings\jdoe\Desktop\lads.zip
2 Mon Sep 26 23:05:28 2005 C:\Documents and Settings\jdoe\LADS_ReadMe.txt
3 Mon Sep 26 23:05:28 2005 C:\Documents and Settings\jdoe\lads.exe
4 Mon Sep 26 23:23:58 2005 C:\Documents and Settings\jdoe\My Documents\Morpheus Shared\Downloads\Toby Keith - Stays In Mexico.mp3
As you can see, recbin.pl parses through the INFO2 file and returns the index of the deleted file, the date and time the file was deleted, and the original file name of the deleted file.
Beginning with Vista, Microsoft changed the format of the files within the Recycle Bin. When files are deleted through the Windows Explorer shell, by default they will be moved to the Recycle Bin (“$Recycle.Bin” on disk), into a subfolder named for the user’s SID. The file itself will be given a new file name, which starts with “$R,” and is followed by six characters and ends in the original file’s extension. A corresponding index file will be created which starts with “$I,” and contains the same remaining characters and extension as the “$R” file. Several deleted files and their index files are illustrated in Figure 4.8.
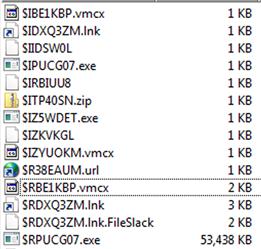
Figure 4.8 illustrates several deleted files and their corresponding index files. Figure 4.9 illustrates the binary contents of an index file.
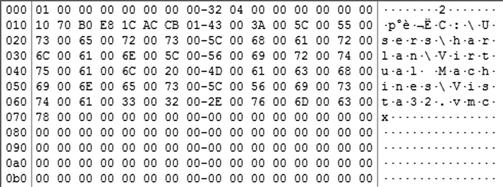
Each index file is 544 bytes in size. As you can see in Figure 4.9, the first 8 bytes of the file appear to be a header, and the second 8 bytes is the size of the original file, in little-endian hexadecimal format. Bytes 16 through 23 comprise the 64-bit FILETIME object for when the file was deleted, and the remaining bytes of the file are the name and path of the original file, in Unicode format. This structure makes the file relatively easy to parse and provide similar information as what is provided via the recbin.pl Perl script; once the index file (the one that begins with “$I”) is parsed, you can then recover the actual file contents from the corresponding file that begins with “$R.”
The recbin.pl tool described above can also be used to parse the index ($I) files found in the Recycle Bin on the newer versions of the Windows operating system:
C:\tools>recbin.pl -f d:\cases\$I2Y3QW9.tar
C:\Users\harlan\Desktop\Parse-Win32Registry-0.60.tar deleted on Sun May 6 13:49:01 2012 Z
It’s important to note the differences between the two files parsed using the recbin.pl tool. On XP systems, the INFO2 file contains records for all of the deleted files; on Vista systems and above, each $I index file contains only the record for the corresponding $R file.
Prefetch files
By now, most analysts recognize the forensic value of application prefetch, or just “Prefetch,” files. As with other artifacts, Prefetch files can provide some interesting indicators, even if a user or intruder takes steps to hide their activity.
Since Windows XP, Windows systems have been capable of prefetching. All Windows systems can perform boot prefetching, but only Windows XP, Vista, Windows 7, and Windows 8 perform application prefetching by default (Windows 2003, 2008, and 2008 R2 can perform application prefetching following a Registry modification).
Application prefetching is intended to enable a better user experience within Windows systems by monitoring an application as it’s launched, and then “prefetching” the necessary code to a single location so that the next time the application is launched, it launches faster. This way, the system doesn’t have to seek across the file system for DLLs and other data that it needs to start the application—it knows exactly where to find it. These Prefetch files are created in the C:\Windows\Prefetch directory and end with the “.pf” extension. Each Prefetch file name also includes the name of the application, a dash, followed by a one-way hash constructed using, among other things, the path to the application and any arguments used.
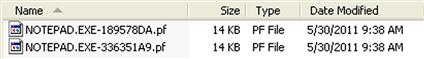
To see an example of the creation of application prefetch files, particularly if you’re running Windows XP, open a command prompt and change to the C:\Windows directory, and type “Notepad.” Close the Notepad window that appears and then return to the command prompt and change to the C:\Windows\system32 directory. Then type “Notepad” again and close the Notepad window that appears. Now, if you go to your Prefetch directory, you should see two different Prefetch files that start with “Notepad.exe” and include two different hashes, as illustrated in Figure 4.10. This is also why you will sometimes see multiple Prefetch files for rundll32.exe.
Prefetch files contain metadata that can be useful to an analyst during an examination. For example, they contain the date that the application was last launched, as well as a “run count,” or how many times that application has been launched. The Prefetch file also contains information about the volume from which the application was launched, as well as a list of DLLs and other files accessed by the application (in Unicode). There are a number of tools available that will allow you to parse this information from the files; due to the usefulness of this information, I wrote a Perl script called “pref.pl” to parse and display this information (this script is included in the ancillary materials available online). I found an odd Prefetch file on a system and ran the pref.pl Perl script against the file; an excerpt of the metadata information available in the Prefetch file is shown here:
C:\tools>pref.pl -f c:\windows\prefetch\0.8937919959151474.EXE-12EB1013.pf -p -i
c:\windows\prefetch\0.8937919959151474.EXE-12EB1013.pf Thu May 26 16:46:19 2011
EXE Name : 0.8937919959151474.EXE
Volume Path : \DEVICE\HARDDISKVOLUME1
Volume Creation Date: Fri Jan 1 22:24:09 2010 Z
Volume Serial Number: A424-CE42
\DEVICE\HARDDISKVOLUME1\WINDOWS\SYSTEM32\NTDLL.DLL
\DEVICE\HARDDISKVOLUME1\WINDOWS\SYSTEM32\KERNEL32.DLL
\DEVICE\HARDDISKVOLUME1\WINDOWS\SYSTEM32\UNICODE.NLS
\DEVICE\HARDDISKVOLUME1\WINDOWS\SYSTEM32\LOCALE.NLS
\DEVICE\HARDDISKVOLUME1\WINDOWS\SYSTEM32\SORTTBLS.NLS
\DEVICE\HARDDISKVOLUME1\DOCUME~1\User\LOCALS~1\TEMP\0.8937919959151474.EXE
As you can see in the above output excerpt, there is a considerable amount of metadata available. For example, we can see the last time that the application was launched and the run count (i.e., “Thu May 26 16:46:19 2011” and “(1),” respectively), as well as information about the volume where the application.exe file was found, and the actual path to the executable file (i.e., “\DEVICE\HARDDISKVOLUME1\DOCUME~1\User\LOCALS~1\TEMP\0.893791995915174.EXE”).
I’ve also found other interesting information in the output from pref.pl. In one instance, I found another very oddly named Prefetch file, named “KARTCICYYIR.EXE-2CC557AD.pf”; using pref.pl, an excerpt of the output I saw appeared as follows:
\DEVICE\HARDDISKVOLUME1\DOCUME~1\ABC\LOCALS~1\TEMP\KARCICYYIR.EXE
\DEVICE\HARDDISKVOLUME1\PROGRAM FILES\SOPHOS\SOPHOS ANTI-VIRUS\SOPHOS_DETOURED.DLL
\DEVICE\HARDDISKVOLUME1\WINDOWS\SYSTEM32\BDYAWUIS.DAT
\DEVICE\HARDDISKVOLUME1\WINDOWS\SYSTEM32\CONFIG\SOFTWARE
\DEVICE\HARDDISKVOLUME1\WINDOWS\SYSTEM32\MRYDUTAG.DAT
Again, as with the first example, this is only an excerpt of the output, but it shows the artifacts that were most interesting and immediately caught my attention. You can see in the above output excerpt not just the path the actual executable file, but also that it appeared to be accessing three .dat files, as well as the Software Registry hive. This is an excellent example of how Prefetch files can be valuable to an analyst, as it illustrates the concept of secondary artifacts that we discussed in Chapter 1. The Prefetch file parsed in the above example was a secondary artifact created during a malware infection; that is, it was created by the operating system as the malware executed and interacted with its “ecosystem” or environment. As it turns out, the Application Event Logs from the system from which the Prefetch file was retrieved included an event record that indicated that the malware file itself (“KARTCICYYIR.EXE”) had been detected by the installed AV application and deleted. However, the benefit of secondary artifacts is that they often are not deleted when an intruder “cleans up” after herself, or when malware is deleted; Registry keys and values, Prefetch files, etc. often remain. The metadata in this Prefetch file not only gives us a clear indication of when the executable was launched, but also from where (via the volume path and serial number in the previous example output). The metadata also gives us an indication of other files that may be associated with the malware, providing us with some context (we’ll discuss the concept of context with respect to digital forensic analysis at greater length in Chapter 7) as to the creation of those files.
As you can see, viewing the module paths, as well as the path to the executable file, embedded within these files can be very revealing during analysis. Executable files, generally speaking, are not normally run from paths that include “Temp,” such as “Local Settings\Temp,” or “Temporary Internet Files.” With the notable exception of the prefetch file for the Internet Explorer (IE) web browser, it may not be likely that most files would contain module paths that similarly include “Temp” in the path. Also excepting the prefetch file for IE, most prefetch files are not likely to contain module paths that point to files ending in “.dat” or “.bat.” Looking for indicators such as these are a great way to expedite analysis, as well as help locate indications of programs that had been run on the system, even well after the executable file itself has been removed from the system.
Near the end of September 2013, Jared Atkinson posted an article to his blog (found online at http://www.invoke-ir.com/2013/09/whats-new-in-prefetch-for-windows-8.html) that described something new in Prefetch files on Windows 8. In short, these files contain space for a total of eight time stamps for when the application was previously run. Jared also shared some of the testing he’d conducted to demonstrate that repeatedly running the application will cause the spaces for the time stamps within the .pf file to be populated. This additional, historical information can be extremely useful to an analyst.
The pref.pl Perl script provided with the materials associated with this book includes the ability to differentiate between Prefetch files from Windows XP, and those from Vista, as well as Windows 7 and 8.
Scheduled tasks
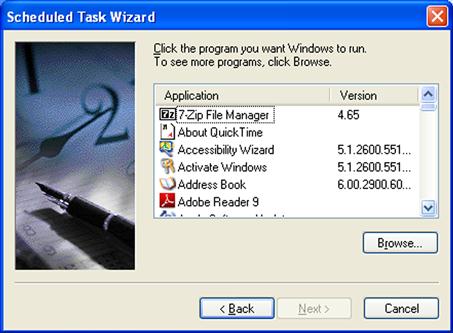
Windows systems are capable of a great deal of functionality, including being able to execute tasks on a user-determined schedule. These are referred to as Scheduled Tasks, and are accessible via several means, including the at.exe command and the Scheduled Task Wizard, as illustrated in Figure 4.11.
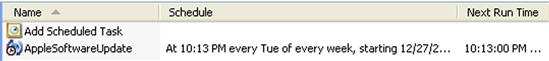
Scheduled Tasks allow various programs to be executed once, or on a regularly scheduled basis. This can be very useful; for example, regular housekeeping functions can be scheduled to occur at regular, specific intervals. One example of this is if you install iTunes or another Apple product, you will likely see the file “AppleSoftwareUpdate.job” in the C:\Windows\Tasks directory on your system, as illustrated in Figure 4.12.
That being said, the existence of a scheduled task does not always correlate directly to a user creating the task, as these tasks can be created programmatically, through the appropriate API calls (which, with the appropriate credentials, can be accessed remotely). As such, the existence of a scheduled task may be associated with a software installation, or in some cases, a malware infection or compromise. Windows systems require that, in order to create a scheduled task, the user context have Administrator level credentials. When the task executes, the running task itself has System level privileges. This can be very useful to administrators, particularly when System level privileges are needed temporarily; an administrator can create a scheduled task to launch the command prompt (i.e., cmd.exe) and have it run immediately. Once the command prompt appears, it will be running with System level privileges, allowing the administrator access to areas of the system restricted to that privilege level. Microsoft KB article 313565 (found online at http://support.microsoft.com/kb/313565) provides instructions for how to use at.exe to create scheduled tasks; while this article was written for Windows 2000, the commands work on later versions of Windows.
On Windows 2000, XP, and 2003, the scheduled tasks themselves are found within the C:\Windows\Tasks folder and have the “.job” file extension. These files have a binary format, a description of which is available online at http://msdn.microsoft.com/en-us/library/cc248285%28v=PROT.13%29.aspx. The information available via this site allows for tools to be written to parse the .job file format to extract information that may be of particular value. For example, the fixed length portion of the format contains an 8-byte SYSTEMTIME time stamp that indicates when the task was most recently run, and the variable length data section includes a Unicode string that indicates the name of the author of the task. This can be valuable to an analyst, as anything useful to an administrator can also be useful to an intruder; scheduled tasks have been used as a persistence mechanism (see Chapter 6) for malware, as well as means for activating Trojans, backdoors, or legitimate remote access services to allow an intruder access to the system.
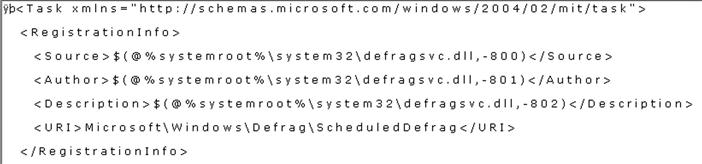
On Windows 7 and 8, “.job” files are stored in the “\Windows\System32\Tasks” folder, as well as subfolders beneath it, in XML format, which means that you can open them and read them in a text editor such as Notepad. An example of a portion of a Windows 7 .job file (opened in ProDiscover) is illustrated in Figure 4.13.
Windows 7 and 8 ship with a number of scheduled tasks already installed; for example, the RegIdleBackup task backs up the Registry (to the “\Windows\System32\config\RegBack” folder) every 10 days, and limited defragmentation is scheduled for once a week. These tasks can be viewed on a live Windows 7 system via the Task Scheduler Control Panel applet (available within Administrative Tools), as illustrated in Figure 4.14.
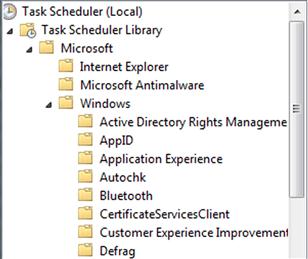
Again, on Windows 7 and 8, these tasks (described within XML “.job” files) are stored in subdirectories beneath the “\Windows\System32\Tasks” folder.
Another means for creating scheduled tasks, aside from at.exe or using a wizard, is to use schtasks.exe. This tool was introduced with Windows XP (Microsoft KB article 814596, found online at http://support.microsoft.com/kb/814596, describes how to use schtasks.exe to create scheduled tasks on Windows 2003), and is available on all systems up through Windows 7. While at.exe produces tasks or “jobs” that are named “AT#.job,” much like the wizard, schtasks.exe allows tasks to be created with more descriptive names.
Another useful bit of information available to the analyst is the Scheduled Tasks log file, named “SchedLgU.txt.” This file is 32 kilobytes (KB) in size, by default, and is located in the “\Windows\Tasks” directory on Windows 2003; it’s in the “\Windows” directory on Windows XP. Many times, this file will simply contain entries that state that the Task Scheduler service started (or exited) at a specific date and time; this can be useful to establish a record (albeit short term, as the file isn’t very large and older entries get overwritten) of when the system was running. This log may also hold a record of various tasks that have executed, along with their exit code. In some instances, I have found indications of tasks having completed that were associated with an intrusion, and corroborated with external data source (network traffic, etc.). In such cases, the task was created from a remote system using compromised domain administrator credentials, and once the task completed, it was deleted; however, the entry still remained in the SchedLgU.txt file, and we were able to correlate that information to other events. A complete discussion of timeline creation and analysis is covered in Chapter 7.
On Windows Vista systems and above, the Microsoft-Windows-TaskScheduler/Operational Event Log maintains records of Scheduled Tasks that have started, completed, etc.
Jump lists
Jump lists are Task Bar artifacts that are new as of Windows 7; they are not available on versions of Windows prior to Windows 7, but are available on Windows 7 and 8. In short, jump lists are lists of files that the user has recently opened, organized according the application used to open them, so in this way, they are similar to the RecentDocs Registry key (Registry analysis will be discussed in Chapter 5). Users can view their recently accessed documents and files by right-clicking on the program icon in the Task Bar. Figure 4.15 illustrates a jump list for VMWare’s VMPlayer application, viewed via the desktop.
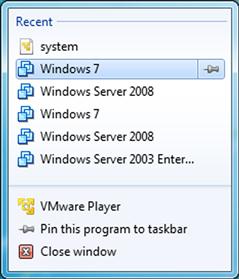
What the user sees depends upon the program; for example, the Jump List of Internet Explorer will show URLs, whereas the jump list for MS Word will show documents that the user has opened. Users can also choose to keep specific items persistent in the jump list by “pinning” them; that is, clicking on the push-pin to the right of the item, as illustrated in Figure 4.15. While the items under the Recent list may change over time, items that the user chooses to “pin” will persist in the jump list. These jump lists may also appear alongside programs listed in the Start menu, as well.
From an analyst’s perspective, the user’s Jump Lists are maintained in the AppData\Roaming\Microsoft\Windows\Recent\AutomaticDestinations folder within the user profile, as illustrated in Figure 4.16.
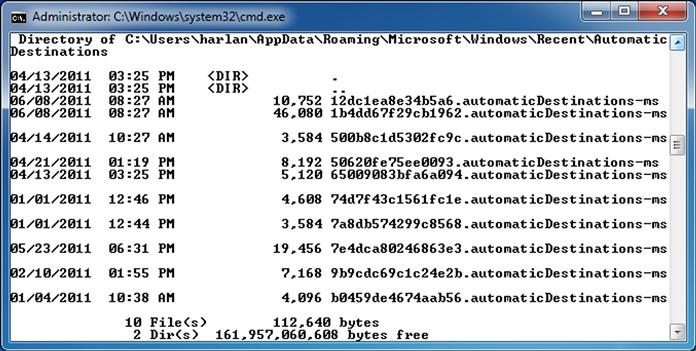
As you can see in Figure 4.16, the Jump List files are named with 16 hexadecimal characters, followed by “.automaticDestinations-ms.” The first 16 characters of the Jump List file name pertain to the specific application used and are fixed across systems. For example, “b3f13480c2785ae” corresponds to Paint.exe, “adecfb853d77462a” corresponds to MS Word 2007, and “918e0ecb43d17e23” corresponds to Notepad.exe. These characters comprise the “application identifier” or “AppID,” and identify the specific application, including the path to the executable file. Mark McKinnon of RedWolf Computer Forensics, LLC, posted a list of the AppIDs to the ForensicsWiki, at http://www.forensicswiki.org/wiki/List_of_Jump_List_IDs. The AppIDs for specific applications appear to persist between platforms, the same version of an application will have the same AppID, regardless of the system on which it’s been installed.
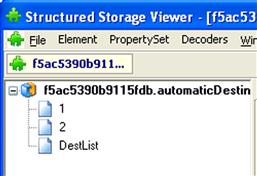
Several analysts within the community have noted that the Jump List files follow a specific file structure. In fact, at a Microsoft cybercrime conference in the fall of 2008, Troy Larson, the senior forensic investigator at Microsoft, stated that jump lists were based on the compound document “structured storage” binary file format (the format specification can be found online at http://msdn.microsoft.com/en-us/library/dd942138(v=prot.13).aspx) that was used in Microsoft Office prior to version 2007. This structured storage file format was also referred to as a “file system within a file,” in that the format was used to create a mini-file system within the contents of a single file, complete with “directories” and “files.” Given this, Rob Lee (of SANS) offered up one way to view the contents of a jump list using MiTeC Structured Storage Viewer (available online at http://mitec.cz/ssv.html), as illustrated in Figure 4.17.
Each of the numbered streams visible via the Structured Storage Viewer are, in turn, based on the file format associated with Windows shortcut files; shortcut files, when by themselves, usually end with the “.lnk” extension and have the nickname “LNK” files. Microsoft has made the binary format of these files, referred to as shell link files, available online at http://msdn.microsoft.com/en-us/library/dd871305(v=prot.13).aspx.
As these streams follow the binary format of shortcut files, they contain a considerable amount of information that can be valuable to an analyst. For example, the format contains last modified, last accessed, and creation time stamps (in UTC format) for the target file; that is, when a jump list stream is created, the MAC time stamps of the target file are used to populate these values within the jump list stream, in much the same manner that they are when a Windows shortcut is created. Analysts need to understand what these time stamps represent, and that the jump lists streams do not contain time stamps that indicate when the streams themselves were created, last accessed, or last modified. The format can also contain additional information, such as command line arguments used, if any, and possibly a description string. One example of a jump list stream that may contain command line options (and a description string) has been seen in the use of the Terminal Service client on Windows 7 to access remote systems, as illustrated here (extracted using a custom Perl script):
Other streams extracted from within the jump list file contain the same time stamps as seen above, as they represent the last modified, last accessed, and creation dates for the file C:\Windows\System32\mstsc.exe. Remember, starting with Vista, updating of last access times on files has been disabled, by default.
The streams identified within the jump list file can also be extracted and viewed with a shortcut/LNK file viewer. For example, using the Structured Storage Viewer, we can extract a stream, rename the extension to “.lnk,” and then point the MiTeC Windows File Analyzer (interestingly enough, named “WFA.exe”) at the directory where we saved the stream. The .lnk files within the directory will be parsed and the extracted information displayed, as illustrated in Figure 4.18.
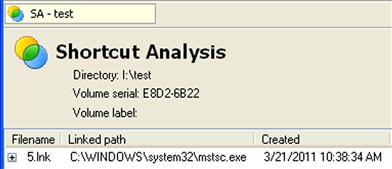
The information available from the LNK streams within the jump list file will depend upon the shortcut viewer application you choose. For example, the MiTeC Windows File Analyzer application does not have a column for a description string or command line options when parsing shortcut files.
So how would this information be valuable to an analyst? Well, for the jump list to be created and populated, the user has to take some action. In the previous example, the user accessed the Remote Desktop Connection selection via the Windows 7 Start menu. As such, the existence of this information within the jump list may provide clues (possibly when combined with other information) as to the user’s intent. The “user” may be a local user with legitimate access to the system, or an intruder accessing the system via some remote, shell-based access such as Terminal Services. In addition, jump list artifacts may persist well after the user performs the indicated actions or even after the target file has been deleted.
The Jump Lists that we’ve looked at thus far have been from the “AutomaticDestinations” folder. Users can create custom jump lists based on specific files and applications, which populate the “CustomDestinations” folder (in the AppData\Roaming\Microsoft\Windows\Recent\ folder within the user profile), with jump list files that end with the extension, “.customDestinations-ms.” As with the previously discussed jump lists, the files begin with a 16-character “AppID” name that is associated with a specific application; limited testing indicates a correlation between the two types of jump lists, with the same 16 characters associated with the same application between them. According to Troy Larson, these jump lists consist of one or more streams in the shortcut/LNK file format, without the benefit of each stream separated into individual streams, as is the case with the automatic destination jump lists.
There are a number of tools available to assist in parsing jump lists for inclusion in your overall analysis. Mark Woan has made not only a shortcut file analyzer (lnkanalyzer) freely available at http://www.woanware.co.uk/?page_id=121, but he has also made a jump list viewer application (JumpLister) available at http://www.woanware.co.uk/?page_id=266. Both tools require that .Net version 4.0 be installed on your system. The folks over at TZWorks.net have a Jump List parser application available named “jmp” (found online at https://tzworks.net/prototype_page.php?proto_id=20) that is capable of parsing both the automatic* and customDestinations-ms Jump Lists.
Using the Microsoft specifications for the compound document binary and shortcut file formats, I wrote my own Jump List parsing tool (in Perl, of course!). This code consists of two Perl modules, one for parsing just the Windows shortcut file format, and the other for parsing the AutomaticDestinations Jump List files as well as the DestList stream. This allows me a great deal of flexibility in how I can implement the parsing functionality, as well as how I choose to display the output. For example, using the two modules (literally, via the Perl “use” pragma), I wrote a script that would read a single AutomaticDestinations Jump List file, parse the DestList stream, parse the numbered streams, and then display the entries in MRU order, as illustrated here:
C:\Windows\System32\mstsc.exe /v:" 192.168.1.12"
C:\Windows\System32\mstsc.exe /v:"192.168.1.10"
This example output is from the Jump List file for the Remote Desktop Client and illustrates connections that I made from my Windows 7 system to various systems in my lab, several of them virtual systems. This information could very easily have been displayed in a format suitable for inclusion in a timeline (see Chapter 7).
ProDiscover (all but the free Basic Edition) also includes a built-in full featured Jump List Viewer, as illustrated in Figure 4.19.
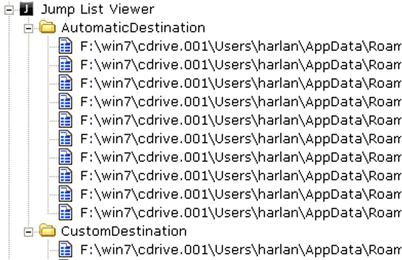
To populate the Jump List Viewer, open your ProDiscover project, right-click on the Users profile directory, and choose “Find Jump List Files…” from the drop-down menu. ProDiscover will scan through the subdirectories, looking for, cataloging, and parsing the various automatic and custom Jump List files (sans the DestList stream in the automatic Jump List files, as of ProDiscover version 7.0.0.3). As of this writing, ProDiscover version 8.2 is available.
The key aspect to remember about Jump Lists is that the customDestinations-ms Jump Lists are usually created by specific user activity; that is, the user pins an item to the Task Bar or to the application. I say “usually” because I have seen applications installed on a system that come with one or two pinned items (URLs to visit for assistance with the product, etc.) that are visible via the shell. AutomaticDestinations-ms Jump Lists are created automatically by Windows as the user interacts with the application via the Windows Explorer shell. In most cases, the user isn’t even aware that the Jump Lists are being populated, which can be very beneficial to an examiner. Within the automaticDestinations-ms Jump List files, the individual numbered streams contain Windows shortcut streams (again, the follow the binary format for LNK files specified by Microsoft) that point to each of the target files or resources, as well as a stream named “DestList” that acts as an MRU list.
Hibernation files
Laptop systems running Windows XP, Windows 7, or Windows 8 (I say this because it’s not often that you’ll see a server operating system such as Windows 2008 R2 installed on a laptop) may often be found to contain hibernation files. These files are basically the compressed contents of Windows memory from when the system (usually a laptop) “goes to sleep.” As such, a hibernation file can contain a great deal of very valuable historic information, including processes and network connections from some point in the past. This information can be used to address issues of malware that may have been installed on the system and then deleted, or demonstrate that a user was logged in or that an application had been running at some point in the past. As with some other artifacts, hibernation files are often not included in “cleanup” processes, such as application uninstalls, or when AV deletes detected malware.
The Volatility Framework, found online at http://code.google.com/p/volatility/, can provide you access to the contents of a Windows hibernation file and allow you to analyze it just as if it were a memory dump. In order to install the Volatility Framework on your system, consult the Volatility Framework wiki for the appropriate instructions (as of the time of this writing, Jamie Levy, a volunteer with the Volatility project, has graciously compiled detailed installation instructions for version 1.4 of the framework).
Detailed discussion of memory analysis is beyond the scope of this book, particularly when there are other, much better suited resources that cover the subject, such as the Malware Analyst’s Cookbook[2]. However, information found through analysis of the hibernation file can prove to be extremely valuable; analysts have found pertinent information, including keys for encrypted volumes, within hibernation files.
Application files
There are a number of application-specific files that may be found on Windows systems that may be crucial to an analyst. Application logging and configuration information may be critical to an analyst, but the value of those sources of information will depend in large part on the nature and goals of the examination. In the rest of this chapter, we will discuss some of the files that you may run across during an examination, based on some of the various applications that may be installed on the system being examined. In each case, we will also look to applications or tools that may be used to parse and further analyze these files. However, do not consider the rest of this chapter to be a comprehensive and complete list of those files; something like this is just impossible to produce. Application developers develop new tools and storage mechanisms for log and configuration data; for example, some browsers have moved away from text or binary files for bookmark and history/cache storage and have moved to SQLite databases.
With new applications being developed all the time and current applications changing, including adding new features, it would be impossible to keep up on all of that information, even if only from a digital forensic analysis perspective. My goal here is to have you consider alternate sources of data to corroborate your findings, or to fill in gaps. For example, application logs can be very useful, as in many cases, entries are only added when the system is running and a user is logged in and using the application. As such, this information can be correlated with Event Log entries or used in the absence of such information. While there is really no way to thoroughly address all applications or even provide an overview, my hope is to provide information about some of the types of files that you might consider including in your analysis.
An aspect of Windows systems that some analysts may not consider is the Windows Error Reporting (WER) service, which captures information about kernel-mode (operating system) and user-mode (application) crashes. Analysts have used information regarding crashes on a system in some cases to provide indications of an attempt to install malware. In other cases, crash reports have been used to get a list of processes running and modules installed at the time of the application hang or crash, illustrating that a particular bit of malware was (or was not) running at a particular time. The WER logs are written to subfolders beneath the C:\ProgramData\Microsoft\Windows\WER folder. Beneath the ReportArchive subfolders, you will most likely find files named “Report.wer”; these are flat text files that contain some basic information about an application that may have had an issue or crashed, as well as a description of the issue itself. Within the ReportQueue subfolders, you will find Report.wer files, as well as XML files that contain more information about devices and drivers that were loaded, etc. If you’re performing timeline analysis (discussed in detail in Chapter 7), for example, and you find that a WER report was written near the time of an incident, you’ll likely want to open the appropriate files in a viewer (Notepad++works just fine) and see what information they may contain.
Antivirus logs
Logs produced by AV applications will be discussed in greater detail in Chapter 6, but I wanted to present at least a cursory discussion of the topic in this chapter, for the sake of completeness. AV logs can be extremely valuable to a forensic analyst in a number of ways. During one particular intrusion incident, I examined the AV logs and found that on a specific date (shortly after the files were created), an AV scan had detected and deleted several files identified as malware. Several weeks later, files with the same names appeared on the system again; however, this time, the files were not detected as malware. This information was valuable, in that the logs provided me with names of files to look for, and also allowed me to more accurately determine the window of compromise, or how long the malware had actually been on the system. This information was critical to the customer, not only because it was required by the regulatory compliance organization, but also because it reduced their window of compromise, but did so with hard data (the creation dates for the second set of files was verified through MFT analysis).
Another use for the AV logs is to help the analyst narrow down what malware might be on the system. For example, Microsoft’s Malicious Software Removal Tool (MSRT) is installed by default on many systems and updated through the regular Windows Update process. MSRT is an application meant to protect the system from specific threats (again, discussed in greater detail in Chapter 6), rather than provide more general protection in the manner of AV products. As such, checking the mrt.log file (located in the Windows\debug directory) will let you know when the application was updated, and the results of any scans that had been run. An example log entry is illustrated here:
Microsoft Windows Malicious Software Removal Tool v3.20, June 2011
Started On Wed Jun 15 21:13:25 2011
Microsoft Windows Malicious Software Removal Tool Finished On Wed Jun 15 21:14:45 2011
As you can see, the mrt.log file includes the date of when MSRT was updated; this can be compared to the table in Microsoft KB article 891716 (found online at http://support.microsoft.com/kb/891716) to determine what the system should be protected against. Note that KB article 891716 also provides example log excerpts that illustrate malware being detected.
As I’ve analyzed more and more Windows 7 (and even Vista) systems, I’ve had an opportunity to dig into the Windows Defender logs. According to Microsoft, Defender is intended to be “your first line of defense against spyware and unwanted software.” As such, logs from this application can be useful in determining what the system should be protected against, as well as perhaps provide indications of issues and even possible infections that may have occurred on the system. The Windows Defender log file can be found in the C:\ProgramData\Microsoft\Windows Defender\Support folder and can be examined to verify information about when the application was updated.
Skype
Skype is a useful communications utility that has been around for some time, and in the spring of 2011, Microsoft purchased Skype (for a reported $8.5 billion). Skype is not only available on Windows, Linux, and MacOS X computers, but it can be downloaded and run from Apple products (iPhone, iTouch, iPad), as well as from some smart phones and tablets running the Android operating system. As such, it is a pretty pervasive utility for not only making video calls, but also for something as simple as instant messaging, for sharing information outside what may be considered more “normal” channels (as opposed to AOL Instant Messenger, or Internet relay chat).
I’ve had Skype available on a Windows XP system for some time, in part to test the application and see what tools were available for parsing any log files produced by the application. The current version (as of this writing) of Skype that I’m using is 5.3, and the communications logs are maintained in the main.db file located within my user profile, in the “\Application Data\Skype\username” subdirectory. Two tools available for parsing information from the database file are Skype Log View (available online at http://nirsoft.net/utils/skype_log_view.html) and Skype History Viewer (available online at http://skypehistory.sourceforge.net). Figure 4.20 illustrates a portion of the user interface for Skype Log View (run on my live system) with the contents of the main.db file displayed.
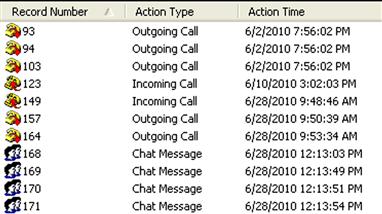
This information can be very useful to an analyst, illustrating not just communications between parties, but also who initiated the call, when the call was initiated, etc. This can also show when the system was in use and may support or refute a user’s claims regarding when they were accessing the system.
Apple products
Many of us may have products from Apple, including an iPod or iTouch, an iPhone, or even an iPad. Many of us may also use iTunes to sync and make backups of our devices. In April 2011, two researchers (Alasdair Allan and Pete Warden, article located online at http://radar.oreilly.com/2011/04/apple-location-tracking.html) found that as of the release of iOS 4, the iPhone and iPad would track approximate longitude and latitude information, along with time-stamp information. On the iPhone, this information is reportedly recorded in the file “consolidated.db.”
When a user syncs their Apple device to a Windows system via iTunes, the backup information is placed in the user’s profile, in the path, “Application Data\Apple Computer\MobileSync\Backup” (on Windows XP; on Windows 7, the path is “\Users\user\AppData\Roaming\Apple Computer\MobileSync\Backup”). When I sync my iTouch to my Windows XP system, I have a subdirectory in that path with a name that is a long string of characters, as illustrated in Figure 4.21.
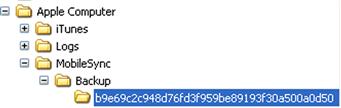
The backup information is maintained in that subdirectory in multiple files, also with long strings of characters for names. Within that directory, the Info.plist file is an XML file (you can open it in a text editor) that contains information about the device being backed up, and the Manifest.mbdb and Manifest.mdbx files contain file name translations, between the long strings of characters and the original file names.
The iPhoneBackupBrowser (authored by “reneD” and available on the web at http://code.google.com/p/iphonebackupbrowser/) is a freely available tool that allows you to access the backup information, reportedly beginning with iTunes 9.1.1, and parse the Manifest.mbdb file in order to map the backup file names to their original names. The wiki at the Google Code site includes information about the format of the Manifest.mbdb file, as well as the Manifest.mbdx index file (so you can write your own parser, if need be). The iPhoneBackupBrowser application itself reportedly runs better on Windows 7 than Windows XP, due to some of the APIs accessed. Once you download the tools and place them into a directory, you can run mbdbdump.exe (works just fine on Windows XP) against the Manifest.mbdb file by passing the path to the directory where the file is located to the tool, as follows:
The resulting output file contains the parsed contents of the Manifest.mbdb file, allowing you to search for specific files, such as the “consolidated.db” file. Once you determine which of the files with the long file names is the “consolidated.db” file, you can use free tools for accessing SQLite databases, such as the SQLite Browser (mentioned previously in this chapter) or the SQLite Manager add-on for Firefox (available at https://addons.mozilla.org/en-US/firefox/addon/sqlite-manager/) to peruse the contents of the database and extract the location information. The researchers stated in their article that the information recorded for each location may not be exact; however, from an overall perspective, it can show routes and that the phone or tablet was in a particular proximity at a specific time.
An analyst can use information within these backup files in order to develop more detailed information regarding specific devices attached to the system, as well as possibly gain further insight into the user’s movements, not just geographically but also around the web.
Image files
I own a work phone and a personal cell phone, both of which can be described as “smart” phones, and both of which contain cameras. I also own an iTouch, which contains a camera. I can connect all of these devices directly to my computer and copy pictures and videos directly to a folder. There are very few similar devices available these days that do not contain a camera of some type, and most of the ones available are capable of producing very high-quality digital images and videos. Not only that, many of the devices have global positioning system (GPS) capabilities; a friend of mine once took a picture with their Droid phone, swiped their hand across the screen, and pulled up a Google map with a push-pin on the location where the digital photo was taken. This simply illustrates that digital images can contain a significant amount of metadata; the question is then, how can you access that data?
One excellent tool for doing exactly that is Phil Harvey’s EXIFTool (found online at http://www.sno.phy.queensu.ca/~phil/exiftool/). The term “EXIF” stands for “exchangeable image file,” which is a standard that specifies the formats of various tags used by digital cameras (as well as smart phones and scanners), and Phil’s tool is capable of extracting embedded EXIF (metadata) information from within a number of image file formats. The tool can be used from the command line, an example of which follows:
D:\tools>exiftool -a -u -g1 D:\pictures\img_3791_2165.jpg
File Modification Date/Time : 2010:07:18 15:32:06-04:00
I added “…snip…” to the above output to indicate that I’d removed some information to make it easier to view; neither the tool nor the camera added that to the output. I am able to verify the relevant output because I have seen the camera, and know that it is, in fact, a Canon EOS Digital Rebel XTi camera.
Further along in the output of the tool, we see the following additional information:
Canon Image Type : Canon EOS DIGITAL REBEL XTi
Canon Firmware Version : Firmware 1.1.1
From this, we can see that we have two possible candidate serial numbers to uniquely identify the camera. So, if the user had copied the image from the camera and the camera was available to be analyzed, you could use this and other information (image file hashes, information from the computer system Registry indicating that the camera had been connected to the system, etc.) to definitively tie the image to the devices, and to the user.
What other information might be available within images? Well, many smart phones come with global positioning capability enabled, and GPS information may be embedded within the images. Phil’s tool is capable of extracting that information, as well as a great deal of additional information that may be embedded within a number of image file formats.
A final thought on metadata such as we’ve discussed in this section: while metadata can be very useful and even immensely valuable to an analyst, the simple fact is that not all files have metadata, and not all files that do have metadata necessarily have all metadata fields populated; if the metadata isn’t there, it isn’t there. For example, some images captured on via cell phone cameras may not have GPS coordinates as part of the image EXIF data. This may be due to the fact that the cell phone is not a “smart” phone and did not have a GPS receiver, or that the software used to capture the image did not embed the data, or there could be other reasons.
Summary
Windows systems contain a number of files in a variety of both open and proprietary formats. Depending on the type of case that you’re working or what you’re looking for, these files will be of varying importance. However, my intention in this chapter has been to make you aware of some of the various files (and formats) available, and how their contents have been used to further examinations. One particularly important aspect of this chapter has been to help you understand that in many cases, a file can be much more than just a binary stream of data. For example, if you understand the structure of the data, and how the various elements of the structure are used by an application, or even the operating system, you will then have some context associated with that data. I once worked with another analyst who had identified a particular string—a file name—within a Windows portable executable (PE) file (the structure of these files is discussed in Windows Forensic Analysis, Second Edition[3]). Before reporting this finding to the customer, further analysis needed to be completed; for example, did this file name refer to a DLL within the import table of the PE file, or was it the name of a file used as a data repository? The answer to this question, while relatively easy to determine, can have a significant impact on the overall examination.