Correlating Artifacts
So far throughout this book, each chapter has addressed some aspect of analysis of a Windows system, on a per-artifact basis. In most cases, artifacts are presented and discussed in isolation from other artifacts. Often it can be very instructive to provide examples of how various, apparently disparate artifacts can be correlated and used in combination to address a particular issue, and to complete a particular type of case.
Keywords
HowTo; case study; correlation
Information in This Chapter

Introduction
So far in this book, we’ve discussed a number of artifacts and data sources that analysts can look to within a Windows system in order to help address the goals of their analysis. However, all we’ve really done so far is point to various individual artifacts; what we haven’t really addressed to a great extent is how these artifacts can be correlated and combined during analysis, allowing the examiner to “paint a picture” and address the goals of their exam.
In order to help analysts, particularly those new to the industry, see how various artifacts can be correlated and used in combination, I thought that it might be useful to present analysis examples in the format of “How-Tos,” brief descriptions of various, apparently disparate artifacts that can be brought together like links in a chain. While working on writing this book, I started posting “HowTo” articles to my blog (found online at http://windowsir.blogspot.com), and these articles started to receive some attention from within the digital forensics and incident response community. For a while, I’ve been aware (through writing blog articles and books, as well as presenting and teaching courses) that folks just like to see and hear things like this, in order to get insight into how other examiners are going about analyzing various artifacts and types of cases. As such, I thought I’d extend some of them here in my book, and add a couple of others, in hopes of providing a view into how these types of examinations might be pursued, as well as generating discussion along these lines. I think it’s important that analysts share what they do (their processes), and engage in exchanging this sort of information with others, because that’s really the only way we’ll improve our ability to conduct analysis (be it digital forensics or incident response) in a timely and more thorough, comprehensive manner.
Think about it—if you’re always doing the same thing, the same sort of analysis, how do you get better? Let’s say that you work for a company in an internal position, and you perform investigations mandated by the human resources director, with respect to violations of acceptable use policies (AUPs). If you engage with other analysts and exchange findings with them, you may find new artifacts to look for or a new perspective on the type of analysis that you do. What happens if your company gets hit with an intrusion? If all you’ve done is AUP investigations, responding to an intrusion is going to be a new experience, but it can be easier if you’ve seen different perspectives from other analysts.
Again, I hope these “How-Tos” are useful, provide insight as to how different examinations might be conducted, and ultimately serve to generate discussion amongst analysts within the community.
How-Tos
With the “How-Tos,” my hope is to provide a starting point, not just for examiners to begin their analysis, but also for discussion, and the exchange of ideas regarding analysis processes. My thoughts are that the way that we all improve our abilities as analysts—to become capable of conducting more thorough and comprehensive analysis, in a timelier manner—is for analysts to engage, and to discuss this topic, and any issues that they may have.
Many times, when I’ve attended a conference, I think I will have an opportunity for my mind to be focused on something else other than the analysis that I’ve been working on; this is often far from the case. Rather, what tends to happen is that the analysis I’ve been working on—either a current exam, or one that was finished six or eight months prior—is still quietly simmering on the backburner of my mind. I will go to a conference and listen to a presentation, a question asked, or a snippet of conversation, and suddenly something will click. When this happens, I want to discuss it with other analysts, to see if they’re seeing the same thing, to see how they might use or take advantage of the information during an exam, etc. I honestly believe that it’s this type of engagement that allows everyone involved to become a better examiner. It’s not solely about hearing how other examiners go about their analysis; rather, we need to become engaged. When we hear a “war story” or a “case study” about how someone discovered something new, or how they analyzed a fairly prevalent malware infection, the best way to take advantage of that information is to process it in the context of what we do, and from our own perspective, and then start asking questions. What if you don’t have or use the same commercial application that the speaker was using? How would you go about retrieving or analyzing the same data? Is there a freeware alternative? It’s only through this sort of engagement amongst analysts that we can all become better and more thorough at our jobs.
Correlating Windows shortcuts to USB devices
Perhaps one of the least understood and most difficult aspects of analysis is correlating apparently disparate artifacts in order to “paint a picture” or “complete a story” for your examination. For example, identifying USB devices that had been connected to a system, and to which users they were available has been published and understood (for the most part) for some time, but this isn’t where analysis of these artifacts stops. When analyzing the device artifacts, we may need to know more about the usage of those devices, such as the drive letter to which the device was mapped. We may not be able to easily obtain this information simply from a cursory review of the MountedDevices key within the System Registry hive, as the drive letter may have been reused for multiple devices (it turns out that this is often the case; the drive letter “E:\,” for example, has been assigned to more than half a dozen different devices at different times on my own system). As such, in order to really understand the full breadth of USB device detection within an image acquired from a Windows system, it’s very important to understand the full breadth of artifacts, and how they can all be used together during an exam.
We know from analysis of USB devices on Windows 7 and 8 systems that there is a valuable key within the Software hive named EMDMgmt; the full path is Microsoft\Windows NT\CurrentVersion\EMDMgmt. According to information available from the Microsoft web site, this key is associated with ReadyBoost, a capability of more modern Microsoft systems (Vista and beyond) to examine USB devices for suitability for use as external random access memory. The subkeys beneath this key include information about various USB thumb drives, as well as drive enclosures, that had been connected to the system. Specifically, keys associated with USB thumb drives have names that start with _??_USBSTOR#, and drive enclosures have names that start with either an underscore or several letters. The names can be split into individual elements separated by underscores, and the last two elements of the name are the volume name, if available, and the volume serial number, in decimal format. For USB thumb drives, the subkey names contain the device ID, as well as the device serial number, just as we usually find beneath the Enum\USBStor, also within the System hive.
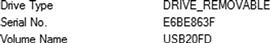
When a user accesses a volume or a file on a USB device, a Windows shortcut (LNK file) is created in either the AppData\Roaming\Microsoft\Windows\Recent or..\Office\Recent folder within the user’s profile folder, depending upon the type of file that was accessed. The format of these files includes, in most cases, the volume name (if one is available) and volume serial number of the volume where the file was located. By correlating the volume serial numbers from the EMDMgmt Registry subkeys to those found in the LNK files, we’re able to not only determine the drive letters assigned to the USB device volumes, but we’re also able to get insight into the directory structure within that volume. As noted in Chapter 4, Windows 7 and 8 systems also include *.automaticDestinations-ms Jump Lists (within the AppData\Roaming\Microsoft\Windows\Recent\AutomaticDestinations folder in the user profile), which are compound documents that incorporate streams that follow the LNK file format, and therefore also contain volume name (if available), volume serial number, and drive type (in this case, we’re interested in removable drives) information, as well. An example of this information extracted from a Jump List LNK stream is illustrated in Figure 8.1.
Correlating the volume serial numbers from the EMDMgmt subkeys to those found within the user’s LNK files or Jump List streams can serve a number of purposes for the analyst. For one, this can provide information regarding the drive letter assigned to the device, which may not be available through analysis of the “current” System hive (via the MountedDevices key values), nor those hives within available volume shadow copies (VSCs). Second, this information allows the analyst to determine the use of a specific device, particularly if that device was collected and was not reformatted by the user. Finally, this allows the analyst to determine specific folder structures found within the volume, which can then be correlated with other artifacts, such as shellbags or UserAssist entries, to develop a more detailed understanding of what existed within the volume.
Demonstrate user access to files
There are a great number of artifacts that allow an analyst to see the names, and in some cases the paths, of files that a user accessed. This information can be extremely useful in a variety of situations, ranging from a quick triage (did a user access a file in particular) to a full investigation in which the use of anti-forensics techniques (deletion of content, use of encrypted volumes, etc.) may be suspected. I am not a sworn, badged police officer, but I have assisted officers in cases involving illicit images by reviewing various data sources and providing the names (and paths) of files the user accessed, and in some cases, when the files were accessed. In such cases, I leave the actual file content up to those better suited to address and assess that—I simply provide file name and path information using the various data sources to which I can get access.
Beyond that, however, demonstrating user access to files can be addressed through examining a number of artifacts, and this can be useful to an analyst in a number of ways. First, most analysts are familiar with the fact that beginning with Vista, updating of the last accessed times on files, through normal user access to the files, was disabled by default. Given this, it can be valuable to determine other means by which to determine when a user accessed a file. Second, there are tools available for “cleaning up” information about files that a user accessed; these may be referred to as “anti-forensics” tools. Having additional artifacts to examine that may not be addressed by these tools can be very valuable to an analyst. Finally, many of the artifacts that are available persist well beyond when the files themselves are no longer available (deleted, external drive is reformatted, network drive no longer available, etc.).
When a user accesses a file, such as a document, image, video, and just about anything other than launching an executable file, a great deal actually goes on “under the hood.” For example, if a user double-clicks a file to open it, most analysts are familiar with the fact that a Windows shortcut/LNK file is created. On Windows 7 and 8 systems, an *.automaticDestinations-ms Jump List is created; the application ID portion of the Jump List name identifies the application that launched to open the file, and when the file was accessed can be found in the DestList stream embedded in the compound document format of the Jump List file.
There are a number of Registry locations where information is maintained about files that the user accessed, and many of these are “most recently used” (MRU) lists, which means that under normal conditions, with no fiddling or modification by the user, the LastWrite time of the Registry key refers to when the file listed first in the MRU list was accessed. This also means that when other files were accessed may be determined by viewing the key contents found in VSCs.
Applications can maintain their own MRU listings, and are most often associated with a specific user. For example, MS Paint maintains an MRU list of files within the user’s NTUSER.DAT Registry hive, beneath the Applets key (use the RegRipper applets.pl plugin to extract and view this information). Adobe Reader maintains its own MRU listing, as does the MS Office suite of applications. I have MS Office 2010 installed on my authoring system, and the path to the MS Office applications key within my NTUSER.DAT hive is Software\Microsoft\Office\14.0. Beneath this key, each of the individual Office applications that I have installed (Excel, PowerPoint, Word, etc.) has a File MRU key, and the values are listed by item number (i.e., Item 1, Item 2). The string data for each of the values appears as follows:
The portion of the string data that starts with “T” is the text representation of a 64-bit FILETIME time stamp, and can be retrieved and parsed by the RegRipper officedocs2010.pl plugin (originally written by Cameron Howell). More testing is required, but at the moment, the time stamp appears to indicate when each document was last closed. However, regardless of the exact action represented by the time stamp, the contents of these keys clearly indicate that a user accessed a file with an explicit path at some particular point in time, and can provide significant context to our examination.
When a user accesses an MS Office document from a network resource (Internet, or file share in a corporate environment) using one of the Office 2007 and 2010 applications, there’s yellow “Protected View” bar (illustrated in Figure 8.2) that appears, telling the user that the file may be unsafe.

As illustrated in Figure 8.2, the user must explicitly click the “Enable Editing” button in order to be able modify the document. When the user clicks this button, a value is created beneath the following key within the user’s NTUSER.DAT hive:
In this key path, “n” is the version of MS Office (“12.0” for MS Office 2007, “14.0” for MS Office 2010), and “app” is the application used to open the file (Word, Excel, Access, etc.). The values created beneath this key are named with the path to the file opened, and the first 8 bytes of the binary data are the FILETIME time stamps which indicate when the user clicked the “Enable Editing” button. The RegRipper trustrecords.pl plugin can be used to extract this information (if available) from a user’s NTUSER.DAT hive.
In March 2013, Jason Hale published a blog post (found online at http://dfstream.blogspot.com/2013/03/windows-8-tracking-opened-photos.html) in which he discussed a new Registry artifact that he’d found related to a user’s access to images via the Windows 8 Photos tile. On Windows 8, tiles on the desktop represent applications, and users viewing images via the Photos tile result in a great deal of information being added to their USRCLASS.DAT hive. This information includes not only the path to the file, but also a value whose data is a stream that follows the Windows shortcut/LNK file format. The full path to the Registry key in question is quite long, and can be found in Jason’s blog post, as well as in the RegRipper photos.pl plugin.
Another means that an analyst can use to demonstrate user access to files is by parsing the user’s Internet Explorer (IE) browser history (index.dat file), looking specifically for entries that begin with “file:///.”
The list of artifacts that demonstrate user access to files can be expected to grow, as new applications and versions of Windows become available. The list in this section is not intended to be all inclusive, but is instead intended to provide insight into some artifacts with which analysts may not be familiar.
IE browser analysis
There’s been a great deal of information published, largely via the Internet, regarding artifacts pertaining to the use of web browsers, in particular Internet Explorer (MSIE), Mozilla Firefox, and Google’s Chrome browser. There’s also been considerable research conducted and everything from white papers to theses for graduate degrees to blog posts published regarding the use of these browsers in what’s often referred to as “private” mode, which is essentially a mode of using the web browser that is meant to minimize the artifacts left on the system. It is also widely known within the digital forensics community that perhaps one of the best tools available for collecting artifacts pertaining to the use of web browsers, in general, and social media, in particular, is Magnet Software’s Internet Evidence Finder (IEF) tool, in version 6.1 at the time of this writing. I should note that IEF garnered the award from computer forensic software product of the year at the 2013 SANS Forensic Summit, based on a Forensic 4Cast poll.
What I’d like to do in this “HowTo” section is take a look at some of the artifacts related to Microsoft IE with which analysts should become familiar, in hopes that by providing this information, it might also provide a greater understanding of, and provide additional context for, a user’s activities. This section is not intended to be a comprehensive treatment of web browser forensics, as numerous other resources have been dedicated to the subject, and an entire book could be devoted just to it; rather, what I’d like to do is present some artifacts that may be of interest to the analyst, and means for accessing those artifacts. My goal is not to completely address the topic of web browser forensic analysis, but to instead present some artifacts specific to IE with which the analyst may not be familiar.
For versions of IE up to and including version 9, the “database” of web sites that a user visited is maintained in a file named “index.dat.” Now, IE actually has several files of the same name that it uses to maintain information (i.e., cookies, daily and weekly histories) but the one we’re interested in is the index.dat file located in the path “C:\Documents and Settings\user\Local Settings\Temporary Internet Files\Content.IE5” on Windows XP, and “C: \Users\user\AppData\Local\Microsoft\Windows\Temporary Internet Files\Content.IE5” on Windows 7. This is the file that maintains the current history of web sites that the user has accessed. Joachim Metz has put a good deal of work into documenting the structure of this file, which he maintains at the ForensicsWiki web site (found online at http://www.forensicswiki.org/wiki/Internet_Explorer_History_File_Format). This resource documents not only the format of the file header, but also the format of the individual records (i.e., URL, REDR, HASH, LEAK) that are maintained within the file. I have found this information to be extremely valuable for two reasons: the first being that it allows me to see exactly what information is maintained in the records, most particularly the URL records. For example, from the ForensicsWiki page, we can see that the URL record header not only includes a last accessed time (i.e., the last time the user accessed the particular site), but it also contains a last modification time of the file (when it was modified on the web server), as well as a time stamp that, according to Mr. Metz, indicates when the page expires. Further, by having a detailed view of the contents of the index.dat headers and individual records, we can write parsers to print out valid records based on the directory table within the file, as well as all records, valid and deleted, by parsing the file on a binary basis.
The second reason I find the format specification information to be useful is due to the fact that it allows me to see what the various fields are for the index.dat file header, and to what those fields refer. This has made it relatively straightforward to write a parser that looks solely at the identified fields, and can present information to the analyst quickly, without parsing the entire file. I have found this to be extremely useful as a malware detection technique; I can mount an acquired image (from an XP or Windows 7 system), and point a script at the folder where user profiles are located (“C:\Documents and Settings” or “C:\Users,” respectively). The script will then access each subfolder and attempt to locate the index.dat file; if it finds it, it parses the header in order to determine if the index.dat file is the default, unpopulated file, or if the file illustrates indications of web activity via the WinInet API. This check usually only takes a second or two, and provides me with indications of which user may have used the IE browser, or, if the Network Service or Local Service accounts provide indications of activity, if the system has potentially been infected with some sort of malware.
When analyzing user web browser activity, specifically as it relates to IE, there are several Registry keys that may provide a good bit of useful information. For example, within the user’s NTUSER.DAT hive file, the Software\Microsoft\Internet Explorer\ key contains a subkey named TypedURLs, which contains an MRU listing of addresses that the user has typed into the IE address bar. Windows 8 introduced an additional key of interest, named TypedURLsTime, which maintains an MRU list of the times (in 64-bit FILETIME format) that the URL was typed into the IE address bar, and the values beneath this key can provide two valuable bits of information. First, in the absence of any modifications to the Registry, the values beneath the TypedURLsTime key should follow a one-to-one correlation to the URLs beneath the TypedURLs key, providing time-based information for when the user performed the corresponding action. Second, if the times do not correlate to the URLs (i.e., there are a different number of entries beneath both keys), or if they do not correlate to other available artifacts (records within the user’s index.dat file, etc.), then this may be an indication of the use of anti-forensics techniques. Both findings can be extremely useful to the analyst.
One of the aspects of IE browser analysis that analysts need to keep in mind is that web browsing history is not kept forever; it simply would not be feasible to do so. While users can manually clear their browsing history, most browsers (IE included) will clear their own history at a set interval. For IE, the default interval is 20 days; I have seen systems in a corporate domain all set to 14 days, and when I used IE more regularly, I set my system to keep web history for 0 days. IE also includes a setting that will tell the browser to clear the history when the application exits. In the case of IE, this value is named “ClearBrowserHistoryOnExit,” and is found in the Software\Microsoft\Internet Explorer\Privacy key in the user’s NTUSER.DAT Registry hive file. Individually, these settings may not make much difference, but when attempting to determine the user’s web browsing activity, they can significantly impact the analyst’s findings. For example, if the user has entries beneath the TypedURLs key, including one or more that are of interest to the analyst, but the IE index.dat history file is empty, the analyst needs to take the necessary steps to determine if the user intentionally deleted the history, or if the history was deleted due to IE application settings. Fortunately, with Windows 7, there was a new addition to the Registry regarding the user’s use of IE. Beneath the Software\Microsoft\Internet Explorer\Main\WindowsSearch key, there may be a value named “Cleared_TIMESTAMP,” which is a 64-bit FILETIME object that refers to when the user last cleared their IE history.
The RegRipper ie_settings.pl plugin will determine if these values are present within the user’s NTUSER.DAT hive, and if so, parse and display them.
On most Windows systems, a user can manually organize the applications and groups that appear in their Start Menu, as well as their IE Favorites (analogous to bookmarks in other browsers). For example, a user may opt to have some applications listed first in their Start Menu, or they may choose to create specific subfolders for grouping and ordering their IE Favorites. If the user opts to do either of these, the ordering is maintained in the Registry in the corresponding key beneath the MenuOrder key. This key is found in the user’s NTUSER.DAT hive file, and the path to that key is Software\Microsoft\Windows\CurrentVersion\Explorer\MenuOrder. The RegRipper menuorder.pl plugin will extract, parse, and display this information, if it is available.
Web browsers have long had the capability for users to bookmark web sites of interest; with IE, these are referred to as Favorites, and are text-based.url files located by default in the user’s Favorites (i.e., C:\Users\username\Favorites) folder. The contents of an example IE Favorites.url file is illustrated in Figure 8.3.
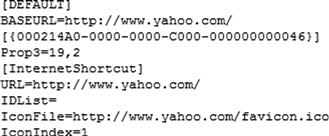
Per MS KnowledgeBase (KB) article 191656 (found online at http://support.microsoft.com/kb/191656), the globally unique identifier (GUID) listed in the .url file illustrated in Figure 8.3 is the class identifier for the “My Computer” system folder. As the IE Favorites are each maintained in a separate file (as opposed to all bookmarks in an XML format in a single file), the time and date of when a user created or modified the bookmark will appear in a timeline as a result of adding file system metadata to the timeline. On Vista and above systems, the last accessed times on files are not updated by default, so we’re not likely to see when the user accessed a location stored in a Favorites.url file within a timeline.
Finally, most browsers have a means for saving the current session so that it can easily be restored if, for some reason, the browser crashes. I’m sure most users have experienced this capability; they may have several tabs open in the browser, and then they visit a site that may cause their browser to crash. When they reopen the browser, each of the tabs themselves are opened, and the browser attempts to load the pages that were visible in each tab when the browser crashed. For IE versions 8 and 9, the file in question is named “RecoveryStore.{GUID}.dat,” and on Windows 7 is located in the user’s AppData\Local\Microsoft\Internet Explorer\Recovery\Last Active folder (the final elements of the path are High\Last Active if the user account has elevate Administrator privileges). There may also be other files present in the folder, with names similar to “{GUID}.dat.” Even though the file extensions are “.dat,” the files actually follow the compound file or structured storage format, similar to Jump Lists and older versions of MS Office file formats. As such, the structure, embedded streams and their contents can be viewed using the appropriate tool (see Chapter 4). There isn’t a great deal of information available regarding the format of the various streams found within the files, but Yogesh Khatri has conducted some research and posted his findings on his blog, found online at http://www.swiftforensics.com/2011/09/internet-explorer-recoverystore-aka.html.
More information about web browser session restore forensics can be found in Harry Parsonage’s paper of the same name (found online at http://computerforensics.parsonage.co.uk/downloads/WebBrowserSessionRestoreForensics.pdf), which provides some valuable information on the topic, including session restore forensics for web browsers other than IE.
Detecting system time change
Modifying the system time is one of those activities usually identified as an “anti-forensic” technique, as many analysts may feel that the only reason for doing something like this is to hide activity on the system. I have seen, however, less nefarious uses for this sort of activity, such as to run (or continue running) sample versions of programs that are designed to stop functioning after a certain date.
In many cases, detecting the change of the system time can be relatively straightforward. Most often, a user will modify the system time by accessing the Date and Time applet in the Control Panel, and accessing this applet seen within the UserAssist subkey data in the user’s Registry hive file (via the output of the RegRipper userassist.pl plugin). However, this data does not tell us definitively that the user changed the system time, only that the user accessed the Date and Time Control Panel applet—but that may be just the first bit of information that we need.
Steve Bunting, an independent forensic consultant, pointed out at his web site (found online at http://www.stevebunting.org/udpd4n6/forensics/timechange.htm) that with the proper auditing enabled on Windows XP and 2003 systems, the Event Logs may contain events with ID 520 (system time change) and/or 577 (privilege use). On more recent versions of Windows (i.e., Vista and above) the event ID 520 appears as event ID 4616.
Another means for detecting significant system time changes that I have found to be fairly fruitful is to parse the Event Log records, but not for their full data; instead, event records contain a sequence number and a time stamp which signifies when the event was generated. Listing all of the events in order, sorted by sequence number, with their corresponding time stamps makes it relatively easy to detect significant time changes. For Windows XP and 2003 systems, the evtparse.pl script discussed in Chapter 4 allows me to conduct this analysis easily, by supplying the “-s” switch. For Vista and above systems, a bit more work is required (evtparse.pl was not designed to be used with Windows Event Logs from these systems), but using LogParser.exe (available from Microsoft for free) and Excel, it is relatively easy to employ this analysis technique.
Who ran defrag?
I’ve seen this question asked a number of times in public forums, and I’ve been asked the same question by customers, as well. This question usually comes up in spoliation cases, particularly after there’s been a legal hold of some kind (many times based on current or anticipated litigation), and individuals have been instructed to not delete any documents or data from their systems.
The fact of the matter is that modern computer systems, particularly Windows systems, are very active even when there is no user sitting at the keyboard. With Windows XP, a System Restore Point was created under a variety of conditions, one of them being that 24 hours had passed since the last one had been created. Many of us install third-party software that adds some capability to our systems to look for updates, such Apple’s QuickTime and iTunes, and Adobe Reader, to name a few.
With Vista systems and beyond, many automated functions exist on systems a Scheduled Task. One such task backs up copies of the four main Registry hive files (Software, Security, System, and SAM) to the Windows\system32\config\RegBack folder every 10 days. On Windows 7 and 8 systems, the Scheduled Tasks that ship with the systems are found in the C:\Windows\system32\Tasks\Microsoft folder. The task that handles running defrag for the system is the XML-formatted file named “ScheduledDefrag” (no file extension), located in the C:\Windows\system32\Tasks\Microsoft\Windows\Defrag folder. You can open this file in an editor such as Notepad++, and easily view the XML contents. On my Windows 7 system, I can see that the scheduled task is set to run the command “%windir%\system32\defrag.exe –c” every Wednesday while the system is idle. While the file is located in the same location on Windows 8, the contents of the XML file are slightly different, and it’s worth taking a look at the file contents to understand a bit more about what’s going on.
If you want to see when scheduled tasks have actually been run, you can find this information in the Microsoft-Windows-TaskScheduler/Operational Windows Event Log. With this log open in the Event Viewer on my own Windows 7 system on Friday, July 26, 2013, I searched for the word “defrag,” and quickly found hits for Wednesday, July 24, 2013. The event IDs, as they appear in order, are 100 (task started), 200 (action started), 201 (action completed), and 102 (task completed).
As you might suspect, there’s an application Prefetch file in the C:\Windows\Prefetch folder on my Windows 7 system, as well. However, when I viewed the embedded metadata, and in particular the time that the application was last executed, the time stamp was for Friday, July 26, 2013—because I had opened the command prompt, navigated to the system32 folder, and typed the command “defrag /?” to see the meaning of the “-c” switch. If the user never launched defrag.exe, then the last run time from the application Prefetch file for defrag.exe should correlate pretty closely to the most recent “action completed” event within the TaskScheduler/Operational Windows Event Log.
Now, something we have to consider is how a user might go about launching the disk defragmenter, and what that might “look like” on the system. One way to do this is the same way that I did; run defrag.exe via the command prompt. As discussed previously in this book, we might find indications of this in the user’s MUICache entries, or perhaps the RunMRU entries. Unfortunately, running programs via the command prompt doesn’t leave as many artifacts as launching them via the Windows Explorer shell.
Another way to do this is to open the volume properties, choose the Tools tab, and click the “Defragment now…” button. This in turn opens the Disk Defragmenter dialog box. From here, the user can highlight any available volume and then simply click the “Defragment Disk” button.
These are by no means the only ways a user might defragment the hard drive. For example, rather than creating a new Schedule Task via the Task Scheduler wizard (accessible via the Administrative Tools in the Control Panel), the user may download a third-party application or simply go to the command prompt and use the at command to create a Scheduled Task. I did this at 4:11 pm, by typing the command “at 4:15 pm ‘defrag –c’.” This created a task named “At1” in the C:\Windows\system32\Tasks folder. When I checked the TaskScheduler/Operational Windows Event Log at 4:19 pm, I saw event IDs 100 and 200, but they were followed by two error messages, one with event ID 203 (action failed to start), and the other with event ID 103 (action start failed).
Determine data exfiltration
Data exfiltration is a significant problem for organizations. There are a vast number of ways to sneak data out of an infrastructure, and attempting to determine data exfiltration (customers most often ask, “What data was taken?”) from a single system can be a daunting task. Was the data sent out as an attachment to an email (web-based or otherwise), was it typed into a chat window, or was it uploaded to “the cloud”? The possibilities are staggering. When it comes right down to it, unless you’re monitoring the system and the network (and by “monitoring,” I mean full packet captures) at the time that the data was exfiltrated, it can be very difficult to determine what data was actually taken.
This section will not address all possible means by which data exfiltration can be determined, as that would lead to a chapter so massive that it would be unlikely that it, or this book, would ever be published. There has been quite a bit of information published with respect to searching for Internet-based artifacts, including access to web-based email (such as those from Yahoo or Google) and chat services. Information regarding analysis of the user of peer-to-peer (P2P) applications has similarly been published. There is also ongoing research being conducted with respect to a user’s access to cloud-based services, and this information changes quite often. For example, not long after tips regarding the analysis of user access to Dropbox, the service and application were apparently changed, such that an important file on the user’s system was encrypted. What I hope to do with this section is present some examples of artifacts that an analyst can look for on a system with respect to data exfiltration, specifically artifacts that the analyst may not have considered. This section is not intended to be a comprehensive treatment of all possible artifacts, but instead is intended to present some novel artifacts that analysts should include in their analysis process.
One means of data exfiltration that might be considered “old school” is the use of the file transfer protocol (FTP). Most users may not be aware, but Microsoft systems ship with a native, command line FTP utility, ftp.exe. This utility is found in the Windows\system32 folder, and is actually very easy to use, so much so that I’ve seen a number of SQL injection cases where the bad guy issued commands to the target system to create and run an FTP script, and then launched the FTP utility with that script in order to download tools and applications to the system. A simple example of how to run the utility with a script of commands can be found in MS KB article 96269, found online at http://support.microsoft.com/kb/96269.
When a user launches the FTP utility, an application Prefetch file will be created, but as the utility is run from the command line, there will be few artifacts indicating what commands the user issued and what files may have been transferred off of the system. A number of third-party, graphical user interface (GUI) file transfer protocol (FTP) utilities exist which make it easier for a user to transfer files; the use of these utilities will result in the expected artifacts, but again, without monitoring the system at the time that a file transfer occurred, it is very difficult to determine which files may actually have been transferred. I am not aware of any FTP utility or application that maintains a log file on the user’s system of what files were transferred off of the system.
When I first started working with a publisher, the process for transferring and exchanging files required me to access an FTP site via Windows Explorer. This amounted to me opening Windows Explorer and typing the appropriate URL (i.e., “ftp:\\www.site.com” or something similar) into the address bar. A dialog box would prompt me to authenticate to the FTP server, and once I had done so, I could navigate the site just as if I were navigating my local hard drive, and file transfers would occur via drag-and-drop. Once I had authenticated, the FTP server I had connected to and the account that I had used to authenticate (but not the password) could be seen beneath the Software\Microsoft\FTP\Accounts key in my Registry hive file. Further, as I was using Windows Explorer, the server to which I connected appeared in a uniform resource item shell item within my shellbags artifacts. Interestingly enough, when I was later performing timeline analysis of a system that had been compromised via Terminal Services (the admin password had been easy to guess), I could see right there in the timeline that the intruder had used this method for accessing an FTP site, in this case to download files. However, the same method could easily be used to transfer files off of the system, just as I did when transferring chapters of a manuscript to the publisher.
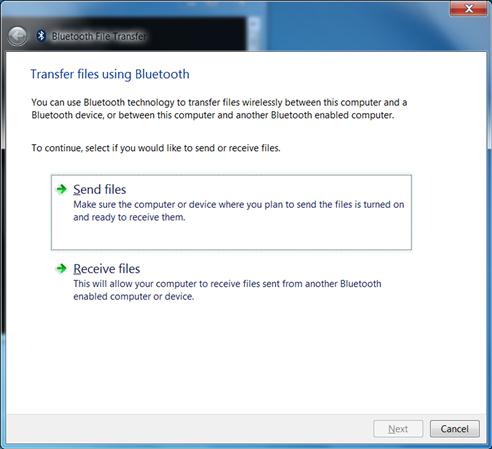
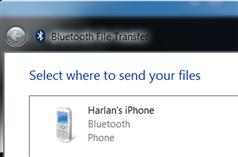
There’s another means of data exfiltration that I don’t believe is considered by many analysts: Bluetooth. A number of systems, particularly laptops, come with Bluetooth radios, and anecdotal information suggests that the necessary drivers and a native Windows application named “fsquirt.exe” may be installed during the operating system installation process if a Bluetooth radio is found. Fsquirt.exe is the Bluetooth file transfer wizard, and is described online at the Microsoft web site, at http://msdn.microsoft.com/en-us/library/windows/hardware/dn133848(v=vs.85).aspx. This wizard is a GUI application, and when launched, the user can select Bluetooth devices to pair with, as illustrated in Figures 8.4 and 8.5, respectively.
Once the user pairs their system with an appropriate device, they then launch a common dialog in order to select files to transfer to the device. As such, Registry data regarding discovered (not necessarily paired with) devices will appear in a timeline, followed by an application Prefetch file illustrating that fsquirt.exe had been launched (or, the file may be modified if it has been launched several times), and an entry in the user’s ComDlg32 Registry key, when correlated together, may provide indications of the user selecting a folder from which to send selected files to the device.
The actual Registry keys that list devices discovered via Bluetooth may vary, depending upon which drivers are installed for the radio. For example, the bthport.pl RegRipper plugin parses data from the Registry keys used by the Microsoft drivers, whereas Broadcomm drivers or those from other manufacturers may use other keys.
Finding something “new”
One of perhaps the most fascinating things about digital forensic analysis is that there’s so much out there yet to learn. I don’t profess to know everything about anything; all I can say is that I’m curious. I’m not an expert on anything; rather, I’m curious and always willing to learn or discover something new.
But how do we do that? How do we learn about or find something new, particularly when we always seem to be on the verge of being overwhelmed, with too much work to get done in too little time? After all, it isn’t bad enough that we’ve got the Leaning Tower of Forensic Casework threatening to come crashing down on our desks, but then a new device or operating system becomes widely available and we need to figure out how to acquire and analyze data from it, without ever actually having access to or having used it. Sometimes it just seems as if the horizon is moving away faster than we can approach it.
What I’ve found over time is that the best way to find something new depends upon the process that I’m using. For example, when I’m creating a timeline of system activity for analysis, I will be sure to incorporate Registry key LastWrite times (per Chapter 7, this would be done via regtime.exe) from the available hive files. This approach adds “general” data to the timeline, as opposed to several of the RegRipper plugins (specifically, those that end in *_tln.pl) which add extremely targeted information, such as a user’s UserAssist data, or the first item of an MRU list, to the timeline. In several instances, this step in my timeline creation process has shown me potential artifacts that I might otherwise have missed. During one particular exam, I was examining a system that had been infected with a variant of a fairly prevalent bit of malware. By incorporating all of the Registry key LastWrite times from the various hive files into the timeline, there was one particular key that had been modified at a specific time, which was right in the middle of the time window during which the system had been infected. Because of the granularity provided by the timeline, I could see the entire infection process, and this one Registry key stood out to me as somewhat odd. So the first thing I did was to open the hive in question in a viewer, and navigate to the key, and found that it had a single value. At this point, I was left wondering, was the value data modified, or was something (a subkey or value) deleted, causing the LastWrite time to be updated? I had the key LastWrite time, so I mounted the image of the system using the virtual hard drive (VHD) method (as outlined in Chapter 3), determined the available VSCs, and then extracted the hive file from the VSC that has been created immediately prior to the key LastWrite time. I attempted to locate the key in question, but could not find it. I checked the hive files available in other VSCs (there were only two more) and even ran regslack.exe against the hive file, just to verify that the key hadn’t existed, been deleted, and then recreated. All of these attempts yielded negative results, which let me to conclude that the key and value had actually been created during the infection process; online research determined that the key/value pair, along with the associated data, essentially “disconnected” the IE web browser from Java. In short, the system had been infected by a browser drive-by that compromised Java, and the infection process disconnected IE from Java, basically “shutting the door” so that the system could not be infected via the same means any longer. What I found fascinating about this was that it was not only very simple and very clever, but it was not directly associated with the malware binary itself; rather, it was associated with the infection process. Therefore, this Registry key being created would not become part of a malware analyst’s write-up if a customer located the malware binary and sent it (just the binary) to the analyst. This method of analysis means that important information about the infection process, which can be used to address protection and detection mechanisms within the organization (often referred to as “threat intelligence”), is then missed, as the focus is solely on a single binary. Adding the Registry key LastWrite times to the timeline essentially amounts to “casting a wide net,” providing a high-level view of activity on the system right alongside the more tactical data extracted from specific Registry value data, which allowed me to find something new in my analysis. Adding this data is simply part of my process, and that step served me well in this instance.
Having an analysis process provides additional advantages, as well. In particular, one of the things that will very often jump out at me during analysis is gaps in data. For example, if my analysis goal is to determine the files that a user accessed on a Windows 7 system, there are a number of locations I’ll check, including the user’s Jump Lists. If during analysis, I find that the user had been logged into the system at a particular time, but there were no Jump Lists; not just those associated with applications such as MS Office or Adobe (applications used for accessing and viewing files) but for all applications, this might be suspicious, and I would want to look for indications of the use of anti-forensic tools, such as CCleaner, Evidence Eliminator, etc. An analysis process not only helps me document what I did (what data was looked at or added to my timeline), but it also tells me what I should be seeing in the data. If I had parsed the DestList streams in a user’s Jump Lists, and via an automatic, scripted process, also parsed those streams available in Jump Lists found in VSCs, and found no indication of access to files during a specific time frame, when I knew that the user was logged into the system (via interviews, data analysis, etc.), then this gap might be explained by the use of tools that would remove the data.
My point is that knowing about different artifacts will only get an analyst so far in their analysis. The key is to have a process for incorporating and correlating various artifacts based on the goals of the exam, in order to not only determine “new” findings (and potentially very significant threat intelligence), but to also assist in locating gaps in the data that is being analyzed.
Summary
No two examiners will perform the exact same analysis; given the same data or image to analyze, it is unlikely that you’ll find any two analysts who will pursue identical goals by following identical steps. This is largely due to training and experience. Many times, it can be useful to see how other examiners go about their analysis process, how they pursue the goals of their examinations, and how they address and overcome problems that they face during an exam (i.e., absence of information). Sharing this information about analysis processes (not the actual case data itself, or case specifics) not only gives other examiners ideas on how to approach their own analysis, but also allows them to ask questions so that in the end, everyone benefits from improved processes and views into the examinations. The best way to achieve this is open up what we do to review by peers, and people we can trust and rely on to be supportive.