UP TO THIS point, I have stressed the importance of continuous innovation to deliver meaningful differentiation in the marketplace. But I haven’t yet examined how to measure product differentiation, nor identified effective strategies to help companies create products and services that break away from the competitive pack. My task in this chapter, and the one that follows, is to clarify how a company caught in a dogfight can become a cat.
A logical starting point is the question raised in the title of this chapter: What makes products meaningfully different? Marketers and strategists are taught that it shouldn’t matter what a company thinks about its products and services. Rather, understanding consumer perceptions is the key to unlocking opportunities to serve unmet needs and to differentiate product offerings.
Product Positioning
The applicable theory for understanding consumer perceptions is product positioning.1 This theory describes the process by which a firm markets its products and brands to occupy a distinct and valued position in a consumer’s mind. Positioning theory rests on three principles:
1. Market research can measure how consumers perceive competing products according to tangible and subjective product attributes. (Examples of tangible attributes are digital camera quality in megapixels, car fuel economy in miles per gallon, and product price. Subjective attributes include “fun to own,” “easy to use,” “best looking,” “best tasting,” or “best value,” all measured on subjective rating scales).2
2. Companies can influence how its products are perceived by altering the “4Ps” that define the presentation of products in the marketplace.3
• Product—the design and features of the product or service.
• Place—the physical and online channels through which the product or service is sold.
• Price—the cost and terms associated with purchasing the product, including up-front price, payment terms, and recurring fees.
• Promotion—the mechanisms used to promote the product in the marketplace, including all forms of mass and direct marketing, point-of-sale displays, sales promotions, and public relations.
3. Companies can (and should) develop products and services that differentiate themselves from competitors in ways that are recognized and valued by consumers, i.e., by the creation of a distinct product position.
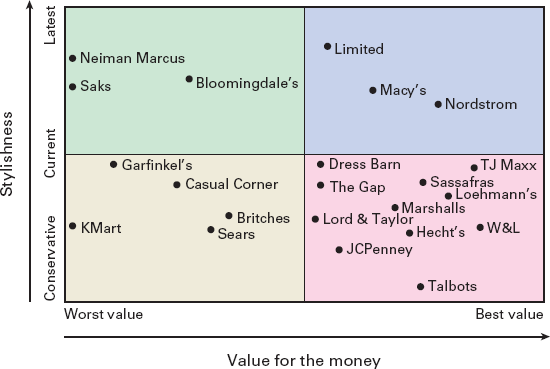
The basic technique used to analyze differentiation and product positioning is perceptual mapping, which evaluates how consumers perceive competing products based on a set of relevant performance attributes. For example, figure 9.1 shows how consumers perceived women’s clothing retailers in the Washington, DC, market on two attributes: value for money (from worst to best value) and stylishness (from conservative to current fashion).4 This perceptual map can be interpreted to develop a number of insights on how consumers perceive competing retailers.
Figure 9.1 Example of a two-attribute perceptual map for women’s clothing retailers
• First, which companies consumers perceived to be the closest competitors, based on specific attributes. For example, Neiman Marcus should concern itself more with competition from Saks than from JCPenney. Based on consumer perceptions, JCPenney has very different performance characteristics, and therefore has a very different customer appeal than that of Neiman Marcus.
• Second, it can be determined whether a retailer has an image deficiency compared to competitors. In this study, for example, JCPenney was considered to be both less stylish and a worse value than Hecht’s.
• Third, it can be seen if there is a “white space” opportunity not being pursued by any competitor. For example, no retailer is positioned above Macy’s as both stylish and good value.
The next few pages explore the theory underlying a variety product-positioning techniques. Readers who wish to skip directly to a discussion of the common pitfalls and strategic implications of applying these techniques should skip to the next major section, “Common Product Strategy Traps.”
How did market researchers obtain the data required to generate the perceptual map depicted in figure 9.1? By simply asking consumers what they thought about competing brands.
Table 9.1 displays the type of the data used in creating the perceptual map shown in figure 9.1. A sample of consumers was asked to rate twenty women’s clothing retailers on a scale of 1 to 7 (worst to best) based on fifteen attributes, including value for money and stylishness. As shown in the table, one survey respondent rated Nordstrom a 7 for customer service, while JCPenney was given only a 3 for the same attribute. On the other hand, Nordstrom received a very low rating for convenient locations, while the relatively ubiquitous JCPenney scored higher in this attribute.
TABLE 9.1
Data Collection for Perceptual Mapping
| |
Saks |
Nordstrom |
JCPenney |
Sears |
The Gap |
| Value for money |
2 |
3 |
1 |
5 |
4 |
| Stylishness |
6 |
7 |
4 |
1 |
6 |
| Customer service |
5 |
7* |
3 |
4 |
6 |
| Shopping experience |
5 |
6 |
4 |
2 |
4 |
| Convenient locations |
3 |
1 |
4 |
4 |
5 |
| 10 other Categories |
… |
… |
… |
… |
… |
| Overall preference Rank |
2 |
1 |
4 |
5 |
3 |
* “On a scale of 1 to 7, how would you rate Nordstrom for shopping experience?”
By averaging the ratings of each of the twenty retailers for the fifteen attributes, a perceptual map can be created for any pair of performance characteristics, as was the case in figure 9.1.
As part of this analysis, survey respondents were also asked to rank their overall preference for each of the twenty retailers, as shown in the bottom row of table 9.1. This allowed researchers to develop two additional insights on consumer behavior: the importance consumers attach to each attribute, and the size and composition of distinct market segments that differ in these respects.5
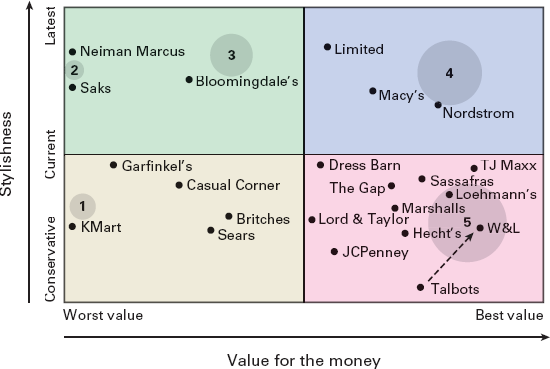
An analysis of the data from the study on women’s clothing retailers found that there were five distinct consumer segments. These are represented by the numbered circles shown in figure 9.2. The size of the circles is proportional to the number of consumers in each segment, while the center of each circle is positioned at the optimal trade-off between value for money and stylishness for consumers within a particular consumer segment.
Figure 9.2 Idealized positioning for women’s clothing retailers by market segment
Figure 9.2 suggests that Neiman Marcus and Saks appeal to a small consumer segment that is willing and able to tolerate high prices (worst value) for the latest trends in women’s clothing. At the other end of the spectrum, the largest segment is composed of price-conscious consumers who are best served by a number of competitors that offer conservative styles at an attractive price.
Armed with the results of such an analysis, individual companies can assess their strategic situation and make informed choices about the positioning of their products. As illustrated by the arrow in figure 9.2, Talbots should recognize the need to reposition its merchandise with more stylish clothing at better prices, in order to be perceived as closer to the preferred trade-off between stylishness and value. Sears, Britches, and Casual Corner appear to be in particularly vulnerable positions, seemingly out of touch with consumer preferences in any segment, suggesting the need for radical rethinking of their product and market strategies.
These are strategically potent insights. Even rudimentary perceptual maps can inform companies whether their products are sufficiently differentiated from the competition and if they are well positioned to appeal to targeted segments of the market. Armed with such analyses, product planners have the ability to make informed decisions about how to win in the marketplace with highly valued, differentiated products.
However, as I will show, product-positioning analyses may unwittingly lure companies into strategies that yield less differentiation in the marketplace. Before exploring these hidden traps, I’ll review a few additional perceptual-mapping techniques to provide a more complete picture of the common types and uses of product-positioning theory.
More Perceptual-Mapping Techniques
The previous depiction of product positioning has been limited to two attributes at a time. For example, figure 9.2 displayed how various retailers compare in value for money versus stylishness, even though consumer ratings of many other attributes were available from the data collection effort. I could, of course, construct a new two-by-two positioning chart with, for example, customer service versus value for money on the two axes. However, this too would provide only a partial picture of how competing players are positioned relative to all attributes.
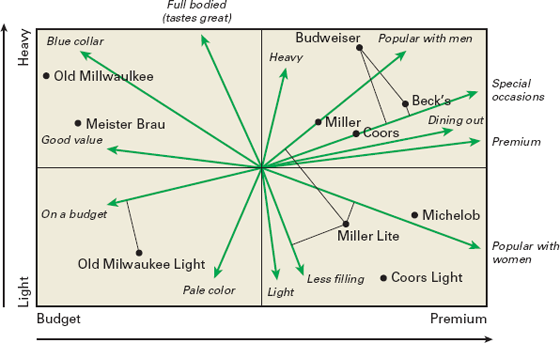
It is possible to depict how multiple products are positioned with respect to multiple attributes through multivariate perceptual-mapping techniques. An example of this technique from the beer industry is shown in figure 9.3.6 Needless to say, when multiple products are positioned relative to multiple attributes, the resulting graphical depiction is complex. However, with suitable explanation, multivariate perceptual maps can provide considerable insight on product positioning.
Figure 9.3 Multivariate perceptual map: beer industry
In figure 9.3, each vector emanating from the center of the chart represents a beer product attribute (or a combination of correlated attributes combined into a single measure).7 For example, attributes measured in this study include how each beer was rated as being full bodied, light, popular with women, blue collar, premium, and so on. The interpretation of the direction and length of individual vectors can be explained as follows.
The longer the vector, the greater the significance of the attribute in explaining perceived differences between products.8 For example, in figure 9.3, the factors “popular with men” and “special occasion” are strong differentiators in distinguishing competing beers, whereas “heavy” and “good value” are less discriminating.9
Vectors that are polar opposites are inversely correlated. That is, beers that are rated highly for one factor will tend to rate lower on the opposing factor(s). For example, the “full bodied” attribute vector is, not surprisingly, the polar opposite of the vectors associated with light and less filling beers.
Vectors that are orthogonal—at right angles to one another—are uncorrelated. That is, beers rating highly for one factor will have no particular tendency to rate high or low on the orthogonal factor(s). Examples of orthogonal attributes in figure 9.3 include “good value” and “heavy.”
For convenience, a set of “north/south” and “east/west” axes are generally added to multivariate perceptual maps to highlight particularly important attributes in distinguishing products. In figure 9.3, the attribute vectors are arranged around a heavy/light vertical axis and a budget/premium horizontal axis.10
The question remains how to interpret the product positions of the individual beers depicted on a multivariate perceptual map. To see how any given beer is perceived regarding a particular attribute, one needs to draw a line from the position of the beer on the map to a point that intersects a particular vector at right angles. The further out the intersecting line is along the vector, the higher the beer is rated for the specified attribute. Some examples will help to demystify this complex geometry.
In the “northeast” quadrant of figure 9.3, both Budweiser and Beck’s are considered to be nearly equally popular with men because their perpendicular lines intercept this vector at roughly the same point. But Beck’s is more strongly associated with being a beer for special occasions, as it is positioned farther out along this vector than Budweiser.
In the southwest quadrant, Old Milwaukee Light is the beer most strongly perceived as a product for consumers on a budget, compared to all the other beers in this study.
In the “southeast” quadrant, Miller Lite is strongly associated with being a less filling beer and popular with women. But what about male beer drinkers? The perpendicular line from Miller Lite intercepts the “popular with men” vector, implying that at the time this product-positioning study was conducted, Miller Lite was considered to be decidedly unpopular with men.
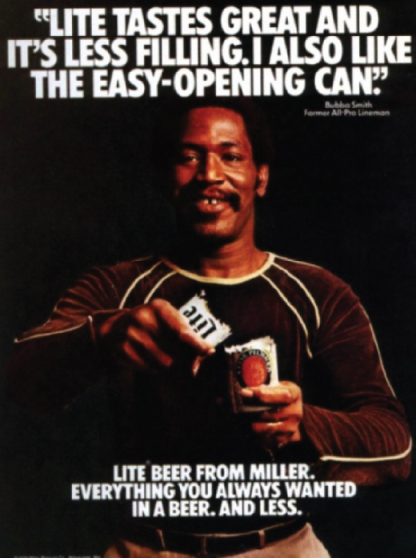
Suppose you were the brand manager of Miller Lite, presented with the results of this perceptual map depicting how your beer was seen in the marketplace. It’s easy to see that a logical response would be to try to reposition Miller Lite as more appealing to men, without weakening the strong brand affinity for women. After all, men drink the majority of beer in the U.S. market.
This is exactly what the company tried to do with its long-running “tastes great/less filling” ad campaign, which featured burly male sports figures comically extolling the virtues of Miller Lite. The intent of these ads was to change how men perceived Miller Lite in an attribute of keen importance—full-bodied taste—while still retaining the perception of being less filling (and with fewer calories) that had found favor with women. For example, figure 9.4 shows a representative Miller Lite print ad featuring former NFL lineman Bubba Smith. The underlying message is that if Miller Lite is robust enough to appeal to an elite athlete like Bubba Smith, then surely it should be manly enough for the average male beer consumer.
Figure 9.4 The Miller Lite “Tastes Great” advertisements featuring Bubba Smith were representative of the brand (1977). Photo © Miller Brewing Company, MillerCoors.
Miller Lite’s marketing strategy was successful. For nearly twenty years, Miller Lite ranked as the top-selling light beer in the United States, and its “tastes great/less filling” marketing initiative was chosen as the eighth-best advertising campaign of the twentieth century by Advertising Age magazine.11
In perceptual-mapping terms, Miller Lite’s advertising campaign was trying to reposition how the beer was perceived in the market, as hypothetically shown in figure 9.5. In the desired new positioning, Miller Lite would continue to be associated with being less filling, but would now be thought to be popular with both women and men.
Figure 9.5 Illustrative repositioning of Miller Lite
The desired new positioning would also convey other positive brand associations, including premium status and being a product for dining out or special occasions. This example illustrates how perceptual mapping can help brand managers formulate marketing strategies and help monitor consumer perceptions over time.
Multidimensional Scaling
Perceptual maps can also be developed to assess competing products, even if the exact attributes consumers use to evaluate products are unclear. With multidimensional scaling (MDS) techniques, consumers are asked to rank the degree of similarity between competing products based on whatever criteria they deem relevant to their evaluation.12 This approach allows consumers to express preferences in their own terms, avoiding the introduction of flaws due to the researcher’s preconceptions of marketplace behavior. After the analysis is complete, MDS results can be interpreted to reveal the actual underlying attributes that best explain consumer choices.
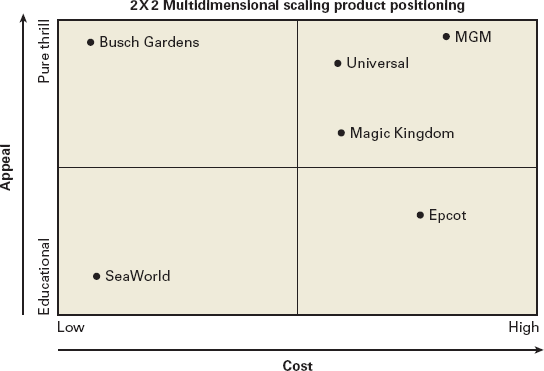
For example, Table 9.2 depicts the responses of a survey respondent ranking each of fifteen distinct pairings of U.S. theme parks on the basis of perceived similarity, from 1 (most similar) to 15 (least similar). Figure 9.6 displays the results of an MDS analysis of several hundred such responses, which places each amusement park in a position that closely replicates the similarity ratings, measured by the distances between data points on the two-by-two grid. Theme parks that are positioned close together on the MDS plot were rated similarly in the underlying data, while those positioned far apart were perceived by consumers to be distinctly different.
TABLE 9.2
Similarity Rankings of Theme Parks
| |
Universal |
MGM |
SeaWorld |
Magic Kingdom |
Epcot |
| Busch Gardens |
11 |
12 |
10 |
6 |
13 |
| Universal |
|
1 |
14 |
2 |
5 |
| MGM |
|
|
15 |
3 |
6 |
| SeaWorld |
|
|
|
8 |
9 |
| Magic Kingdom |
|
|
|
|
4 |
Figure 9.6 Multidimensional scaling analysis of theme parks
For example, consumers thought Universal was similar to MGM, but distinctly different from SeaWorld. Busch Gardens also appears as dissimilar to SeaWorld on the vertical axis, and a polar opposite to Epcot.
In the MDS analysis, it is not known what park attributes are being plotted on the two axes on the chart. However, after examining the pattern of product positioning, researchers can infer that the horizontal axis likely relates to cost, while the vertical axis distinguishes parks by their emphasis on thrill rides versus an educational experience. These hypothesized attributes can be validated by follow-up interviews with survey respondents.
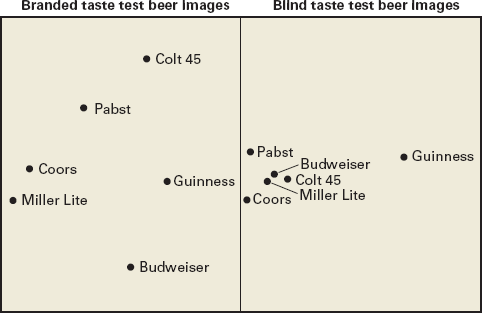
As a final example of product-positioning analysis, consider the results of a two-dimensional MDS analysis of competing beers displayed in figure 9.7.13 In the left-hand panel, taste-test respondents were asked to rank the similarity of various beers, with prior knowledge of which brand of beer was in each sampling glass. The resulting beer-brand positioning suggests that the horizontal axis of the perceptual map is associated with the robustness of beer taste (with the weakest on the left), while the vertical axis reflects perceived price differences (with the lowest price on top). These results reflect what consumers think about beers when they know what they’re drinking.
Figure 9.7 Beer product positioning
The same products were then analyzed in a follow-up MDS analysis, this time hiding the brand identity of the beers. These results are depicted in the right panel of figure 9.7. Only Guinness proved to have a distinct, differentiated taste. Based on taste alone, consumers could not differentiate between competing products—despite advertising claims to the contrary. These results demonstrate that marketing can create distinct brand images, even when basic product attributes are difficult for consumers to distinguish.
Common Product-Strategy Traps
These examples illustrate that product-positioning analyses can provide insights on how consumers perceive competing products based on multiple attributes. Thus, perceptual mapping can serve as a valuable tool in developing marketing strategies.14 But product-positioning techniques have some hidden traps that are important to understand. For one thing, there is nothing proprietary about perceptual mapping. Therefore, it would be prudent for marketers to assume that all major competitors are aware of the product characteristics required to appeal to targeted customer segments. The first company to create value by adding a desirable new feature in any particular product category should expect that the question is only when, not whether, competitors will copy (or leapfrog) their temporary advantage. Product-positioning dynamics tend to follow predictable patterns over time, often yielding increasingly undifferentiated products that all vie for the same customers with similar product features and functions.15
To see how these market forces play out, consider the typical life cycle of a new product, from groundbreaking launch to market maturity. In response to the entry of a promising new product or service (e.g., smartphones or wearable fitness trackers), fast followers invariably enter the fray with competing products offering a variety of price/performance trade-offs, in the hope of finding the market’s “sweet spot”—i.e., the most appealing consumer value proposition (left-hand panel, figure 9.8). Given the inherent uncertainties in understanding consumer preferences in early-stage markets, competitors experience hits and misses, with some products gaining more market traction than others.
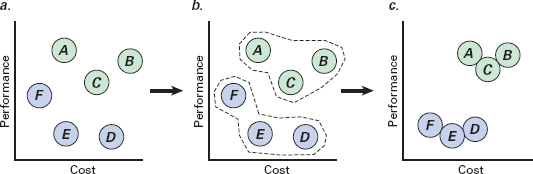
Figure 9.8 Competitive dynamics in product positioning. a In the early stages of a new product on the market, competitors typically offer a wide variety of differentiated choices in search of market traction; b Over time, the pressure to copy successful positioning moves, especially by those closest on the perceptual map leads to continuous back-and-forth replication among competitors…; c…which ultimately leads to competitive clustering, such that the differentiation within product segments (e.g., high-end vs. low-end) becomes less distinct over time.
As demand patterns become more apparent over time, each company seeks to find new ways to differentiate its products, while also copying competitors who have beaten them to the punch on desired features or functions (middle panel, figure 9.8). Ultimately, this back-and-forth replication, particularly amongst similarly positioned players, leads to competitive clustering, with little sustained differentiation in key features within clearly defined high- and low-end market segments (right-hand panel, figure 9.8).16
For example, ever since Apple ushered in the modern smartphone era in 2007 with its original iPhone, it has played leapfrog with Samsung and other companies in a race for superiority on processor speed, screen size, display resolution, camera quality, fingerprint identification, and other technical specifications. However, none of the competitors have been able to sustain technical superiority over successive product cycles.17 Similarly, in consumer packaged goods such as toothpaste (Colgate versus Crest), diapers (Huggies versus Pampers), and shampoo (Clairol versus Pantene), companies quickly replicate any new product feature that might give a competitor a temporary market advantage. The net result is a blurring of product distinctiveness that often leaves consumers hard-pressed to identify meaningful differences between closely matched competitors. After all, when every product on the market seems to offer “Extra Whitening,” “Extra Absorbency,” or “Extra Shine,” it becomes a challenge for consumers to differentiate them.
Another market dynamic related to this competitive herd instinct is augmentation, which refers to the tendency of companies to continuously enhance product performance on well-defined product attributes over successive product cycles (while often also increasing price). Augmentation reflects perfectly rational marketplace behavior. After all, improvements in product technology enable companies to steadily enhance product performance, and consumers are likely to recognize, value, and expect improved functionality over time.
The problem is that augmentation often leads to feature–function “arms races” that eventually yield products with more functionality and cost than most consumers want, need, or value. When this happens, companies find themselves in the unenviable position of having overshot real marketplace needs, which usually results in consumer price resistance, stalled growth, and decreasing margins.
Economic theory recognizes that consumer behavior follows the law of diminishing marginal utility, which states that each additional unit of consumption of a product yields lower consumer benefit. For example, the tenth bite of chocolate cake rarely seems to be as satisfying as the first. Similarly, the marginal value associated with an attribute of product performance generally declines as performance levels continue to improve.
Consider personal computers, for example. In the early stages of market development, rapid improvements in PC capability propelled strong growth in demand from first-time buyers and repeat purchasers looking for upgraded performance. But while Moore’s law18 projected that producers could double PC processing power every two years, the need for increased PC performance among consumers grew at a more modest pace.
This aligns with my own personal experience. My first home computer—a 1982 IBM PC—was equipped with a 4.8 megahertz processor, a then top-of-the-line 256 kilobyte internal memory, and a low-resolution 11.5 inch green-screen monitor, all of which cost over $3,000 (in 1982 dollars).
Fast-forward to 2016, and a typical midrange home computer now offers a 3.7 gigahertz processor (more than 800 times faster), eight gigabytes of memory (over 31,000 times bigger), and a 27 inch high-resolution touch-screen color monitor—all at a cost 80 percent lower than my original PC.
I’ve upgraded my PC several times since 1982 but reached a point several product generations ago when my computing needs were more than adequately served by my current computer, rendering further advances in speed or capacity of little value. While there are undoubtedly some power users—e.g., gaming aficionados, graphics designers, and big-data number crunchers—who need and will pay for ongoing improvements in PC performance, ever-increasing PC performance yields little meaningful differentiation or value for the majority of consumers.
Nonetheless, most PC manufacturers have moved in lockstep in augmenting performance levels over successive product generations, which makes it difficult for any one player to stand out—at least on the basic parameters of system capability. Thus, the PC market exhibits the characteristics of a classic competitive dogfight, with each player metaphorically scratching and clawing for advantage, in the futile pursuit of market dominance. If you happen to be in the market for a midrange Windows-based personal computer, you’ll find that Asus, Dell, HP, and Lenovo provide numerous competent choices, but little meaningful distinction or differentiation.
Feature–function augmentation is a common competitive dynamic in most product categories. To paraphrase E. F. Schumacher, the renowned twentieth-century British economist, any intelligent fool can make things bigger and more complex, but it takes a touch of genius—and a lot of courage—to move in the opposite direction.19
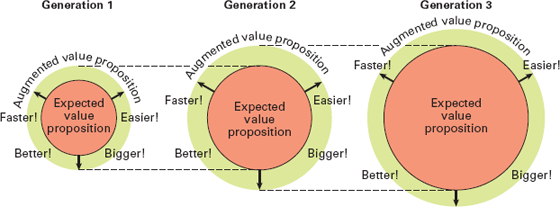
Illustrated by the left-hand panel of figure 9.9, the first generation of any new product is typified by competitors jockeying for advantage by making their entry better on a number of dimensions, e.g., faster, bigger, more effective, or easier to use. But these features of augmented value in any first-generation product are quickly adopted as standard requirements in the next generation of products brought to market (middle panel, figure 9.9). This precipitates a second round of augmentation that, once again, drives each competitor to seek competitive advantage on key elements of product performance.
Figure 9.9 Product augmentation trends
Over time, each new generation of products incorporates more baseline functionality, with ever-smaller improvement in perceived consumer value. This is depicted in figure 9.9 by the shrinking size of the “augmented value proposition” outer band, relative to the core value consumers expect in successive generations of product development. This competitive dynamic is exactly what Clayton Christensen identified in his seminal work on disruptive technologies concerning the pervasive tendency of incumbent players to eventually overshoot the needs of mainstream customers. This competitive dynamic opens the door to new entrants, disrupting the market with simpler, lower-cost solutions.20
As a case in point, when I ask my MBA students if they would rush to replace their laptop computer if a new model offered 50 percent more speed and storage capacity at a price 25 percent lower than they originally paid, I usually get no takers. For most MBA students, and for most consumers at large, the performance of their home computer is more than adequate to meet current needs, underscoring the decline in PC sales.
Global sales of PCs peaked in 2010 and have been declining ever since, hitting an eight-year low in 2015. By 2007, recognizing that they had overshot the needs of many consumers, several PC makers began defying augmentation trends by offering laptop computers with decidedly less performance (in speed, memory capacity, battery life, and screen resolution) at considerably lower prices. These sub-$250 “netbook” models tapped a sizeable segment of consumers who had previously been priced out of the mainstream PC market. Netbooks became the fastest-growing category of the PC market in the ensuing three years.
Apple also defied augmentation trends when it introduced its first tablet computer in 2010. Rather than trying to outmuscle competitors on traditional measures of PC performance, Apple created an entirely new category of personal computing by emphasizing fundamentally different performance attributes, such as wireless connectivity, touch-screen user interface, and access to a broad ecosystem of media and entertainment content. While PC sales were declining, tablet sales grew from less than twenty million units in 2010 to nearly 230 million units in 2014.21 Becoming a cat in the PC dogfight proved highly rewarding for Apple and its fast followers.
Until recently, the situation has been different in the smartphone market, where ongoing enhancements in product performance and size continued to motivate many consumers to trade up for new models every two years. However, continued feature–function augmentation is now showing signs of overshooting consumer needs in the smartphone market as well, with forecasts calling for lengthening replacement cycles and declines in price realization and growth beyond 2015.22
Defying Industry Rules
Consumers play a strong role in promoting product augmentation and competitive clustering because of the self-reinforcing behaviors between companies and their customers. After all, the more firms learn about consumers, the better they can adjust to consumer expectations, attitudes, emotions, and behaviors. In turn, consumers form beliefs about what to expect from companies in a given category, reinforcing product norms and category images.
Taken together, this symbiotic relationship leads to the development of well-defined category images, norms, and structures, which collectively define the rules of the game in a given industry. The following examples help illustrate why so many product categories turn into competitive dogfights, opening opportunities for a few enlightened companies to break away from the pack by offering products with fundamentally different value propositions.
Category Norms
Category norms refer to implicit rules and standards that emerge in a product or service category. Consumers come to accept these norms as “just the way business is done”—at least until a newcomer emerges to challenge what has really been a matter of industry choice, not immutable law. The travel industry is rife with examples. In the hotel industry, in the years before mobile phone ownership was de rigueur, it was expected that business hotels would charge for local landline calls, but provide shampoo, bodywashes, and grooming supplies gratis. There is no compelling reason why the industry had to operate this way, but such were the unwritten, widely followed practices within the hotel industry for decades. Similarly, in the airline industry, it was assumed that a ticket entitled passengers to an assigned seat, free nonalcoholic beverages and meals, inflight amenities (e.g., pillows, blankets), and frequent flyer credits. But low-cost carriers like Spirit Airlines chose to defy all these norms, offering a bare-bones service at rock-bottom fares. Spirit recognized that many consumers are willing to trade comfort for low fares, enabling the airline to achieve impressive, profitable growth.23
Well-established industry norms are found in virtually every product category, reflecting implicit assumptions about how consumers value price/performance trade-offs. When most competitors move in lockstep, offering similar products at comparable prices, it opens the door to newcomers to better serve specific market segments that prefer different price/performance trade-offs (e.g., netbook manufacturers and low-cost airlines) or an emphasis on altogether different product attributes (e.g., iPad and Swatch).
Category Structure
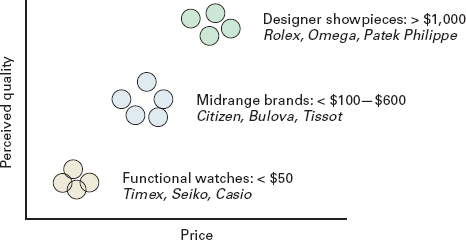
As a result of the competitive clustering dynamics described earlier, most industries evolve toward a clearly defined category structure defined in terms of distinct price and product-quality tiers. Take the watch industry, for example. For decades, watchmakers competed in three distinct product segments, as illustrated in figure 9.10. Low-end watches were positioned primarily as disposable functional tools—to reliably and accurately tell the time—sold through mass-merchandising channels at low prices. Timex pioneered the development of low-cost mechanical movements in the 1950s, and this was followed by the introduction of low-priced quartz digital watches by Japanese watchmakers in the 1970s.
Figure 9.10 Watch industry category structure
Midrange watches provided a greater emphasis on durable materials (e.g., stainless steel) and sophisticated design, sold at higher prices through limited retail distribution. At the top of the range, high-end watches distinguished themselves by sophisticated design and the use of precious jewels and metals. These designer showpieces were intended to serve as timeless family heirlooms, best expressed by one watchmaker’s advertising tagline: “You never actually own a Patek Philippe watch, you are merely the caretaker for the next generation.”24
Competing to win as a newcomer in such a highly structured industry against competitors with considerable assets, scale, and brand cachet is a daunting task. Accordingly, when Swatch Group—owner of such distinguished watch brands as Omega, Longines, and Tissot—pondered how to respond to the threat of low-priced quartz digital watches from Japan, it chose to ignore the widely accepted industry structure by seeking to change the rules of the game. The company launched the Swatch brand to create a unique value proposition that did not fit neatly into any of the established watch industry segments. While priced near the low-end watch of the watch market, Swatch positioned its products as boldly styled fashion accessories, rather than as functional timepieces.
This strategy not only provided the basis for meaningful and uniquely appealing product differentiation, but it also encouraged many customers to purchase more than one Swatch—not unlike the tendency to own many pieces of costume jewelry or scarves—thus creating a sizeable global market that Swatch dominated for years.25 More recently, Apple is seeking to redefine the basis of competition in the watch industry by blending elements of classic watch styling with advanced wireless technology. The Apple Watch is yet another metaphorical example of a smart cat avoiding a brutal dogfight.
Category Image
Industry norms, well-defined product segmentation structures, and convergent competitor behaviors collectively shape an image consumers associate with product categories as a whole. Category images are distinctly different from the discussion in chapter 7 on the characteristics of individual product and brand images.
To illustrate this point, I often ask my MBA students to think of the first descriptors that come to mind when I mention a particular product or service category. Table 9.3 reflects the characterizations suggested by my students—both good and bad—affirming that categories as a whole are associated with stereotypical images.
TABLE 9.3
Category Images
| Category |
Category Image |
| Socks |
Functional, boring |
| Lingerie |
Sexy, indulgent |
| Car dealers |
Sleazy, unpleasant |
| Insurance |
Boring, complicated |
| Champagne |
Special occasion, expensive |
Understanding category imagery is important because it often provides the starting point to identifying opportunities for meaningful product differentiation and competitive advantage. In particular, breakaway strategies reject established industry norms and category images to appeal to customers who are not well served by existing products and services.
In chapter 1, for example, I cited the case of LittleMissMatched that sells socks in sets of three unmatched items in bold colors and designs—the antithesis of the category image of functional, boring products. This sharp departure from the prevailing category image has allowed LittleMissMatched to build a strong and loyal following among tween customers.26
As another example, when General Motors launched the Saturn car division in 1990, its most salient distinguishing characteristic was a customer-friendly sales and service process, intended to overcome the strongly negative stereotype that had plagued the industry for decades. Saturn initially succeeded with this markedly different positioning, before inferior product performance ultimately dragged the brand down.
Similarly, it shouldn’t be surprising that some insurance companies have sought to break from their negative industry stereotype of boring, complicated products by the use of category-busting advertising spokespersons—such as a talking gecko (Geico) or a perky sales agent (Progressive) to promote simple value propositions in humorous terms.27
Finally, when Casella Family Brands was considering whether or not to expand its Yellow Tail product line into the sparkling wine category, it was well aware of the U.S. consumer image of champagne as a luxury/reward product typically associated with special occasions. Rather than trying to compete head-on with prestigious champagne brands in this venerable category, the company chose to sharply break away from the category image. Priced at under $8 per bottle, and whimsically named “Bubbles,” Yellow Tail sparkling wines were promoted as casual and refreshing adult beverages intended for everyday consumption. While it is still unclear whether consumers will embrace such a radical departure from the ingrained image of sparkling wines in the United States, Casella Family Brands has clearly and wisely sought to compete as a cat in this category dogfight.28
The Essence of Meaningful Differentiation
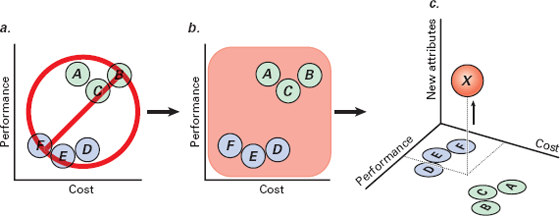
In each of the examples I have cited, enlightened companies rejected industry norms, structures, and category images by focusing on entirely new product attributes in an attempt to appeal to consumers poorly served by existing products. As shown in figure 9.11, breakout products seek to create entirely new bases of consumer appeal in uncontested product spaces.
Figure 9.11 Breakout product positioning. a Breakout products reject conventional product positioning…; b…by approaching a category holistically, identifying vulnerabilities in overall industry norms, structure, and image…; c…to position products differentiated primarily by entirely new product attributes that serve latent unmet consumer needs.
Companies that successfully launch breakout products choose not to be bound by conventional category norms, which are inherently based on how current products are perceived by current consumers in terms of current product attributes. Rather, breakout product strategies recognize that the most promising market opportunities may found by competing on meaningfully different terms. In other words, by identifying new product attributes that create entirely new bases of consumer appeal; attracting nonconsumers who have not been well served by current products; creating new demand in uncontested new markets; and rendering current competition irrelevant.
This concerted effort to break from current category conventions lies at the heart of all spectacularly successful new product launches, exemplified by Swatch, IKEA, CNN, Southwest Airlines, Nintendo Wii, Apple iPod, iPhone and iPad, Cirque du Soleil, Uber, Snapchat, and Netflix.