Most executives who make it to the top of their organizations are highly task-oriented. But many are also inclined to be concerned with their relationships. Ten CEOs and managing directors of divisions in a large, multinational firm were identified by a group of senior executives at the firm’s headquarters. Vansina (1982) carried out a qualitative description of the 10 leaders using semistructured taped interviews that were subsequently content-analyzed. The 10 leaders were selected for their consistently “excellent performance in different business situations in different parts of the world” (p. 2). Vansina inferred that the leaders worked through people for whom they cared. They wanted to create an operating climate in which employees at every level in their organization knew what they were working for and what tasks needed to be done. Concerns about tasks and relationships were to be met by providing members with the appropriate means, authority, knowledge, and resources. The leaders had a keen interest in spotting and developing young talent and a low tolerance for poor performers. To establish organizational commitment, they saw their need to develop personal and professional relationships and collaboration through personal example, consultation, and removal of obstructions and incompetent people. They kept actions simple and followed them up to monitor progress. They carefully managed the linkages between headquarters and key persons, and between business objectives and social responsibilities. They were self-confident, responsible, and open-minded. They learned the local language and had direct contact with employees.
Concern for task and relations was illustrated by Andrew Grove, CEO of Intel, known for his innovation in the design and manufacture of computer chips. His egalitarianism came from his escape from Hungary during the Nazi occupation. For him, America was symbolized by respect for intellect and for others as human beings. The culture of Intel he initiated combined informality in relationships, high standards, and hard work (Tolkoff, 1998). Also equally concerned about tasks and relationships, Robert E. Wood changed Sears from solely a mail-order business into a chain of retail stores with a strategy of meeting customer needs, buying to specification, building good relations with suppliers, and creating an image of each store as local rather than as part of a chain. He instituted a radically different hierarchy for a large organization. There were only five echelons between the salesclerk and the CEO. His belief in decentralization was buttressed by the need for employees and managers to grow and learn from their mistakes (Worthy, 1984).
Leaders differ from each other in their focus of attention. Some focus more on the task to be accomplished, others more on the quality of their relations with others (Blank, Weitzel, & Green, 1990), and still others more on change. Bergan (1986) observed leaders concentrating on their group’s working methods or on mutual trust building. Ekvall and Arvonen (1991) added that leaders may also concentrate on making changes. Effective leaders do any of these things, or all three. For instance, when Berkowitz (1953a) asked members of air crews to describe their commander with a behavioral description inventory, a factor analysis of the results revealed factors concerned with both task and relationships, including maintaining standards of performance, acting on an awareness of situational needs, maintaining coordination and teamwork, and behaving in a nurturant manner. The conceptualizations may be universal. Thus Shenkar, Ronen, Shefy, et al. (1998) reported that the Chinese manager’s role could be partly accounted for by attention to task-related and relations-oriented activities.
Task-oriented leaders differ in their concern for their groups’ goals and the means to achieve the goals. They engage more in task roles (Bass, 1967b; Fiedler, 1967a). They are more concerned with production (Blake & Mouton, 1964) and need for achievement (McClelland, 1961; Wofford, 1970). They are identified as achievement oriented (Indvik, 1986b), production oriented (Katz, Maccoby, & Morse, 1950), production-emphasizing (Fleishman, 1957a), goal achieving (Cartwright & Zander, 1960), work facilitative, goal emphasizing (Bowers & Seashore, 1966), performance planning and performance pressuring (Misumi, 1985; Peterson, Smith, & Tayeb, 1993). The leaders’ assumptions about their roles, purposes, and behavior reflect their interest in completing assignments and getting the work done. A high task orientation underlies selected types of leaders, such as Birnbrauer and Tyson’s (1984) hard driver and persuader or Reddin’s (1977) autocrat. Purely task-oriented leaders are likely to keep their distance psychologically from their followers and to be more cold and aloof (Blau & Scott, 1962). When coupled with an inability to trust subordinates, their concern for production is likely to manifest itself in close, controlling supervision (McGregor, 1960). Successful task-oriented leaders are instrumental in contributing to their groups’ effectiveness by setting goals, allocating labor, and enforcing sanctions (Bales, 1958a). They initiate structure for their followers (Hemp-hill, 1950a), define the roles of others, explain what to do and why, establish well-defined patterns of organization and channels of communication, and determine how to accomplish assignments (Hersey & Blanchard, 1981). Chapter 18 provided illustrations of executives—Jack Welch and Lou Gerstner—who were highly task-oriented and less concerned about interpersonal relationships.
Conceptions. Task-oriented leadership can be a source of expert advice and challenging motivation for subordinates. Misumi (1985) conceived of task-oriented leadership behavior as performance leadership—behavior that prompts and motivates the group’s achievement of goals. For example, when deadlines are necessary, the leader clearly specifies them and has a good grasp of how work is progressing. According to Cleveland (1980), such a focus on the task is seen in strategic thinking, in projecting patterns of collective behavior, and in considering the whole situation. It is also seen in the leader’s manifest curiosity about issues and methods and the system that can connect people and things to achieve objectives. Akin and Hopelain (1986) described a “culture of productivity” in three highly productive organizations. Immediate supervision, combined with management as a whole, can foster a shared image of a highly productive work setting in which supervisors, managers, and workers alike focus on the work being done and how to maintain successful operations.
Purposes. Yukl (1994) proposed five purposes of task-oriented leader behavior: (1) to propose an objective, introduce a procedure, present an agenda, and redirect attention to the task; (2) to stimulate communication, seek specific information, or encourage the introduction of new ideas; (3) to clarify communication, reduce confusion, ask for interpretations, and show how different ideas are related; (4) to summarize accomplishments, to review or ask for reviews; and (5) to test for consensus about objectives, interpretations, evaluations, and readiness for decisions.
Caveat. Although the various conceptualizations of task orientation have similar-sounding labels, their inter-correlations are not necessarily high. In fact, they may point to different attributes of an individual. Thus the direct assessment of the task orientation of 81 Polish industrial personnel—using the Orientation Inventory (ORI), which directly asks examinees for their preferred activities—correlated only 32 with the need for achievement as measured by the Thematic Apperception Test, an assessment of the projected fantasies of the same examinees (Dobruszek, 1967). Similarly, Fiedler’s (1967a) determination of task orientation, based on the leaders’ rejection of the coworker with whom they found it most difficult to work, did not correlate as highly with other approaches to measuring task orientation. (In fact, the least preferred coworker, or LPC, measure seems so unlike any other that it will be treated separately in this chapter.) Thus it is necessary to review results in the light of variations that are due to how task orientation and relations orientation are measured.
Concept. Relations-oriented leadership is expressing concern for others, attempting to reduce emotional conflicts, harmonizing relations among others, and regulating participation (Yukl, 1994). Relations-oriented leadership is likely to contribute to the development of followers and to more mature relationships.
Leaders differ in the extent to which they pursue a human relations approach and try to maintain friendly, supportive relations with their followers. They are identified as relations-oriented (Katz, Maccoby, & Morse, 1950), concerned for maintenance (Misumi, 1985) or group maintenance (Cartwright & Zander, 1960; Wof-ford, 1970), concerned for people (Blake & Mouton, 1964), people centered (D. R. Anderson, 1974), interaction facilitative and supportive (Bowers & Seashore, 1966), interaction oriented (Bass, 1967b), employee emphasizing (Fleishman, 1957a), and in need for affiliation (McClelland, 1961). Such leaders are expressive and tend to establish social and emotional ties (Bales, 1958a). Dansereau and Yammarino (2002) have used the term individualized leadership to describe relations among leaders and subordinates that reflect an exchange of leader support for subordinates’ feelings of self-worth and the subordinates’ satisfactory performance. The relationship is revealed in the extent the leaders relate similarly or differently to each of their subordinates in the component of individual differences in WABA analysis. Dasborough and Ashkanasy (2003) suggest that leaders can shape affective events by positive uplifts or negative hassles. The negative hassles are more likely to be recalled by subordinates. Usually associated with a positive relations orientation are the leader’s sense of trust in subordinates, less felt need to control them, and more general rather than close supervision of them (McGregor, 1960).
A strong relations orientation is the basis of Reddin’s (1977) “missionary” and “developer” types of leader. Relations-oriented leadership is associated with consideration for the welfare of subordinates (Hemphill, 1950a). For Hersey and Blanchard (1982a, b), it is linked to relationship behavior: maintaining personal relationships, opening channels of communication, and delegating to give subordinates opportunities to use their potential. It is characterized by involved support, friendship, and mutual trust. It is leadership that is likely to be more democratic and employee-oriented rather than autocratic and production-oriented. Misumi (1985, p. 11) saw it as maintenance-oriented leadership behavior “directed toward dispelling excessive tensions that arise in interpersonal relations within a group or organization, promoting the resolution of conflict and strife, giving encouragement and support, providing an opportunity for minority opinions to be expressed, inspiring personal need fulfillment and promoting an acceptance of interdependence among group members.”
Relations-oriented supervision is seen in the communication patterns of supervisors and subordinates. Kirmeyer and Lin (1987) arranged for observers to record an average of 107 face-to-face interactions with the supervisors of 60 randomly chosen police radio dispatchers. Communications with the dispatchers’ supervisors were facilitated if the dispatchers felt they were receiving social support from their superiors. Felt support correlated 33 with the dispatchers’ communications about work to their superior and .48 with communications to their superiors about other matters. It correlated .55 and .26 with observed face-to-face communications from the superiors to the dispatchers about work and nonwork matters.
Quality of Relations. Kottke and Sharafinski (1988) and Hutchison (1997) defined the quality of the relations of employees with their immediate supervisor according to how much the employees felt that their supervisors supported and cared about them. It was correlated with the quality of leader-member exchange (LMX) but could be distinguished from LMX, and from perceived organizational support. However, a Belgian-French study of 293 university alumni respondents found a correlation of .55 between perceived supervisory and perceived organizational support (Stinglhamber & Vandenberghe, 2001). A similar positive correlation was found between enacted supervisory and environmental support by Slack, Etchegary, Jones, et al. (2002). A high quality of relations might be found in self-sacrificing leadership (Choi & Mai-Dalton, 1999).
Organizational Systems. The concern for relations is manifest in different ways with different organizational systems. Such concern and effort are involved in shifting organizations from autocratic systems 1 and 2 to democratic systems 3 and 4 (Likert, 1977b) and in contributing to industrial democracy and participative management.1 The concern for relations is central to humanistic management (Daley, 1986), which is dedicated to promoting the personal significance of work, the autonomy of employees, and fairness in appraisals. In Taiwan, it is seen as a matter of doing favors. It is seen in Britain with Theory P, a deemphasis of traditional management-employee relationships in favor of management’s increased awareness of employees’ needs, increased involvement in the community, and increased use of consultation (Jaap, 1982). It is seen in Japanese management and Theory Z, with its emphasis on long-term employment, unhurried evaluation and promotion processes, wide-ranging career opportunities, and consensual decision making. Theory Z leadership beliefs represent a mix of task direction and relations orientation; generating commitment, loyalty, and involvement in the organization; and treating followers as members of a family (Ouchi, 1981).
Examples: Relations-Oriented Executives. Herb Kelleher was credited by Wall Street analysts as the major reason for Southwest’s continuing profitability after the first two years of business. Southwest often generated larger earnings than any of its competitors, which as of 2005 had registered increasing losses or gone bankrupt. Kelleher was a cofounder of the airline in 1971 and introduced low-priced, frequent point-to-point service instead of the hub-and-spoke service of the major airlines. He used a fleet of one type of aircraft, the Boeing 737, instead of the many types found among his competitors. His cost per available seat mile, employees per aircraft, and employees per passenger were as low as 50% to 75% of his competitors’. But he also ensured employees’ and customers’ satisfaction. In addition to providing employees with 15% of the net profits and matching up to 100% of individual employee contributions to their 401(k) retirement plans, his unusually good labor-management relations and his unusually friendly personality resulted in strong loyalty to the company. Employees were willing to do whatever was needed. (I was surprised, at a stop on my first trip on Southwest, to see the flight attendants cleaning up the aircraft cabin.) Pilots might help out as ticket agents, and ticket agents as baggage carriers. Individualized consideration, kindness, and spirit were nurtured. Recruits were selected for their sense of humor. “Employees are our most important resource” may be a cliché, but it is a major principle at Southwest. Kelleher is like the very funny father of a family and the center of formal and informal festivities (Labich, 1994).
Ben Cohen and Jerry Greenfield, founders of successful Ben and Jerry’s, were extremely egalitarian and focused on the human side of the enterprise, with a strong sense of social responsibility. Before selling their homemade ice cream company, they ran it like a human service agency. They practiced walk-around management and had fun with their employees and at their annual meetings. They formed a committee to put more joy into employees’ work and decrease stress. They created an organizational culture of charity, goodwill, and respect for the community and kept their top salaries to five times the lowest employee base pay (Levine, 1988; Severance, 1988).
Other CEOs have showed that they cared about their employees in a variety of ways. Jack Stack of Springfield ReManufacturing emphasized teaching employees the financial aspects of the business. Patricia Gallup of PC Connection nurtured her more than 800 employees and interacted directly with them by e-mail. Mary Kay Ash of Mary Kay, Inc. felt she had compassion for her people and viewed them as more important than the bottom line.
Blake and Mouton (1964), Cleveland (1980), and many others have strongly advocated leadership that integrates both task orientation and relations orientation. Leaders have to be strong and decisive, yet sensitive to people (Calloway, 1985). Blake and Mouton (1964) argued that maximum leadership effectiveness occurs only when the leader is highly concerned for both production and for people and integrates the human and task requirements of the job. The exclusively task-oriented manager is seen to treat employees as machines, to the detriment of their commitment, growth, and morale. The exclusively people-oriented manager is viewed as running a “country club,” to the detriment of productivity.2
Leaders exhibit both task and relations orientation. Kaiser and Kaplan (2001) reported that although 46% of managers they sampled in their consulting work were highly task oriented and 19% were highly relations oriented, 6% were versatile in that they displayed just the right amount of both task and relations orientation. The remaining 30% were disengaged (laissez-faire). Further complicating matters are the “switch-hitters.” The autocratic leader is likely to be directive and caught up with getting the work done and the democratic leader is likely to be participative and concerned about maintaining relationships; nevertheless, some benevolent autocrats, who pursue a patronizing leadership style, are still likely to be concerned about their relationships and the needs of their followers. Likewise, highly task-oriented democratic leaders may encourage participation in decision making for the sake of reaching high-quality decisions. Presumably, they would be characterized as R. Likert’s (1977b) System 4 leaders.
Given the increased efforts required to keep up with rapid technological, societal, and market changes, Mintzberg and James (1985) suggested that leaders needed to have an “umbrella” strategy, concerned with getting new ideas accepted and implemented. Morgan (1986) proposed that it was important to focus on challenging constraints. Ekvall (1988) in Sweden and Lindell (1989) in Finland revealed an orientation toward change that they found factorially independent of task and relations orientation (Ekvall & Arvonen, 1989). The change-oriented leader was interested in innovation, creativity, new ways to accomplish old tasks, and new ways to relate to others. The change-oriented leader engaged in Argyris’s (1982) double-loop learning and attention to feedback. In a Swedish factor study of 502 respondents in four manufacturing and five service firms, Lindell and Rosenqvist (un-dated) were able to confirm a three-factor model for 502 respondents to a 36-item questionnaire about their superiors’ behavior and orientation to task, relations, and change. In a sample of 711 mainly middle managers attending management training centers in Sweden, Finland, and the United States who each described their boss, Ekvall and Arvonen (1991) extracted three ortho-gonal factors: change-centered, employee-centered, and production-centered. (Nationality was inconsequential.) The change-centered boss was rated as a promoter of change and growth (pushes for growth; initiates new projects), had a creative attitude (saw possibilities rather than problems, offered ideas, encouraged thinking about new and creative ways and tried them), was a risk taker and was particularly willing to take risks in decisions, made quick decisions when necessary, and was visionary—engendering thoughts and plans about the future.
Relationship of Change Orientation to Concern for Task and Relation. As noted earlier, leaders may emphasize both task and relationships or neither. Observers can accurately discriminate among the ratings for emerging task and socioemotional leadership earned by interacting members of experimental task groups (Stein, Geis, & Damarin, 1973). Hermigar and Taylor (1980) found that the assessed receptivity to change of 80 middle-management administrators of public schools was high if the administrators were either highly concerned for people or highly concerned for productivity. But a lack of concern for either was connected with a lack of openness to change. Experience in leading change affected orientation. Tullett (1995) noted that 133 managers in charge of change projects in Britain were more likely to be innovative in their score on the Kirton Adaptation-Innovation Inventory than managers in general.
As with the tendencies toward and preferences for direction or participation, task, relations, and change orientation tend to depend on the leader’s personal characteristics as well as situational contingencies. These contingencies include the characteristics of the follower, the organization, the task, the goals, and the constraints.
Along with Bales (1958a) and Etzioni (1965), Downton (1973) surmised that instrumental (task-oriented) and expressive (relations-oriented) modes of leadership are assumed by individuals with different temperaments. Instrumental leaders are seen to be more aggressive, more able to tolerate hostility, and more anxious to be respected. Expressive leaders are more accommodating, less able to tolerate hostility, and more anxious to be loved. A variety of surveys and experiments demonstrated this linkage of personality to leadership orientation. For instance, Klebanoff (1976) used observers’ and peers’ rankings of the task-or relations-oriented behavior displayed by 160 participants in 40 small groups working on various tasks. Task-oriented leaders were more likely to have been firstborn children; they felt more personal autonomy and tended to be more actively involved. Menon (2003) found that among 370 managers, those who were more task-focused, goal-oriented, and persistent despite difficulties or distractions were more satisfied with their jobs. Task-focused students were more conscientious and emotionally stable and less hesitant and preoccupied. Konovsky (1986) analyzed the extent to which supervisors of 484 hospital subordinates were seen by their subordinates as providing emotional support and as helping to solve the subordinates’ problems. Supervisors offering such support and assistance also scored higher in personal competence, sociability, emotionality, and altruism.
Helmich and Erzen (1975) surveyed 108 corporation presidents and found that task-oriented leaders lacked fulfillment as presidents. The needs of relations-oriented presidents were better met by their assignment. According to a study of 194 employees in a human service organization, persistence at tasks was greater if the employees perceived themselves to be self-efficacious (Seltzer & Miller, 1990). Bolino, Turnley, and Bloodgood (2002) argued that employees’ favorable attitudes toward organizational citizenship provided organizations with social capital that contributed to better relationships and better performance.
The Orientation Inventory (ORI). Preferences of highly task-oriented examinees on the ORI (Bass, 1962c) included to be wise; to have the feeling of a job well done; to have bright, interesting friends; and to be a leader who gets things done. For interaction-oriented (relations-oriented) examinees, preferences included to have fun with friends, to have helpful friends, to work cooperatively, to make more friends, and to be a leader who was easy to talk to. According to scores on various personality inventories, personal factors significantly correlated with task orientation, as assessed by the ORI, included being more highly self-sufficient, resourceful, controlled in willpower, aloof, not sociable, sober-serious, tough-realistic, and aggressive-competitive (Bass & Dunteman, 1963). Task-oriented leaders were more likely to show more restraint, ascendance, masculinity, objectivity, thoughtfulness, endurance, need for achievement, and heterosexuality (Bass, 1967b).
Task orientation as assessed by the ORI was higher among men than among women and among those with greater maturity, education, status, and technical training. Task-oriented students were more likely to volunteer and to persist at tasks voluntarily until the tasks were completed (Frye & Spruill, 1965). They were self-reinforcers (Marston, 1964) and more likely to be seen as helpful to others in sensitivity training groups (Bass & Dunteman, 1963). In a Polish study, task orientation on the ORI was found to correlate positively as high as .41 with intelligence, as measured by a Polish version of the Army General Classification Test. Interaction (relations) orientation correlated negatively as low as –.32 with tested intelligence (Dobruszek, 1967). Relations orientation was higher among examinees who, according to various personality inventories, were warm, sociable, in need of affiliation, and dependent on the group (Bass & Dunteman, 1963). Relations orientation was also correlated with wanting to be controlled by others, to be close to others, to receive affection from others, to include others, and to be included with others (Bass, 1967b).
Immutable Conditions? These personal factors, seldom mentioned in the prescriptive literature of the past two decades, call attention to Fiedler’s (1967a) argument that one often needs to find or change the situations to fit the leader’s personality. These personal factors make managers and administrators skeptical about the possibilities of training and developing leaders to be both relations and task oriented and about those who say they already are. Nevertheless, the correlations of task and relations orientation with personality and intelligence are modest. Much can be changed in leadership orientation and behavior through learning, role modeling, and experience, reinforced by socialization processes and organizational culture.3
Leaders will be more concerned about the task when their superiors want them to remain focused on it. Managers who are under the gun to produce immediate results are more likely to be task oriented and less likely to devote time and energy to their relationships. Brady and Helmich (1982) found, in a survey of chief executive officers (CEOs) and their boards of directors, that the CEOs were more task oriented than relations oriented if their boards were made up of outsiders. The reverse was true if the boards were composed of insiders. Relations-oriented leaders are likely to emerge when leaders are more attentive to pleasing their followers than their superiors and, by definition, when they are more concerned about the needs of their followers.
In utilitarian hierarchies, organizational level makes a difference in orientation. For 6,434 subordinates in 13 countries describing their superiors, change orientation was most prevalent at the top and production orienta-tion was most common at the bottom; relations orientation was about the same at both echelons (Arvonen, 1992). Nevertheless, senior managers seriously underestimate how much they are distrusted by lower-level employees (Howard & Wellins, 1994). Relations orientation is to be expected in communal organizations, such as the Israeli kibbutzim, whose espoused beliefs emphasize providing for members according to their needs. Socioeconomic differences between communities of workers are also likely to be of consequence. Thus Blood and Hulin (1967) reported that workers in communities in which one would expect adherence to middle-class norms (for example, small suburban communities) tended to favor a human relations style of supervision. Strong organizational policies supporting either a relations or a task orientation (or both) particularly coincide with a top management that provides role models for lower management and engenders task, relations, or change orientations among the individual managers and supervisors. Also, the leaders’ orientation is likely to be affected by those below them.
Subordinates and Their Performance. Earlier chapters noted that poor performance by subordinates appears to cause much of the observed punitiveness of leaders. But good performance by subordinates appears to increase leaders’ tendency to be relations oriented. In a study of routine clerical workers and their supervisors at a life insurance company, Katz, Maccoby, and Morse (1950) found that supervisors of high-producing sections were significantly more likely to be employee oriented than production-oriented. Barrow (1975) showed that increasing the performance of subordinates in a laboratory setting resulted in the leader becoming significantly more supportive. Decreasing the subordinates’ performance caused the leader to become more task-oriented. This finding is consistent with Bass, Binder, and Breed’s (1967) findings about the performance of a simulated organization (discussed below).
Farris and Lim (1969) showed that if the performance of groups was good in the past, the groups’ leaders subsequently tended to be more relations-oriented. The leaders were more sensitive to the needs and feelings of the members and had more trust and confidence in the members. These leaders allowed members more freedom and autonomy in their work. Members were encouraged to speak out and were listened to with respect. The leaders gave recognition for good work, communicated clearly, stressed pride in the group, and emphasized teamwork. The leaders of high-performing groups were also more task oriented than were the leaders of low-performing groups, in that they maintained high performance standards without being punitive. They were less likely than the leaders of low-performing groups to be critical of their groups’ performance and less likely to exert unreasonable pressure for better performance.
Jones, James, and Bruni (1975) could not separate cause and effect in a study of 112 engineering employees. But the results suggest the followers’ influence on their leader’s orientation and behavior, although the reverse possibility is also tenable.4 Jones, James, and Bruni obtained correlations of from .41 to .55 between employees’ confidence and trust in their supervisors and the extent to which their supervisors were seen as high in support, emphasis on goals, facilitation of work, and facilitation of interaction. As was noted in Chapter 7, Sanford (1951) found, in a survey of Philadelphia residents, that egalitarians wanted leaders who were warm and generally supportive, but authoritarians preferred leaders who would serve their special interests. Indirectly, one may infer that more relations-oriented leadership would be demanded by highly self-oriented followers, by followers with personal problems, by followers in need of nurturance, and by followers seeking affection. As will be detailed later, the “psychological and job maturity” of subordinates dominates the Hersey-Blanchard (1977, 1981) prescriptions for determining whether leaders should be relations or task oriented or both in their behavior toward subordinates.
Prior Effectiveness of the Organization. Commonly observed as well as deplored (see, for instance, R. Likert, 1977b) is the extent to which human relations concerns are abandoned when an enterprise’s profits are seriously eroded. In such situations, akin to a stress response, task orientation is increased at the expense of relations orientation. Bass, Binder, and Breed (1967) demonstrated this phenomenon in a simulated budgeting exercise. The concern of decision makers for the satisfaction and well-being of employees and their willingness to accept more employee-centered solutions to problems in the areas of safety, labor relations, and management development were strongly influenced by whether the company had just finished a profitable year. In this exercise, MBA students were given one of three firms’ year-end profit-and-loss statements. One firm showed a net loss of $86,000; the second firm’s statement showed that moderate profits had been earned; the third firm reported large profits. Three-quarters of the students in the profitable circumstances recommended buying safety equipment. Only half of the students in the moderately profitable enterprise and only 25% of those in the firm that lost money were willing to spend the required funds to settle a strike quickly. The goals emphasized in the most profitable situation were the welfare, goodwill, and satisfactory operations of employees. The goals stressed in the firm that had experienced a loss were meeting competition and raising profits.
Three kinds of evidence are available: (1) the extent to which relations-oriented and task-oriented leaders are seen to be more or less meritorious by others; (2) the differential impact of these orientations on the satisfaction of subordinates; and (3) the differential effects of these orientations on the performance of groups. Care must be maintained about the validity of the evidence. Consistently, one sees managers who describe themselves as both more task oriented and more relations oriented than their subordinates perceive them to be (see, for example, Rees & O’Karma, 1980).
Reports on correlations of evaluations as a leader and relations or task orientation have generally found both orientations to be of positive importance. Followers’ values affected the extent to which they favored leaders of one kind or another. Ehrhart and Klein (2001) reported that employees who were more interested in extrinsic rewards for performance favored more relations-oriented supervisors whereas employees who preferred more structure and security in their work favored more task-oriented supervisors. Mathieu (1990) found that among 298 ROTC cadets, those high in need for achievement preferred instrumental (task-oriented) leadership; those low in need for achievement preferred relations-oriented leadership.
Relations Orientation. Shartle (1934) used interviews and questionnaires in a comparative study of supervisors who were rated as either effective or ineffective. Effective supervisors did not differ from their ineffective peers in technical skills, but they were found to excel in their ability to interact effectively and in their interest in people. Similarly, Katzell, Barrett, Vann, and Hogan (1968) found that executives whose roles emphasized administrative, rather than technical, performance received higher performance ratings from their superiors.
Mann and Dent (1954b) studied supervisors who were rated for promotability by higher-level managers. Highly promotable supervisors were described by their employees as being good at handling people; approachable; willing to go to bat for employees; letting the employees know where they stand; pulling for both the company and the workers, rather than just for one or the other; and using general, rather than close, supervision. In turn, the highly promotable supervisors saw their own superiors as being good at handling people, letting the supervisors know where they stood, and permitting the supervisors the freedom to make decisions.
H. H. Meyer (1951) observed that effective supervisors regarded others as individuals with motives, feelings, and goals of their own and did not avoid interactional stress. Similarly, Kay and Meyer (1962), using both questionnaire and observational methods, found that higher-rated foremen were less production oriented and gave general, rather than close, supervision. Likewise, Walker, Guest, and Turner (1956) observed that effective supervisors established personal relationships with employees, stuck up for them, and absorbed pressure from higher levels of authority. A. N. Turner (1954) reported that workers regarded supervisors as good if the supervisors did not pressure their subordinates unnecessarily; were fair, friendly, and understanding; and did not tell subordinates to quit if they did not like the conditions.
Among the 17 Americans on the 1963 Mount Everest expedition, all of whom were highly task oriented, those who were most interaction oriented and highest on FIRO-B (Fundamental Interpersonal Relations Orientation-Behavior) expressed inclusion were rated highest in leadership. Lester (1965, p. 45) noted,
The results pointed to the importance … of being emotionally responsive, affectionate and warm, inviting in manner, or placing primary value on the emotional give-and-take in face-to-face relations. The men reacted negatively to emotional constriction, to too much emphasis on method, efficiency, productivity, and the imposition of high impersonal standards.
However, when interaction-orientation scores are high at the expense of task-orientation scores—as when ipsative scoring5 is used—task orientation, rather than interaction or relations orientation, is likely to correlate with merit as a leader.
Task Orientation. Rubenowitz (1962) reported that job-oriented supervisors were regarded by higher management as more effective than person-oriented supervisors. Shortly afterward, Kelly (1964) found that the technical features of executives’ behavior outweighed the effects of personal style.
According to Dunteman (1966), task orientation, as measured by the ORI, correlated with promotability ratings based on three days of assessment of 96 supervisors (but correlations were negative among the younger, temporary supervisors and the journeymen who were so assessed). For both 66 first-level and 27 second-level supervisors, task orientation significantly contributed to their high on-the-job performance ratings by their supervisors (Dunteman & Bass, 1963). Rutherford (1984) reviewed studies of the success of elementary school principals. In attempts to implement new programs or to improve the schools, the successful principals appeared highly task-oriented. They made strong instructional efforts; set clear, high expectations for teachers and students; and monitored performance. They actively intervened when intervention was needed. The successful principals also paid attention to relationships, remaining in close contact with the teachers.
Many other studies, enumerated in Chapter 27, have found that leaders who are concerned about the task in situations in which such a concern is relevant are likely to be evaluated highly by others. Furthermore, the plethora of studies of the need for achievement6 provide additional evidence of the positive association of task orientation and success as a leader.
Supervisors’ attention to relationships was seen early in several investigations focused on the impact on subordinates’ satisfaction of psychological and social closeness or distance, a component of relations orientation. Julian (1964) found that job satisfaction was higher when there was psychological closeness between the leader and the led. However, Blau and Scott (1962) and E. R. Shaw (1965) reported that the cohesiveness of the group was strengthened by the social distance between the leader and the followers, and Sample and Wilson (1965) found cohesiveness to be unrelated to social distance. Still, the majority of reports from both field studies and laboratory experiments have indicated that subordinates’ satisfaction with their leaders was linked to the leaders’ relations-oriented attitudes and behavior. Particularly important for follower satisfaction, performance, and willingness to follow the leader is the extent to which the leader evinces support for the followers’ feelings of self-worth (Dansereau, Yammarino, Markham, et al., 1995). A supportive change-oriented supervisory attitude also lies behind subordinates’ efforts to innovate (Delbecq & Mills, 1985) and to be creative (Langley & Jones, 1988).
Field Studies. Hoppock’s (1935) analysis of the early literature on job satisfaction indicated that workers tended to feel more satisfied when supervisors understood their problems and helped them as needed. In a survey of more than 10,000 managerial, supervisory, and hourly personnel, Ronan (1970) obtained similar results, as did Roberts, Blankenship, and Miles (1968). Stagner, Flebbe, and Wood (1952) found that railroad workers were better satisfied when their supervisors were good at handling grievances and communicating with employees. Likewise, Bose (1955) observed that workers under employee-centered supervisors had more pride in their groups than those under work-centered supervisors. Mann and Hoffman (1960) found that in two plants—one automated, the other not—employees were more satisfied with supervisors who were considerate of their feelings, recognized good work, were reasonable in their expectations, and stood up for the subordinates.
Stampolis (1958) showed that the more employees rated their supervisor as fair, able to handle people, giving credit, ready to discuss problems, and keeping employees informed, the less the employees expressed a desire for their company to be unionized. Bass and Mitchell (1976) reported similar results for professional and scientific workers. The United Auto Workers had difficulty organizing the highly relations-oriented Japanese-owned automobile plants in the United States (Gladstone, 1989).
Wager (1965) found that a supportive style of leadership assisted the supervisor in fulfilling and satisfying the employees’ role expectations. In an aircraft factory, where team leaders devoted much of their time to facilitating the work of the teams and attending to the members’ personal problems, indicators of dissatisfaction, such as absenteeism and turnover, were lower (Mayo & Lombard, 1944).
York and Hastings (1985–1986) asked 172 employees working in North Carolina social services to complete the Survey of Organizations (D. G. Bowers, 1976). At all levels of the assessed maturity of workers, facilitative and supportive performance of supervisors was associated with the subordinates’ satisfaction and motivation to work. A review of nursing studies by Maloney (1979) concluded that people-oriented leaders generally were more satisfying to their employees. In addition, employees’ grievances and turnover were lower when the leaders were seen as relations oriented.
When the socioemotional and task-oriented leadership of residence hall leaders were measured separately by MacDonald (1969), both were linked to the satisfaction of students. However, the effects of task orientation on subordinates’ satisfaction have usually been found to be somewhat less consistent. Task-relevant behavioral measures, which contain elements of the leaders’ punitiveness, will generate dissatisfaction, grievances, and turnover (Schriesheim & Kerr, 1974). In a survey of several thousand employees, R. Likert (1955) found that job satisfaction decreased as the supervisors’ pressure for production increased. However, it is not uncommon to find positive correlations for both the task-and relations-oriented behavior of supervisors and the satisfaction of their subordinates. Generally, for nurse supervisors, for example, a strong task orientation that is not coupled with a high relations orientation results in less satisfied subordinates (Maloney, 1979). Gruenfeld and Kassum (1973) showed that nurses were satisfied with highly task-oriented supervisors, but only if the supervisors’ people orientation was high as well. The strong task orientation of supervisors was dissatisfying when coupled with a medium or low orientation to people. But Arvonen (1995) found, in Swedish forest-product manufacturing, that supervisor task orientation—as revealed in their structuring, clarification, and ordering of work—did not produce dissatisfaction among blue-collar employees, as it did among white-collar employees and managers.
In a very large undertaking of over two decades, Misumi (1985) conducted studies of over 150,000 Japanese employees working in banks, post offices, coal mines, shipyards, transportation, utilities, and manufacturing, under supervisors with different performance (P) and maintenance (M) orientations. The supervisors were classified as P-type (above the median in performance alone), M-type (above the median in maintenance alone), neither type (pm), or both types (PM). The subordinates of a PM supervisor had a more favorable attitude toward their supervisor than did the subordinates of an M-type or P-type supervisor. The least satisfying supervisors were those who were pm types. In a bank that had branches in Okinawa, Misumi and Mannari (1982) surveyed an average of 1,325 subordinates who described their 303 superiors’ leadership. The P and M leadership orientations of the supervisors, as well as the subordinates’ morale (interest in work and satisfaction with supervision), were collected five times at 15-month intervals. The supervisors were changed in 287 groups but not in 159 groups. There was less change in morale from interval to interval if the supervisor did not change. However, the morale of the subordinates rose if the P and M leadership orientation of the supervisor’s successor was higher than that of the former supervisor. The previous morale of the subordinates had less of an effect on the incoming supervisor’s leadership than vice versa.
Along with relations and task orientation (r = –.33), change orientation also appears to contribute to satisfaction. Arvonen (1995) collected survey data from 781 employees in two production plants of a Swedish forest-products firm. Dissatisfaction and lack of well-being were less if supervisors were structure-oriented (r = –.27), relations-oriented (r = –.33), and change-oriented (r = –.25).
Laboratory Experiments. Experiments may provide additional convincing evidence of the relationship between a leader’s relations orientation and subordinates’ satisfaction. As with the field studies, most experimental studies have concluded that satisfaction of subordinates was positively associated with the leader’s relations-oriented behavior. Wischmeier (1955) found that group-centered, rather than task-centered, discussions resulted in a warm, friendly group atmosphere. T. Gordon (1955) found that group-centered discussion was associated with members’ sense of belonging, respect for others, ability to listen to and understand others, and loss of self-defensiveness. Similarly, Thelen and Whitehall (1949) and Schwartz and Cekoski (1960) reported that follower-oriented leadership enhanced satisfaction. Maier and Danielson (1956) reported that an employee-oriented solution to a disciplinary problem produced greater satisfaction in groups of problem solvers than a solution bound by legalistic restrictions.
Heyns (1948) coached one set of leaders to play a positive, supportive role that emphasized agreement, mutual liking, and cooperation. Leaders in another set were coached to play a negative role in which they overtly displayed a misunderstanding of the members and made no effort to develop their groups’ cohesiveness. Although the two styles produced no significant difference in the quality of the groups’ decision or the members’ satisfaction, the groups with positive leaders exhibited evidence of greater cohesiveness. W. M. Fox (1954) used scenarios to coach leaders in a positive relations approach or a “biased, diplomatic, persuasive” role. Groups with positively supportive leaders exhibited higher degrees of cohesiveness and members’ satisfaction but were slower in solving problems. With a different group of participants, W. M. Fox (1957) also found that supportive leadership was associated with the members’ satisfaction and the groups’ cohesiveness.
Zaleznik (1997) lamented the extent that attention to the task has suffered from too much concern for relationships. He attributed this to the increased complexity of the organization, in which managers and executives have to play many roles; and to the success of the human relations movement. This movement emphasized the need for cooperation and workplace harmony and had “an unhealthy preoccupation with process at the expense of productivity” (p. 7). The substantive hard work of business was displaced by psychopolitics; by “smoothing over conflict, greasing the wheels of human interaction” (p. 7); and by driving out the necessary “real” work of cutting costs and creating products. However, generally, we shall see that effectiveness is greatest when leaders attend to both task and relationships.
It may be difficult to separate the impact of the leader’s orientation on the members’ satisfaction from its impact on the members’ and the group’s effectiveness. For example, Medalia and Miller (1955) observed that human relations leadership and employees’ satisfaction interact to influence the group’s effectiveness. And although a leader’s relations orientation and task orientation are both generally found to be positively associated with the group’s productivity, the group’s attainment of goals, and followers’ performance, there are exceptions. Some situations may call for more relations-oriented leadership and others for more task-oriented leadership. However, it may be that in a vast majority of circumstances, strong doses of both types of leadership orientation are optimal.
When positive associations are found, it is usually inferred that the relations orientation or task orientation of the leader resulted in the improved performance of subordinates. But the reverse may be equally true. Few of the findings have been causal. That is, the previous performance of subordinates is as likely to affect the orientation of the leader as the leader’s orientation is likely to influence the subsequent performance of the subordinates (Bass, 1965c). Farris and Lim (1969), as was previously mentioned, showed that the past good or poor performance of groups determined, to a considerable degree, the task and relations orientation of their leaders.
Relations-Oriented Leadership and Follower Performance. Pandey (1976) reported that groups with relations-oriented leaders generated more ideas than groups with task-oriented leaders. Katz, Maccoby, and Morse (1950) and Roberts, Miles, and Blankenship (1968) found that the performance of groups was higher under an employee-oriented style than under a more disinterested style of supervision. Philipsen (1965a, 1965b) also found that human relations leadership correlated positively with group effectiveness. But in a study of skilled tradesmen, Wison, Beem, and Comrey (1953) established that supervisors of both high-and low-performing shops were described as more helpful, sympathetic, consistent, and self-reliant than were those in medium-performing shops. Slack, Etchegaray, Jones, et al. (2002) reported that supervisory-espoused support was linked to enacted support. Enacted supervisory support was linked to employee performance because the employees perceived a supportive environment. Bliese, Bienvenu, Castro, et al. (2002) found that a supportive leadership climate played an important role in determining whether the stress of the work overload of soldiers on assignment in Kosovo could be buffered by job control.
Abdel-Halim (1982) showed how much of subordinates’ role conflict and role ambiguity—which affected their intrinsic satisfaction with, involvement in, and anxiety about their jobs—were moderated by the support they received from their supervisor. In the report by Konovsky (1986), supervisors who were judged by their 484 subordinates as helpful and emotionally supportive contributed to the subordinates’ commitment to their hospital organization and to the supervisors’ judged interpersonal effectiveness. Riegel (1955) found that employees’ interest in their company’s success increased when their supervisor was seen to help them with their difficulties, to give necessary training and explanations, and to “take an interest in us and our ideas.”
Indik, Georgopoulos, and Seashore (1961) studied the employees of a transportation company. Their results indicated that high levels of group performance were associated with satisfaction with the supervisors’ supportiveness, open communication, mutual understanding, and workers’ autonomy on the job. As documented in Chapter 17, R. Likert (1967a, 1967, 1977b) concluded, from many surveys, that supportive attitudes toward employees, combined with the group’s loyalty toward management, were associated with increased productivity and a desire for responsibility by the employees. With the introduction of a human relations approach to management, as well as high performance goals, long-term gains in productivity were achieved. Similarly, Daley (1986) surveyed 340 employees of Iowa public agencies and obtained uniformly positive associations between their perceptions of relations-oriented, humanistic management practices and their evaluations of the effectiveness and responsiveness of their organizations to the public. Stinglhamber and Vandenberghe (2001) obtained correlations of .44 and .38 between perceived supervisory supportive relations and employee satisfaction with job conditions.
Supportive leadership increases the likelihood that organizations can police and correct themselves. Near and Miceli (1986) found that the felt support from their leaders was the most important factor in protecting employees from retaliation for calling attention to observed wrongdoing. Conversely, in a random sample of 8,600 federal employees the perceived likelihood of retaliation for whistle-blowing correlated with the lack of support from their supervisors and higher management. This perception was realistic. Honest whistle-blowers were actually more likely to be punished than their corrupt senior managers in the Department of Housing and Urban Development under Samuel Pierce from 1981 to 1988.
Ramus and Steger (2000) surveyed 353 employees in 12 countries in large environmentally-proactive companies with headquarters in Europe. The survey disclosed that employees who perceived management support were willing to promote self-described environmental initiatives. Without such perceived support, they were unlikely to do so.
Deluga (1988) noted that faculty members in a school of higher education, when negotiating a second time, reduced their bargaining and use of authority as influence strategies if the leadership was perceived as relations-centered.
Correlations of Task-Oriented Leadership with Performance. In contrast to the above in Deluga’s study of influence strategies, faculty member bargaining, assertiveness, coalition formation, and reference to higher authority emerged if the leadership was perceived as task centered. R. Likert (1955) reported that a survey of several thousand workers indicated a tendency for productivity to be higher in the presence of higher pressure by supervisors for production. Similarly, Litwin (1968) noted that experimental groups whose leaders had a strong need for achievement were much more productive than groups whose leaders had a great need for affiliation or power. Dunteman and Bass (1963) studied foremen who had an interaction orientation or a task orientation. Groups who worked under task-oriented leaders were more productive than those under interaction-oriented leaders. Mann, Indik, and Vroom (1963) showed that the productivity of workers was associated with the supervisor’s task orientation. R. Cooper (1966) also reported that first-level supervisors whose bosses judged them to be higher in “task relevance” tended to have more productive and more task-motivated subordinates.
For 14 U.S. Navy airplane-maintenance groups, R. Likert (1977a) reported a strong association between the extent to which supervisors facilitated the work by helping with advanced scheduling and offering new ideas to solve problems in the job, and the extent to which airplanes serviced by the groups were not involved in accidents or disasters because of operational failures.
Effects of Change/Development Orientation. Lin-dell and Rosenqvist (undated) reported results for change and development styles for 502 Swedish cases from four manufacturing and five service companies. Management change correlated .67 with managerial competence, .73 with comfort with the manager, and .17 with comfort with the employees’ own tasks. The comparable correlations for managerial development were .67, .53, and .24. For task orientation, the correlations were .59, .52, and .26. LaPolice and Costanza (undated) found that a three-factor model, which included change-related leadership along with task and relations orientation, was the best predictor of the behavior of 16,795 employees from 16 government agencies Analyses were based on the Office of Personnel Management’s Organizational Assessment Survey.
Effects of a Combined Task and Relations Orientation. There is considerable theoretical and empirical support for the idea that regardless of circumstances, the effectiveness of leadership is greatest when the leaders are both task oriented and relations oriented in attitudes and behavior. Thus Patchen (1962) reported that the leader who maintained high performance norms, encouraged efficiency, and attempted to obtain rewards for followers was likely to have a high-performing group. However, the maintenance of high performance standards alone and attempting to obtain rewards for followers alone each had a negative effect on productivity. These two patterns of behavior had to be combined to have a positive impact on productivity.
Numerous other studies and lines of investigation have supported the utility of a combined high task-and relations-oriented approach to leadership. Tjosvold (1984b) demonstrated, in an experiment with 56 college students, that the students were most productive in completing a subsequent task if they had experienced beforehand a leader who nonverbally conveyed warmth and who was directive about what was to be done. The experience of the warm leader, along with the absence of direction, was satisfying but was least conducive to subsequent productivity. Similarly, Klimoski and Hayes (1980) found that the effort, performance, and satisfaction of 241 assistants in the production department of a large information-processing firm were enhanced if the supervising editors were task centered in being explicit in their expectations and consistent in their demands, as well as supportive of their employees. Daniel (1985) found that subordinates perceived that they were working in a more productive organization if their managers were concerned both about tasks and about people. Hall and Donnell (1979) conducted a survey study of 2,024 subordinates who described their managers’ attention to the demands of the task and concern for the quality of manager-subordinate relationships. The managers who were high in both earned high “career achievement quotients.” (The quotient reflected the speed with which they had climbed their organizational ladder.) They were also the most collaborative in their leadership style. These results were consistent with findings by Blake and Mouton (1964) and J. Hall (1976) for large samples. The moderately successful managers had a low relations orientation but a high task orientation, while those whose career success was lowest were low in both task and relations orientation.
Erez and Kanfer (1983) argued that the relations orientation implied in allowing subjects to participate in goal setting enhanced the task-oriented impetus for more goal setting than did assigning goals to subjects without permitting them to participate in setting the goals. Erez, Earley, and Hulin (1985) obtained experimental evidence to show that such participation increased acceptance of the goals and hence increased productivity. However, Erez (1986) found that the organizational culture from which the participants were drawn affected the need for such participation: subjects from the Israeli private sector did better with assigned goals; subjects from the kibbutz sector did better with group participation in setting goals.
As described earlier in discussing the utility of participation, Locke, Latham, and Erez’s (1987) critical experiment tried to understand why, in their respective investigative efforts and using the same standardized experimental conditions, assigning goals to subjects generated more productivity in the United States (Latham & Steele, 1983), while allowing the subjects to participate in goal setting generated more productivity in Israel (Erez & Arad, 1986). The one difference that turned out to account for the highly significant difference in productivity was that the Israeli experimenter was curt and unsupportive in giving instructions, but the U.S. experimenter was friendly and supportive. The friendly, supportive experimenter’s instructions facilitated the subjects’ acceptance of the assigned goal without their having participated in setting it.
Misumi (1985), and Misumi and Peterson (1985), consistently found, in the previously mentioned studies of 150,000 Japanese employees in business and industry, greater productivity by employees under PM supervision than under pm supervision—that is, under managers who were above rather than below the median in both performance orientation and maintenance orientation. In one of these studies, P and M were systematically manipulated for coordinated first-level and second-level supervision in an experiment with 15 postal trainees working in trios. The PM-type first-level supervision generated more productivity than did either P or M alone. Second-level supervision, present only in the form of written instructions to the subjects from the second level, had the same effects, although with less statistical significance. For 215 of 500 groups of coal miners, when the second-level supervisor was actually present, the PM pattern at both the first and second level of supervision was most typical for the high-producing groups. For 186 working groups of about 10 employees each, involving a total of 2,257 workers in a Mitsubishi shipyard, evaluations of group meetings were most positive under PM-type leaders (evaluation mean = 17.5), followed by M-type (mean = 16.4), P-type (mean = 15.3), and pm-type (mean = 14.5) leaders.
The rated performance of 92 squads in a bearing manufacturing firm was most often high under PM leadership and least often high under pm leadership. The results for ratings above the median for P alone or above the median for M alone were in between. The same pattern emerged in a tire-manufacturing firm, where the success or failure rate of 889 project managers was strongly associated with their style of leadership: PM, P, M, or pm. The success rate was highest (52%) and the failure rate was lowest (5%) with the combined PM style.
Peterson (1988) concluded that introducing PM theory and practice in China and the West may need modification. For instance, more attention may need to be paid to merging self-interests with working hard. Peterson, Smith, and Tayeb (1993), in a British and in a U.S. plant, found results consistent for M but unlike those in Japan. “Pressuring” leadership was negatively related to interpersonal cooperation. This was confirmed when Royal Australian Air Force service personnel and blue-and white-collar employees were questioned about how much they liked or disliked supervisory pressure statements such as, “Hurry up, you have to work harder” and “There are a number of tasks I want you to complete today” (p. 263). As will be noted in Chapter 20, such pressuring for production had to be eliminated from the “initiation of structure” factor assessment in the Leadership Behavior Questionnaire to improve its prediction of subordinates’ satisfaction and performance (Fleishman, 1973). In order to be palatable to Australian subordinates, such statements had to be preceded by socioemotional supportive statements such as, “You have been doing a good job” and “I appreciate the extra effort you have been making” (p. 263).
Negative Evidence. A number of additional exceptions to the positive effects of task or relations orientation on productivity have been reported, particularly in short-range analyses. Andrews and Farris (1967) found no evidence that innovation was higher when supervisors of scientific personnel were high in both task and human relations functions. Human relations skills had little moderating effect on the generally positive relationships between the leader’s carrying out task functions and innovation. The most innovation occurred under supervisors who were neither high nor low in their attention to human relations, regardless of the task functions that were completed.
Lundquist’s (1957) results indicated that regardless of whether supervisors were worker-oriented, the sheer frequency of their interaction with workers increased their effectiveness. Weitz and Nuckols (1953) found that supervisors’ scores on a test measuring human relations orientation were not related to the productivity of the group or to the turnover of personnel. MacKinney, Kavanagh, Wolins, and Rapparlie (1970) found that both production-oriented and employee-oriented management were unrelated to the satisfaction of employees. Carp, Vitola, and McLanathan (1963) showed that supervisors of effective postal teams maintained their social distance from subordinates, an attitude that reduced the surfacing of emotional problems. Fernandez and Vecchio (1997) found little descriptive utility in the Hersey-Blanchard predictions of the performance of university employees. However, they did find that supervisory monitoring had a positive impact on lower-level employee performance, and supervisory consideration had a positive impact on higher-level employee performance.
In a study of simulated management groups, Kaczka and Kirk (1967) established that the profitability of teams was associated with relations-oriented leadership. But this type of leadership also resulted in less pressure to accomplish tasks and less cohesiveness in the groups. C. A. Dawson (1969), studying the achievement of schoolchildren, observed that the children performed equally well under “cold” or “warm” leadership.
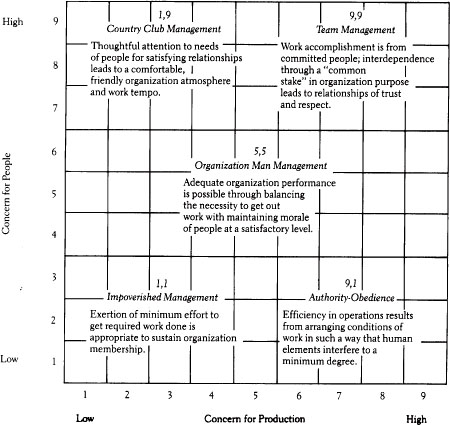
Among the models of task and relations orientation of the past 40 years with the power to survive into the twenty-first century are Blake and Mouton’s (1964) Grid, Hersey and Blanchard’s (1969 a, b) Situational Leadership, and Fiedler’s (1964a, 1967) Contingency Model. Fiedler and Hersey and Blanchard emphasized that what the leader should do to be effective depended on diverse circumstances. But Blake and Mouton (1964) prescribed the integration of task and relations orientations as the one best way to achieve effective leadership. Their managerial grid (see Figure 19.1) is based on the concept that managers and leaders vary from 1 to 9 in their concern for people (the vertical axis of the grid) and from 1 to 9 in their concern for production (the horizontal axis). The measurement of these concerns is based on a manager’s endorsement of statements about management assumptions and beliefs. But these concerns are interactive rather than independent. They are manifested in the five styles shown on the grid as published in 1985 (Blake & Mouton, 1985) and “softened” in a later version by Blake and McCanse (1991), with concern for production replaced with concern for results.
The revised grid and its expected effects are shown in Figure 19.1. Further elaboration was provided by Blake and McKee (1993).
9,1: Authority-Compliance Management. Efficiency in operations results from arranging conditions of work so that human elements interfere to a minimum degree. Expected effects: Productive, but quality suffers. Strong conflict, resentment, antiorganizational creativity, and efforts to “beat the system” are high.
1,9: “Country Club” Management. Thoughtful attention to the needs of people for satisfying relationships leads to a comfortable, friendly organizational atmosphere and work tempo. Expected effects: Low productivity, indifferent quality, low conflict, easygoing and pleasant atmosphere.
Figure 19.1 Managerial Grid
SOURCE: Blake and Mouton, Managerial Grid III: The Key to Leadership Excellence. Houston, TX: Gulf Publishing, 1985.
1,1 Impoverished Management. Exertion of minimum effort to get required work done as appropriate to sustain organization membership. Expected effects: Low productivity and quality, poor creativity, low conflict, low involvement.
5,5: Middle-of-the-Road Management. Adequate organizational performance is possible through balancing the necessity to get out work with maintaining morale at a satisfactory level. Expected effects: Acceptable performance based on the status quo, moderate quality, good team players who go along to get along, low creativity.
9,9: Team Management. Work accomplishment from committed people; interdependence through a “common stake” in organization, purpose leads to relationships of trust and respect. Expected effects: High productivity, quality, and creativity stimulated by internalized goals and objectives; commitment to goals, resulting in a high degree of interdependent cooperation; conflict is productive confrontation. 9,9 can take the form of paternalism if the leader fails to integrate the concerns for people and results—that is, if the two are kept in logic-tight compartments. The leader cares as father or mother for dependent subordinates, from whom unconditional loyalty is expected.
Opportunistic leaders use several styles interchangeably, depending on the persons with whom they are dealing Sometimes leaders masquerade as 9,9s when they really are paternalists or opportunists hiding behind facades.
The leader’s dominant style is likely to be backed up by other styles. Thus, for instance, the 1,9 leader may begin a meeting in a casual, friendly way but quickly become a tough, no-nonsense 9,1, which is his or her dominant style (Blake & Mouton, 1985c).
Team leadership (9,9) is prescribed. It is attained by behavioral science principles that involve participation, openness, trust, respect, involvement, commitment, open confrontation to resolve conflicts, consensus, synergistic utilization of the human resources represented by the leader and followers, mutually determined management by objectives, mutual support, and change and development through feedback (Blake & Mouton, 1981a).
According to a study reported by Blake and Mouton (1985c), prior to a seminar on the subject, 68% of the managers saw themselves as 9,9; 10% as 9,1; 19% as 5,5; and 2 to 3% as 1,9 or 1,1. After the seminar, a modal 41% admitted to being 5,5 and another 36% saw themselves as 9,1. Only 16% now believed they were 9,9. Blake and Mouton thought that these changes in results indicated the self-deception that occurs if understanding is impaired and feedback is not provided.
According to Blake and Mouton (1978), a 9,9 orientation has consistently proved to contribute positively to a variety of performance criteria in organizational development studies. In one of these studies, two matched subsidiaries of the same company were involved in a pre-post comparison over 10 years. One subsidiary engaged in an extensive organizational development program that stressed 9,9 management; the other was not involved in any comparable program. The experimental subsidiary increased its profitability by 400% over the matched control.
In a study of 716 managers from a single firm, Blake and Mouton (1964) found (after correcting for age differences) that 9,9-oriented managers were more likely than those with other dominant styles to advance further in their careers. J. Hall (1976) replicated these findings with an independent sample for 731 managers from a variety of companies.
Blake and Mouton (1985b) determined that the 9,9 style of team-management orientation characterized the leadership of the twentieth-century U.S. presidents who had performed with greatness, in contrast to those who had not. This style was inferred from contemporary writings about the presidents’ different ways of decision making, exercising initiatives, analyzing problems, taking advocacy roles, dealing with conflicts between themselves and their subordinates, and using critiques to increase their effectiveness in achieving results with and through subordinates.
Blake and Mouton did not leave much room for exceptions. Nevertheless, in a substantial number of investigations of the impact of task and relations orientation the findings have been mixed or negative. Explanations have been sought in situational contingencies. These situational contingencies need to be examined for their moderating effects on the impact of relations-and task-oriented leadership on the satisfaction and productivity of followers. For instance, Miner (1982a, 1982b) suggested that high-task, high-relations leadership orientation is most likely to be effective when organizations are a mix of systems of hierarchies and groups. The task orientation fits the hierarchies; the relations orientation fits the groups.
One example of a moderated result was the upward influence tactics used by subordinates who were subjected to task-or people-centered leadership in Deluga’s (1987b) study of 48 faculty members at a school of higher education. Deluga found that in the faculty members’ first attempt to influence their superiors, only the superiors’ relations orientation was of consequence. The faculty members said they were less likely to bargain or appeal to a higher authority if their superiors were more people centered. But if their first attempt failed to influence their superiors, the task orientation of the leaders became important in the second attempt. Here, the faculty members said that the more they thought their superior was task-centered, the more likely they would be to try friendliness, bargaining, assertiveness, appeals to a higher authority, and forming coalitions.
Although relations-oriented leadership was expected to generate more satisfaction among subordinates, moderating effects were seen in a number of investigations. In a study of community hospitals, F. C. Mann (1965) observed that the satisfaction of the nurses was related to the human relations skills of their supervisors, but the satisfaction of the nursing supervisors was related to the administrative skills of their superiors. The satisfaction of the hospital technicians was related to their supervisors’ technical and human relations skills. Tannenbaum and Allport (1956) studied two departments of women workers. One department was given more responsibility and authority for work and for decisions about the work, and the second department emphasized top-down line authority. A personality test was administered initially and scored as to the suitability of the workers’ personality to the situation in which they worked. One year later, an attitude test was administered. The results of the test revealed that significantly more suited than unsuited workers in the situation with more authority and responsibility wanted the situation to continue. However, suited and unsuited workers did not differ in their attitudes toward the program if they had not been given authority and responsibility. In another large-scale field study, Seashore (1954) found that supportive leadership with cohesive work groups paid off in higher productivity. However, the same group cohesiveness also resulted in lower productivity when the groups’ supervisors were unsupportive.
A number of investigators saw the followers’ need for achievement as making a difference in the way the followers reacted to particular styles of leadership. W. W. Burke (1965) discovered that followers with a high need to achieve who had socially close leaders rated their situation as more tense than did those with a high need to achieve who were under socially distant leaders. Followers with a low need to achieve who had socially close leaders rated their situation as more tense than did followers with a high need to achieve who had socially distant leaders. Followers with a high need to achieve rated socially close leaders high in authoritarianism; those with a low need to achieve did the same for socially distant leaders. Misumi and Seki (1971) also studied the effects of leadership style on the performance of students with a high or low need to achieve. Those who were achievement oriented performed best under a PM leader. In groups whose members had a low need to achieve, performance was best under a P-type leader.
Several studies obtained results suggesting that the style of supervision interacted with situational variables to influence productivity and satisfaction with the job. For example, Lundquist (1957) reported that foremen who are worker oriented produce better results in small groups than in large groups. In an Indian study of officers in central government departments, Srivastava and Kumar (1984) demonstrated that high task and high relationship styles of leadership both contributed to the effectiveness and adaptability of the middle-level officers; however, they did not do so for the junior-level officers. Nealey and Blood (1968) showed that among nurses in a Veterans Administration hospital, task-oriented first-level supervisors received higher performance appraisals, but it was the people-oriented second-level supervisors who received such higher performance appraisals. Although the subordinates’ job satisfaction was correlated significantly at both levels with the supervisors’ people orientation, task orientation contributed to the nurses’ job satisfaction at the first but not at the second level of supervision.
W. W. Burke (1965) found that a group’s performance of a coding task was completed more effectively under a production-oriented leader, but the completion of a decision task was carried out more effectively under a relations-oriented leader. Weed, Mitchell, and Moffitt (1976), among others, found that it was necessary to take the tasks into account to uncover the moderating of the linkage between a leader’s relations orientation and the subordinates’ satisfaction as a consequence of the subordinates’ personality and orientation. Overall, they studied the effects of task versus relations orientation on a group’s performance and satisfaction with supervision as a function of the subordinates’ personality and orientation. They compared leaders who scored high in human relations orientation and high in task orientation, low in human relations orientation and low in task orientation, low in human relations orientation and high in task orientation, and high in human relations orientation and low in task orientation. Each leader worked with subordinates high or low in dogmatism. Subordinates varied in their task and relations orientations as well. Regardless of their personality and orientations, the subordinates were significantly more satisfied with leadership behavior that was high in human relations orientation. But Weed, Mitchell, and Moffitt had also varied the ambiguity and difficulty of the tasks. The interacting effects of the leadership style—relations or task oriented—and the subor-dinates’ relations or task orientation were strongest on difficult and ambiguous tasks than on clear and easy tasks. That is, the compatibility of the leader’s and follower’s personality made a difference only if the task was difficult and ambiguous.
Wofford (1971) obtained results indicating that a relations-oriented manager is likely to be more effective in terms of the productivity and morale of the group in simple, centralized, structured operations. Shaskin, Festinger, Willerman, and Hyman (1961) generated somewhat different and more convincing evidence in an experiment with work groups matched in age, productivity, seniority, and disciplinary records. For three weeks, managers were friendly and helpful to the favored group, which they praised. To the unfavored group, they were threatening, reproving, and deliberately annoying in their demands. The favorable and unfavorable relations ceased at the end of three weeks, when minor changes in work were instituted. Table 19.1 shows the percentage of assembled units requiring repair during each phase of the experiment. When the employees continued to work on old, familiar tasks, the unfavorable supervision had only slight effects on their performance. But when a changeover occurred that required work on new, unfamiliar tasks, the repair rates of the unfavored group jumped much higher than those of the favored group. Equally important, although the favored group rapidly returned to its normal repair record by the end of the third week after the changeover, the unfavored group continued to exhibit a repair rate that was three times worse than its normal record before the onset of the unfavorable supervisory relations. Unlike the results of surveys, this experiment demonstrated that unfavorable supervisory human relations cause decrements in performance primarily when new learning is required, not when accustomed tasks are performed.
Woodward (1958) reported that friendly supervisors were rated as more effective in service departments but less effective in production departments. Consistent with this finding, B. Schneider (1973) noted that in social service agencies, supervisors set examples of how they expected their subordinates to relate to clients. Satisfied clients coincided with friendly, concerned, supervisory relations with subordinates. Schneider also found that good customer relations at a bank reflected good relations between the bank tellers and their superiors. Relations-oriented supervision thus would seem to be particularly indicated in service operations.
Table 19.1 Quality of Work Done Before and After the Changeover of Work Groups That Were Subjected to Favored and Unfavored Supervisory Treatment
| Percentage of Assembled Units Requiring Repair | ||
| Phase of the Experiment | Favored Group | Unfavored Group |
| During the first week of contrived disturbance | 10.6 | 11.8 |
| During the second two weeks of contrived disturbance | 11.7 | 14.7 |
| The first week after the changeover | 21.1 | 31.4 |
| The second week after the changeover | 13.8 | 28.0 |
| The third and fourth weeks after the changeover | 11.6 | 29.0 |
SOURCE: Schachter, Festinger, Willerman, and Hyman (1961), p. 206.
The manager and the coach of En glish football teams differ greatly in function. The manager has little continuous contact with the players, whereas the coach maintains a high degree of contact. Cooper and Payne (1967) found a correlation of .72 between the task orientation of the team coach and the success of the teams in winning games, but the correlation was close to zero for managers.
The effects of other types of behavior by the leader moderate the impact of the leader’s task or relations orientation. Thus Larkin (1975) showed that task-oriented elementary school teachers created high morale among pupils, regardless of how much they also resorted to power. But teachers whose task-oriented behavior was low and who used power generated rebellious pupils. Among supervisors of technical personnel, participative approaches (the provision of freedom) resulted in the most innovation if the supervisors were low in task or human relations orientation (Andrews & Farris, 1967). In an experiment with small groups of ROTC students, Anderson and Fiedler (1964) found that those under task-oriented leaders were most productive and satisfied when the leaders were participative, but the students’ satisfaction was greater when relations-oriented leaders were directive. Similarly, Pandey (1976) showed that the behavior and effectiveness of relations-and task-oriented leaders of discussion groups depended on whether the leaders were appointed, elected, or rotated: the elected and rotated leaders tended to be more participative than the appointed leaders.
A number of models of situational or contingent leadership have been constructed to provide advice to leaders on when they should be task-oriented and hence directive and when they should be relations oriented and hence participative. The Hersey-Blanchard situational leadership model has been widely applied but has received less research support than the Fiedler contingency model, which has been more widely researched than applied.
The Hersey and Blanchard (1969a) situational leadership model was built on propositions that were based on Hersey and Blanchard’s understanding of prior empirical research:
1. Leadership styles vary considerably from leader to leader (Stogdill & Coons, 1957).
2. Some leaders’ behavior primarily involves initiating structure to accomplish tasks; other leaders behave to build and maintain good personal relationships; and still others do both or do neither (Halpin, 1956a).
3. The most effective behavioral style of leaders is one that varies with the situation (Fiedler, 1967a; Korman, 1966).
4. The best attitudinal style is a high task orientation and a high relations orientation (Blake & Mouton, 1964; Reddin, 1967).
5. The job maturity and psychological maturity of the followers are most crucial in determining which behavioral style of leaders will result in the most effectiveness (Argyris, 1962).
6. Maturity relates to the stage in a group’s life cycle or to the previous education and training of the followers. Just as parental leadership of offspring must change to reflect the life cycle (infancy, adolescence, and adulthood), so must leading groups reflect the life cycle of followers from novices and newcomers to experts and people with experience.
According to Hersey and Blanchard (1969a, 1969b, 1977, 1982a), as shown in Figure 19.2, depending on the maturity of subordinates, a manager should be task oriented and tell or sell subordinates regarding what to do; or a manager should be relations oriented and participate7 with subordinates in joint decision making; or the decision should be delegated to them. What to do should depend on the subordinates’ task-relevant job maturity (capacity, ability, education, and experience) and their psychological maturity (motivation, self-esteem, confidence, and willingness to do a good job). The maturity manifests itself in the subordinates’ performance of their jobs. Newly appointed, inexperienced employees seek task-oriented direction from their superiors; they should be told what to do. As their life cycle on the job continues and their experience increases, they have to be sold to continue their performance. Later, with the subordinates’ further development, relations orientation and participation become most efficacious in order to engage both their knowledge and their maturation. Finally, fully mature subordinates work best when the leaders delegate what needs to be done. The most effective leadership is conceived of as depending on whether the leader’s task-oriented or relations-oriented behavior matches the subordinate’s maturity.
Figure 19.2 Hersey-Blanchard Model of the Relationship between Leader Style and Maturity of Followers
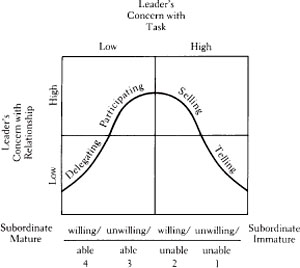
SOURCE: Hersey and Blanchard, Management of Organizational Behavior: Utilizing Human Behavior, Copyright 1977, p. 170. Adapted by permission of Prentice Hall, Inc., Englewood Cliffs, New Jersey, 1977.
LASI or LEAD. The Leader Adaptability and Style Inventory (LASI)—later renamed the Leadership Effectiveness and Adaptability Description (LEAD)—provides brief vignettes of 12 situations, each with four alternatives (Hersey & Blanchard, 1974). Maturity of the subordinates is at one of four levels in the situations. Each level involves a different combination of attention to relations and task.
For example, in one of the situations, you supervise a group with a fine record of accomplishment whose members respect the need for change. You indicate from among four choices what supervisory action you would take to deal with the problem. One alternative, under answer C, is to delegate by allowing the group to work out the solution itself. This delegation is leadership behavior that is low in task orientation and low in relations orientation. The response adds 2 points to your self-rated delegation score. It also adds to your flexibility score, for it best matches the requirements of the particular situation according to the model. The next best answer is A—to be participative, to allow the group to be involved in the change, and is scored 11 for flexibility. It is a moderately adaptive leadership response, low in task orientation and high in relations orientation. The next best answer, D—to be persuasive by directing the change but incorporating the group’s recommendations—is scored 21 for flexibility; it is a response that is high in task orientation and high in relations orientation. Finally, the worst and least flexible answer is B—announce the changes and implement them with close supervision. This is a highly directive, high-task–low-relations response; it is scored 22 for flexibility. Subordinates and colleagues can also complete the form, indicating what they believe the focal manager would do. Their responses can provide useful feedback to the focal leader (Hersey & Blanchard, 1981).
A curvilinear relationship between a leader’s task and relations orientation and the subordinates’ maturity was postulated by Hersey and Blanchard (1977), as displayed in Figure 19.2. Unwilling and unable subordinates should be told what to do; willing but unable subordinates should be sold; unwilling but able subordinates should participate; and willing and able subordinates should be delegated assignments.
Despite problems with the model, some supportive empirical evidence has emerged for it along with contrary findings. Hersey, Angelim, and Carakushansky (1982) obtained support for the model as an approach to improve learning. The participants in their study were 60 managers who attended a management-training seminar. The experimental groups were trained in four stages; a control group was not trained. Early on, the instructor engaged in a great deal of direction. The instructor next did some selling and then participated with the trainees in the learning process. Finally, the instructor delegated the responsibility for learning to the trainees but remained available to support them. Thus as the maturity of the trainees increased, the instructor decreased the task-oriented direction. The final examination at the end of training showed that the experimental group learned significantly more than did the control group.
Jacobsen (1984) found that LASI ratings by colleagues of the appropriate flexibility of the style of 338 managers correlated significantly with the progress of the managers’ careers, as well as with selected performance criteria. Although the maturity level of their subordinates was found to moderate between the managers’ behavior and effectiveness, it was less important than other situational variables. For 209 supervisors and managers from five organizations, Haley (1983) obtained positive correlations between the subordinates’ LASI assessments of the adaptability of their superiors’ styles and the subordinates’ ratings of the effectiveness of their own work groups. Hambleton and Gumpert (1982) found a statistically significant and practical gain in the job performance of 189 subordinates when their 56 supervisors applied the Hersey-Blanchard model correctly. High-performing managers rated higher than low performers on the effectiveness of their leadership and the flexibility of their style, both in their self-reports and in the appraisals by their subordinates and superiors. They also showed greater knowledge and use of the model of situational leadership.
Kohut (1983) found that the flexibility of 281 women managers, as measured by LEAD, was related to their effectiveness and sex-role identity. Vecchio (1987) surveyed 303 teachers from 14 high schools with the less controversial Leader Behavior Description Questionnaire (LBDQ), to be discussed in Chapter 20. Consistent with the Hersey-Blanchard model, Vecchio concluded that recently hired teachers, compared with those with more experience, may need and appreciate more initiation of structure from their supervisors. A replication with seven supervisors and 91 nurses reached similar conclusions (Norris & Vecchio, 1992); but another replication with 332 university employees and 32 supervisors (Fernandez & Vecchio, 1997) failed to find support for Situational Leadership Theory (SLT). Stirling (1998) obtained support for SLT by examining leadership in condominium and homeowner associations. Highly active members serve on committees and volunteer their time. Moderately active members participate in elections and occasionally attend meetings. Apathetic members expect a maintenance-free life and efficient management of the association. Stirling anticipated finding that apathetic members would be more satisfied with communication and decision making if the annually elected leader was task-oriented, telling, and a one-way communicator. Moderately active members were expected to favor selling and participative leadership. Highly active members were expected to want the leader to encourage participation and delegate responsibilities. Satisfaction of members was somewhat higher the more the leader adopted an appropriate style to match the perceived activity level of the member.
Consistent with other studies using other instruments, such as leaders’ self-ratings on the LBDQ (Weissenberg & Kavanagh, 1972), Haley (1983) found response bias, low reliability, and lack of correlation between self-ratings and others’ LASI ratings of the focal managers. Narayanan, Venkatachalam, and Bharathiar (1982) could find no relation between the LEAD self-reports of 30 owners of small Indian hosiery-knitting units and their employees’ descriptions of the owners’ styles. Nor could these researchers find any connection with the productivity of the units.
Goodson, McGee, and Cashman (1989) tested the Hersey-Blanchard propositions about effective leadership using 459 employees from 100 stores in a retail chain. The effectiveness of the style of leader behavior was unrelated to follower maturity; nor was the ranking of usefulness of the four styles from delegation to telling relevant to employee outcomes in commitment, satisfaction with the supervisor, or effectiveness in the different situations. York and Hastings (1985–1986) surveyed 172 employees in three North Carolina social service departments to ascertain the effects of the supervisors’ behavior on their subordinates’ performance in the context of the subordinates’ level of maturity. They found that regardless of the level of the subordinates’ maturity, supervisors’ supportive and work-facilitation behavior, as measured in the Survey of Organization, contributed in the same way to the subordinates’ performance.
Blank, Weitzel, and Green (1990) examined the situational leadership performance of 27 directors of residence halls (full-time professionals) who were responsible for 353 resident advisers (part-time paraprofessional students) in two large midwestern universities. A psychological maturity index was developed for the advisers, starting with 40 items about independence, the ability to take responsibility, and the motivation to achieve. Several factor analyses resulted in a refined single-factor scale of 11 items, such as “Acts conscientiously on the job,” “Follows through on job tasks,” “Takes care to do the job right,” and “Works hard on the job.” Peer ratings using the items were obtained from other advisers to measure the psychological maturity of the advisers (the subordinates of the directors). Satisfaction with their work and supervision were obtained from the advisers, along with ratings of their performance by their directors. The psychological maturity of the advisers correlated .40 with the directors’ ratings of their job performance. As predicted by the model, for those low in psychological maturity, work satisfaction increased linearly with the task-oriented, directive, and persuasive behavior of their directors. However, work satisfaction was much higher in advisers whose psychological maturity was high, regardless of the leadership behavior of their directors. The investigators concluded that their analyses as a whole lent little particular support for the Hersey-Blanchard model, although they agreed that further exploration of the relationship between the maturity of subordinates and the behavior of leaders would be useful.
The curvilinear model (Figure 19.2) has been roundly criticized because of the lack of internal consistency of its measures (Aldag & Brief, 1981), its conceptual contradictions, and its conceptual ambiguities (Graeff, 1983). The model appears to have no theoretical or logical justification (Graeff, 1983); nevertheless, the model has intuitive appeal. As was already noted, Blake and Mouton (1981a) argued that although situational leadership as such may be interesting, a preponderance of the empirical evidence supports their one best way: leadership that integrates both task and relations orientation. For example, in the research by Blank, Weitzel, and Green, the advisers’ satisfaction with their supervision correlated .41 and .54, respectively, with the task and relations behavior of their directors, regardless of the advisers’ maturity. To this, Hersey and Blanchard (1982b) replied that Blake and Mouton deal with attitudinal models, while they deal with a behavioral model. Conflict occurs only when behavioral assumptions are drawn from the analysis of attitudinal models. Blake and Mouton (1981a, 1981b) countered with other difficulties of the Hersey-Blanchard model. They noted the extent to which task and relations orientation and behavior tend to be interdependent rather than uncorrelated with each other. Merely adding high task concerns to high relations concerns makes for benevolent paternalism, not teamwork. Qualitative differences at different ends of the continua in orientation and behavior need to be taken into account. For example, a high relations orientation that achieves high productivity (9,9) is characterized by openness, trust, respect, understanding, and mutual commitment. A high relations orientation that results in low productivity (1,9) is warm, friendly, and harmonious. To demonstrate this issue, Blake and Mouton (1981a, 1981b, 1982a) revised each of the 12 LEAD situations by adding fifth choices that reflected their 9,9 style. In paraphrase, the first Hersey-Blanchard situation was as follows:
A group is not responding favorably to our friendly conversation and concern for their welfare. Their performance is going down quite quickly.
The prescribed Hersey-Blanchard answer is a high task–low relations orientation, with the leader behaving according to response A. The least desirable choice is response D.
(A) Stress and apply uniform procedures and the need for accomplishing the task.
(B) Keep yourself on hand for discussion, but don’t pressure subordinates to involve you.
(C) Set goals for subordinates after talking with them.
(D) Demonstrate your intentions by not interfering.
For this situation, Blake and Mouton thought the 9,9 style was the most efficacious: initiate a critique session with the entire group to diagnose the underlying problems responsible for this rapidly declining production and to decide what to do about it. From Blake and Mouton’s point of view, the prescribed Hersey-Blanchard answer, A, is 9,1 behavior: telling subordinates what to do and pushing for production (Blake & Mouton, 1982a, 1982b).
One hundred experienced managers from 41 organizations completed the revised form without prior knowledge of the controversy. They ranked the choices for each of the 12 problems from most effective to least effective. The managers chose the fifth alternative, which reflects Blake-Mouton’s 9,9 behavior (integration of the task and relations orientations) between 72% and 90% of the time to handle each of the 12 situations. The managers chose the 9,9 alternative for situations at the four levels of the maturity of followers, from lowest to highest, 79%, 86%, 76%, and 78% of the time, respectively. They chose the appropriate alternative presented by Hersey-Blanchard to reflect the followers’ maturity only 9%, 7%, 11%, and 5% of the time, respectively. Similar results were obtained with 36 mental health professionals.
In line with these results, Slocum (1984) suggested that the emphasis on the maturity of subordinates to determine when direction or participation is appropriate is of minor importance, in contrast to a number of other variables: the subordinates’ tasks, the technology employed, the information required, the managerial control and coordination systems in place, the amount of self-control that is possible, and the extent to which the decision is operational and complex. Norris and Vecchio (1992) attributed to chance effects the occasional theoretically correct matches of leader style and subordinate readiness.
Nicholls (1985) suggested correcting the model’s logical flaws by requiring a smooth progression of the leader from the parent style of high task orientation–high relations orientation to the developer style of low task–high relations. In this developmental progression, the leader will maintain a balanced emphasis on both the task and relationships as long as the ability and willingness of the group are developing symmetrically. If ability and willingness develop asymmetrically, the leader may find it more appropriate to act highly task-oriented, like a coach or a driver.
Boone (1981) improved the LEAD by modifying its scoring. The reliability of the LEAD self-report was increased by changing it from forced-choice scoring to scoring that captures the intensity of the endorsement of each alternative. In this way, a study of 249 managers from South Africa and the United States obtained more satisfactory test-retest reliabilities, ranging from .66 to .79.
Leader Behavior Analysis (LBA). Blanchard, Hambleton, Zigarmi, et al. (1982) developed a revised instrument, Leader Behavior Analysis (LBA), with 20 incidents, to improve on the 12-incident LASI or LEAD. The LBA was constructed recognizing that effective task orientation and effective relations orientation were not independent of each other. Three of the four principal leadership styles were relabled in 1985. Telling became directing; selling was seen as manipulative and became coaching; and participating became supporting for purposes of clarification and retention (Blanchard, Zigarmi, & Zigarmi, 1985). Readiness and maturity were also relabeled, as development level, to change the implication from age and status to mastery of necessary skills for task accomplishment and competence. The lowest developmental level of followers was changed from being unwilling and unable to being committed but unable. At the second level of development, followers were conceived to be low in commitment but somewhat competent. An effectiveness score could be calculated from the extent to which the chosen responses to the 20 incidents matched what was required according to the revised Situational Leadership model.
Evidence of the Effectiveness of the Revised Model. Using the LBA, Wilkinson (1990) compared 116 high-and low-scoring leaders in a government agency. Compared with low scorers, high scorers were rated by their subordinates as significantly more satisfying as supervisors. Stoner-Zemel (1988) obtained significant positive correlations between LBA effectiveness of supervisors according to others and the perceptions by 293 employees of their high productivity (r = .25), alignment (r = .28), and feelings of empowerment (r = .34). Duke (1988) also reported a positive correlation for nurses between LBA effectivess scores of supervisors and subordinates’ sense of empowerment. Zigarmi, Edeburn, and Blanchard (1993) compiled results for 552 employees for whom morale was higher, tension was lower, and felt opportunities for growth were higher if the employees’ LBA descriptions of their manager generated high rather than low effectiveness scores. Price (1993) found positive correlations between effectiveness scores and various managerial competencies as found in the Boyatzis’ (1982) model.
Measurement. A flexibility score can be calculated based on the extent to which the leader or rater reported use of varying styles to handle the 20 LBA incidents. The most inflexible score would describe a leader who used the same single style to deal with all 20 incidents. Use of the LBA and the flexibility score could further understanding of the importance of leadership constancy and flexibility.
Effects. If leaders recognize that different circumstances call for different actions on their part, do they risk being downgraded for being inconsistent and unpredictable? Do they cause subordinates to feel unsure about what is expected? The evidence is mixed. Bruce (1986) reported that CEOs placed a premium on being consistent and predictable in word and action. Staw and Ross (1980) asked 95 practicing managers and 127 undergraduates to read one of several case descriptions of administrators who were consistent or flexible and ultimately successful or unsuccessful in their actions. Although both sets of respondents assigned the highest ratings to administrators who were consistent, particularly those who also were successful, the practicing managers valued consistency more than did the undergraduates. Block and Kennedy (1986) asked 133 employees to rate leaders who were described as consistently autocratic or participative rather than flexible and varying in their style depending on the circumstances. The employees opted most often for the consistently participative manager than for the more flexible one. Graves (1985) obtained similar results for 141 undergraduate leaders. Those who persisted in one particular way were evaluated more favorably than were those who varied in their responses, despite the different levels of complexity with which they had to cope. Also supporting the utility of consistency, Aldag and Brief (1977) obtained strong negative correlations between an index of the variability of leaders’ behavior and measures of subordinates’ satisfaction, involvement with their jobs, organizational commitment, and experienced meaningfulness of the work. Thus Blake and Mouton’s (1982a) arguments for a consistent 9,9 leadership style have more empirical support than do Hersey and Blanchard’s notions about how leaders must vary their style according to the situation.
Some exceptions need to be noted. James and White (1983) showed that 377 U.S. Navy managers were in favor of flexibility and varied their leadership behavior toward their subordinates depending on their perceptions of what specifically caused these subordinates to perform inadequately. When 159 undergraduates judged systematically differing leadership descriptions, Knight (1984) found that the perceived competence among managers was more important in evaluating them than whether they were consistent or flexible.
One factor that seemed to account for the differences in support for consistency or flexibility was whether the evaluators were the superiors or subordinates of the leaders. According to a simulation used by Heilman, Horn-stein, Cage, and Herschlag (1984), appropriate flexible responses were more likely to be favored if the evaluator was a superior of the leader; consistent participativeness was more likely to be favored if the evaluator was a subordinate. In addition, it seems that flexible leadership will be judged favorably if the shifts in a leader’s style or behavior are meaningful and explainable to those who are evaluating the leader as shifts to accommodate the requirements of the circumstances. If no such change in requirements is perceived, consistency will be prized in a leader because it is predictable and fits with colleagues’ expectations.
The Hersey-Blanchard model has had remarkably widespread intuitive appeal to practicing managers and to leaders of management-training programs. An understanding of its popularity with management may require an analysis of the sociology of knowledge, not of the model’s theoretical or empirical validity.
Situationalism may be popular because it provides freedom from principles (“You can do your own thing as you see fit”). Principles are more complex to learn and practice. Situationalism allows a leader to keep all options open (Blake & Mouton, 1982b). Although LEAD lacks the desired level of reliability, and its validity remains in doubt, its situations and choices seem to provide interesting discussion material for training. The simplicity of this instrument makes it possible to retain its prescriptions on a single small card. This simplicity may also give managers a sense of quick mastery of a complex problem. For the personally authoritarian manager, the model calls attention to the need for a flexible response. To the personally democratic manager, it gives legitimacy to being directive at times.
Fiedler’s contingency model (1967a) avoids the problem of a leader’s consistency in the face of situations with different requirements. Leaders are conceived to have a personally consistent style of task or relations orientation. Either different types of leaders need to be chosen for various situations, or leaders need to change the situations to suit their particular personal style. According to the heavily researched contingency model of leadership, leaders with high “least preferred coworker” (LPC) scores do best in situations moderately favorable to them; low-scoring leaders do best in situations extremely favorable or extremely unfavorable to them. This model is presented here as part of the discussion of relations-and task-oriented leadership. Nevertheless, controversy continues about whether Fiedler’s LPC questionnaire measures task orientation or something else. The controversy, in turn, affects our ability to understand LPC’s contribution to effectiveness in different situations. On the surface, LPC measures how much each of 16 to 18 attributes reflect respondents’ feelings about a person with whom they can work least effectively.
Starting in the early 1950s, Fiedler (1953a, 1953b, 1953c) began studying the success of psychological therapists as a function of their accuracy and assumed similarity to their patients. This research was then extended to leaders and the effectiveness of their groups (Fiedler, 1954a, 1954b, 1955, 1956). A measure of Assumed Similarity between opposites (ASo) was developed. ASo scores were obtained by computing the difference between two sets of semantic differential ratings. One set was the leader’s description of his or her least preferred coworker (LPC). The other set consisted of ratings of the leader’s most preferred coworker. ASo scores were viewed as indicators of leadership style, and were correlated with the performance of groups. Success in accurately predicting performance of outcomes from ASo scores was mixed.
Eventually, the most preferred coworker was abandoned as an assessment, and attention was focused on LPC. In its standard version, the examinee is asked to think of everyone with whom he or she has ever worked and then to describe the one person with whom he or she could work least well. This description of one’s LPC is made by marking 16 items, as shown in Table 19.2. The favorable pole of each scale is scored as 8 and the unfavorable pole is scored as 1 (Fiedler, Chemers, & Mahar, 1976). The sum of the scale scores of items constitutes the individual’s LPC score. A relatively high LPC score (favoring the LPC) was most generally conceived by Fied ler (1967a, 1970b) to indicate a relations-motivated person, whereas a low LPC score (rejecting the LPC) was conceived to indicate a task-motivated person.
A good deal of evidence is available concerning the internal consistency and stability of the LPC, but its validity remains a complex question.
Table 19.2 Least Preferred Coworker Scale

SOURCE: Fiedler (1967), p. 41.
Internal Consistency. Do the same people respond in the same way to the different items of the LPC scale? For earlier versions of LPC, Rice (1978a) obtained a mean split-half reliability of .88 for a variety of investigations. Fox, Hill, and Guertin (1973); Shiflett (1974); and Yukl (1970) discovered separate interpersonal and task factors in these earlier LPC scales, but the secondarily scored task factor was seen to be relatively unimportant. Therefore, a newer 18-item scale was designed to minimize task-factor items and, as a consequence, was somewhat higher in internal consistency (Fiedler, 1978). In five studies with the newer 18-item version, shown in Table 19.2, Rice (1979) reported coefficient alphas of .90, .91, .79, .84, and .89.
Stability. Do people’s LPC scores remain the same over time? Rice (1978a) found 23 reports of test-retest reliability ranging from .01 to .91, with a median of .67. Stability indexed by high test-retest correlations was obtained by Chemers and Skrzypek (1972)8 when the test and retest were separated by at least several weeks. However, the time between the test and retest did not affect stability (as might have been expected), according to an analysis of studies in which the intervals between the test and the retest ranged from several days to over two years (Rice, 1978a). Hence, stability can be maintained over extended intervals of time. Bons (1974) obtained a test-retest reliability of .72 for 45 higher-level army leaders over a five-month period, and Prothero and Fiedler (1974) obtained a test-retest correlation of .67 for 18 faculty members at a school of nursing over a 16-to 24-month period. However, Fox (1976) found a decline in reliability when the retest was obtained nine weeks instead of four weeks after the test. With intervals of three to five weeks, test-retest reliabilities ranged from .73 to .85. With intervals of eight to nine weeks, they ranged from .23 to .68. When the interval was 130 weeks, the test-retest reliability was only .45. Fox (1976) found that stability was reduced if the same LPC was not described in the test and in the retest.
Thus, LPC is not necessarily as invariant an attribute of an individual as is a personality trait, such as sociability. Offerman (1984) and other investigators9 obtained results suggesting that the LPC is more like a transitory attitude. For example, in a comparative experiment with male and female undergraduates who led opposite, mixed, or same-sex groups, Offerman (1984) found significant differences among the leaders as a consequence of the sex composition of the groups. The LPC scores of females who had just led male groups were most task-oriented; the LPC scores of males who had just led female groups were most relations-oriented.
Temporary shifts also can be induced by unsatisfactory work experiences in laboratory experiments. When instability has been found in such experiments, it has been attributed to “implicit instructions” of training interventions as to how one should adapt toward poor coworkers (Rice, 1978a). The LPC also appears sensitive to major life changes, such as being subjected to stressful contact assignments (Bons, Bass, & Komorita, 1970). In spite of the satisfactory median test-retest results, Schriesheim, Bannister, and Money (1979) remained unconvinced of the stability of LPC because of the wide variation in test-retest results within the various reported analyses. For instance, Schriesheim and Kerr (1977a) noted that a significant proportion of persons also changed category from high to low LPCs, or vice versa.
Parallel-Form Reliability. Do LPC scores remain the same if different attributes are included in the items? For instance, in one form, the choice may be between dull and bright. In the parallel form, the choice may be between stupid and smart. Rice (1978a) reported one study in which scales whose items had different content and different formats were fairly well correlated with each other. Different versions of the LPC have contained various numbers of task-oriented items, which may reduce their parallel-form reliability. This difference may account for some of the variations in correlations of the LPC version used with other tests and measures of the effectiveness of groups in attempts to determine the meaning of LPC (Schriesheim, Bannister, & Money, 1979). But Rice (1979) argued that since correlations of .79, .78, and .66 were obtained when items and formats to assess LPC had been changed, correlated parallel forms could be constructed successfully.
Content Validity. Are the items of the LPC scale biased? If LPC is a measure of the degree to which task-oriented individuals are negative about those with whom they cannot work—an attitude reflected by ascribing negative values to the LPCs on such attributes as pleasant-unpleasant, which are not necessarily related directly to their work—then task-oriented items, such as bright-dull, reduce the content validity of the LPC, since brightness and dullness are directly related to getting the work done (Schriesheim, Bannister, & Money, 1979). An 18-item version that omits such clearly task-relevant items is now operative. As was noted earlier, Shiflett (1974) and Yukl (1970), among others, demonstrated that the earlier versions of the LPC contained two factors, one associated with interpersonal relations items, the other with task-oriented items. Studies by Fiedler (1967a) and Schriesheim (1979b) have found LPC scores to be relatively free of social desirability, unlike so many other personality measures.
Construct Validity. What is really being measured by the LPC? How does the LPC logically and empirically link with other known entities? Fiedler and Chemers (1974, p. 74) observed that “For nearly 20 years, we have been attempting to correlate [LPC] with every conceivable personality trait and every conceivable behavior observation score. By and large these analyses have been uniformly fruitless.”
But Rice (1978b), who sampled 66 out of 114 studies involving over 2,000 empirical relationships between the LPC and other variables, thought he could lay out the nomological network of empirical relationships of the LPC and other measures. He concluded more optimistically that although it remains unclear whether the LPC is a measure of social distance, personal need, cognitive complexity, or motivational hierarchy (as will be discussed later), the LPC score as a measure of interpersonal relations versus task orientation is not in doubt.
The inconsistent results can be seen if one examines the correlations of LPC with biographical data and then compares what Bass (1967b) reported about the correlations of direct measures of relations orientation and task orientation. In agreement with Bass’s review, a low LPC score (task orientation) was higher with increasing age (Fiedler & Hoffman, 1962) and with experience (Bons, Bass, & Komorita, 1970). But opposed to Bass’s conclusions, a high LPC score (relations orientation) was positively correlated with managerial level (Al-pander, 1974) and with Protestant rather than Catholic affiliation (Fiedler & Hoffman, 1962). Above and beyond these results, no significant relations of biodata and LPC were found by Eagly (1970) or numerous other investigators.10
Schriesheim and Kerr (1974) have critically noted, as new evidence has emerged, that the LPC has been redefined as an orientation toward work, as an attitude, as a cognitive complexity measure (E. J. Frank, 1973), as the ability to differentiate conceptually (Foa, Mitchell, & Fiedler, 1971), or as an index of a hierarchy of goals (Fiedler, 1972a). However, this redefinition could be a virtue rather than a fault. (Theoretical constructs, like ether, should wither away, leaving behind empirical facts, like the electrical discharge in lightning.) But critics fail to see that the new data justify the new interpretations (Hosking, 1978). For example, Evans and Dermer (1974) correlated the LPC scores for 112 business students, managers, and systems analysts with two measures of cognitive differentiation and cognitive complexity and found that low LPC scores were associated with cognitive simplicity. Nevertheless, high LPC scores were not unequivocally related to cognitive complexity.
LPC as a Measure of Relations and Task Orientation. A number of studies have supported the contention that a high LPC score is connected with relations orientation and a low LPC score is connected with task orientation.
Fiedler (1964, 1967a) proposed that high-LPC people have a strong need to attain and maintain successful interpersonal relationships, whereas low-LPC people have a strong need for successful task performance. Four sets of data generally gave some support for this interpretation (although many reversals were noted). The behavior of low-LPC leaders tended to be task oriented, and the behavior of high-LPC leaders was generally relations oriented. Members of groups with high-and low-LPC leaders tended to exhibit task-oriented and relations-oriented leadership. Higher levels of satisfaction and lower levels of anxiety were found among groups with high-LPC leaders. Finally, data suggested that low-LPC people gained self-esteem and satisfaction from the successful performance of tasks and high-LPC people gained self-esteem and satisfaction from successful interpersonal relations.
Fiedler (1978) inferred that for an individual who describes his or her LPC in negative, rejecting terms, the completion of the task is of such overriding importance that it completely colors the perception of all other personality traits attributed to the LPC score. Fiedler’s interpretation was as follows: “If I cannot work with you, if you frustrate my need to get the job done, then you can’t be any good in other respects. You are unfriendly, unpleasant, tense, and distant, etc.”
The relationship-motivated individual who sees his or her LPC in more positive terms says, “Getting a job done is not everything. Therefore, even though I can’t work with you, you may still be friendly, relaxed, interesting, etc.—in other words, someone with whom I could get along quite well on a personal basis.” Thus a high-LPC person looks at his or her least LPC in a more differentiated manner and is more interested in the personality of the individual than merely in whether this is or is not someone with whom one can get a job done (p. 61). But Hare, Hare, and Blum-berg (1998) found among 20 groups of managers that leaders who were both relations-and task-oriented were prone to give lower ratings to their LPCs.
LPC and Other Relevant Measures of Orientation. Vroom and Yetton (1973) and Sashkin, Taylor, and Tripathi (1974) reported that high LPC scores related to the preference for participation in resolving conflict. Nebeker and Hansson (1972) found that high LPC scores correlated with support of giving children the freedom to use facilities. Alpander (1974) obtained results indicating a positive relationship between high LPC scores and the judged importance of people-oriented management functions. Similarly, Ayman and Chemers (1986) found that high-LPC Mexican managers described the ideal leader as a “people person” and low-LPC managers described the ideal leader as a taskmaster; low-LPC managers were also more self-monitoring. However, Singh (1983) failed to find support, in experiments with 53 Indian engineering students, that high-LPC students would place greater importance on the equity of the distribution of rewards whereas low-LPC students would emphasize performance. Contrary to expectations, Steiner and McDiarmid (1957) found that a high LPC score coincided with authoritarian beliefs, and Evans and Dermer (1974) and others11 found LPC to be unrelated significantly to authoritarianism or dogmatism.
LPC and Observed Leader Behavior. Observers and other group members found that a low LPC score coincided, as expected, with initiating structure and task-oriented leadership behavior, and a high LPC score coincided with relations-oriented behavior in a number of studies.12 But complete reversals (Nealey & Blood, 1968) and negative results were also reported.13 Interactions with situations had to be considered.14
LPC scores did not relate much to decision-making styles. McKenna (undated) obtained correlations between LPC and style of decision making of 22 chief accountants, as follows: directive without explanation, –.12; directive with explanation, –.01; consultative, .06; participative, .03; delegative, .13.
Mitchell (1970a) found that, as expected, high-LPC leaders gave more weight to interpersonal relations. Gottheil and Lauterbach (1969) studied military cadets and squads who were competing in field exercises and found that a leader’s low LPC score was associated with a group’s performance, whereas leader’s high LPC score was associated with a group’s morale. But contrary to expectations, LPC scores were higher for leaders working in the short term than in the long term (Miller, 1970).
Such complete reversals of results and the weakness of LPC scores as indicators of leadership behavior led Vroom (1976b) to suggest caution in characterizing leadership style on the basis of LPC score alone. According to Fiedler (1967a), leadership style depends on combining LPC scores with measures of the situation in which high-or low-LPC people find themselves. A high LPC score, Fiedler (1978) noted, does not always predict that a leader will behave according to a relations orientation. Nor will a low LPC score always predict that the leader will push for production, for completion of the task, or for more structuring. At any rate, although LPC may prove to discriminate among leaders in ways that are of consequence to their effectiveness in different contingencies, LPC is not directly symptomatic of the other styles of leadership behavior discussed earlier or yet to be discussed. Hence the results with LPC must stand alone. In fact, some question remains about whether LPC is measuring task and relations orientation or something else.
LPC has gone through a series of reinterpretations based on empirical studies of its characteristics. It has been conceived as a measure of social distance, cognitive complexity, motivational priorities, and a value attitude.
LPC as a Measure of Social Distance. At first, Fiedler (1957, 1958) interpreted LPC—then called ASo, an index almost perfectly correlated with LPC—as a generalized index of psychological closeness. Low-LPC people were conceived to be more socially or psychologically distant from other group members than were high-LPC persons. The assumed similarity data were drawn from person-perception research conducted in therapeutic settings. Fiedler (1953a, 1953b) inferred that respondents showed greater assumed similarity between themselves and group members they liked than between themselves and members they disliked. Analyses suggested that LPC was a measure of emotional and psychological distance, since high-LPC people conformed more in the face of social pressure and were more closely involved with other group members. But following a review of studies of the reactions of others to high-and low-LPC persons, Rice (1978b) concluded that the data were contradictory.
LPC as a Measure of Cognitive Complexity. Foa, Mitchell, and Fiedler (1971) and Hill (1969a) argued that compared with low-LPC people, high-LPC people are more cognitively complex, favoring the abstract over the concrete and using less broad categorizations. These researchers based their proposal on positive correlations they found between LPC and several measures of cognitive complexity. In addition, the intercorrelations among the factor scores of the LPC scale were lower for high-LPC persons; and greater responsiveness to interpersonal factors was observed in the judgments and behavior of high-LPC persons.
Although LPC was found to be correlated significantly with intelligence in only 1 to 14 analyses, in several of 11 other analyses LPC was related to specific cognitive tendencies. Thus Mitchell (1970a, 1970b) found that high-LPC leaders gave more weight to power and structure in making discriminations, whereas low-LPC leaders gave more weight to interpersonal relations. Foa, Mitchell, and Fiedler (1970) observed that the high-LPC leader performed better in situations that presented difficulties in either interpersonal or task relations and thus that required a high degree of cognitive differentiation between them. Jacoby (1968) found positive correlations between LPC and scores on the Remote Associates Test, a test of creativity. Similarly, Triandis, Mikesell, and Ewen (1962) reported a possibly positive correlation between LPC and the judged creativity of two written passages. Singh (1983) also obtained data to support LPC as a measure of cognitive complexity by demonstrating that high-LPC engineering students did better than low-LPC students in obeying the precise prescriptions of a model for the equitable distribution of rewards.
The findings for cognitive complexity dealing with field independence-dependence, as measured by the Embedded Figures Test, were less consistent (Gruenfeld & Arbuthnot, 1968; Weissenberg & Gruenfeld, 1966). Furthermore, a number of other studies15 found no evidence to support LPC as a measure of cognitive complexity.
LPC as a Measure of a Motivational Hierarchy. To account for so much variation in results, Fiedler (1972a) saw the need for a “hierarchical” conceptualization of LPC. Since, according to Fiedler, the high-LPC person needs to be related and socially connected to others, he or she will show concern for good interpersonal relations when the situation is tense and anxiety arousing and when relations with coworkers seem tenuous. But when the goals of being related are secure, the relationship-motivated high-LPC person will then seek the self-oriented admiration of others and the attainment of prominence. In work groups, such goals can be attained by showing concern for the task-relevant aspects of the groups’ interaction. The major objectives of the low-LPC person are to accomplish a task and to earn self-esteem by doing a good job (D. W. Bishop, 1964). But when the completion of a task presents no problem, the low-LPC person will seek friendly, good interpersonal relations with coworkers, partly because he or she believes that good interpersonal relations are conducive to accomplishing the task (Fiedler, 1971b).
Nevertheless, this interpretation, like previous interpretations, remains controversial. Green and Nebeker (1977) presented data to support it. But evidence by Rice and Chemers (1975) failed to confirm predictions based on a motivational hierarchy. Rather, LPC as a measure of cognitive complexity better fit their results. Kunezik (1976a, 1976b) found no support for the motivational hierarchy in studies of the relationship of ASo to various personality measures among 1,590 German army recruits and 148 group leaders. Schriesheim and Kerr (1977b) concluded that neither sufficient theoretical nor empirical support had emerged for this interpretation of LPC.
LPC as a Measure of a Value Attitude. On the basis of a review of available evidence, Rice (1978b) agreed that the data did not support the shift in orientation required by the motivational hierarchy concept of LPC. According to Rice, the data fit better with a simpler conceptualization of LPC as a value and an attitude, for LPC was more consistently and strongly related to attitudes and judgments than to behavioral manifestations. Therefore, LPC was seen as an attitude that reflects differences toward interpersonal relations and the accomplishment of tasks. One can make some general statements about the behavior of high-and low-LPC leaders, but situational variables have a strong influence.
How can Fiedler and Chemers’s (1974) beliefs in the uniqueness of LPC be reconciled with Rice’s conclusion that LPC is a value-attitude assessment? One problem was Rice’s strategy of building his summary around published relationships that were statistically significant at the 5% level. As David Bakan quipped in a private communication, significant relationships are more likely to be published than nonsignificant ones. The total universe of studies is probably far greater than what Rice compiled. And with so many studies in the significant pool at the margin of significance, with no attention paid to the strength of the relationships that were found, it is difficult to accept Rice’s evidence as compelling. However, Rice (1978b) concluded, as a consequence of his analysis of 313 reported relationships, that LPC was more strongly linked (that is, significant results at the 5% level were obtained) with values and attitudes. But even here, only 27% of the 313 relationships were significant. Yet even among these, certain expected and reasonable inferences could be made with some conviction. Thus, as would be expected from relations-oriented individuals, high-LPC people were found to make more favorable judgments of other group members—the leader, coworkers, and followers in general16—than low-LPC persons did in 18 of 20 analyses. Low-LPC people tended to be more favorable than high-LPC people in judgments of their best friends, more preferred coworkers, and loyal subordinates.17 But negative results were also reported.18
Rice (1978b) concluded from these studies that low-LPC persons discriminated more sharply than high-LPC persons among other group members on task competence. Also, LPC was related to judgments about oneself; low-LPC persons judged themselves significantly more favorably than did high-LPC persons in 34 of 102 analyses, particularly in direct evaluations (88% of the relationships were statistically significant).19 A complete reversal (not necessarily unexpected) occurred in a Japanese study (Shima, 1968), and negative results were reported by others.20
Evidence that low-LPC persons value the successful completion of tasks was seen in the defensiveness of their attributions about the cause of the failure of a task and their evaluation of the task-relevant ability of the group. In addition, low-LPC persons were found to be more optimistic about succeeding in a task and about earning important rewards as a consequence. High-LPC persons were more optimistic about succeeding at interpersonal relationships and expected that such success would lead to important outcomes (Fiedler, 1967a, 1972a).
Taking everything into account, Rice (1978b), on the basis of these mixed results, agreed with Fiedler that low-LPC persons value being successful in tasks and high-LPC persons value interpersonal success. But Fiedler concluded that any interpretation of the meaning of LPC must take into account situational considerations in determining how LPC will manifest itself in effective leadership. That is, Fiedler (1978) believed that the main effects of LPC on a leader’s behavior are weak, in comparison with the effects of the interaction of LPC with the favorableness of the situation to the leader.
In Fiedler’s (1967a, 1978) exposition of his model, lowLPC (task-oriented) leaders performed better and led more effective groups when the quality of leader-member relationships, the degree of task structure, and the positional power of the leader are either altogether highly favorable or altogether highly unfavorable to the leader. High-LPC (relations-oriented) leaders are most effective when favorability is neither high nor low; that is, high-LPC leaders are expected to be most effective in moderately favorable circumstances. Fiedler envisaged eight situations (octants I through VIII), one for each combination of poor or good relations with group members, low or high structure of the group, and weak or strong power of the leader. The extremes of octants I and VIII are clearly determined by their location at the ends of the dimension of situational favorability. In octant I, leader-member relations are good, the task is highly structured, and the leader’s positional power is strong. In octant VIII, leader-member relations are poor, the task is unstructured, and the leader’s positional power is weak. But octants II and III, for instance, would exchange places on the dimension of favorability if the leader’s position power was considered the second horizontal dimension and structure was considered the third horizontal dimension. The eight octants of the situational favorability dimension are shown along the horizontal axis of Figure 19.3.
Weighting. The relative importance of the three situational factors to the leader’s situational favorability was reflected in a continuous scale constructed by Nebeker (1975). Nebeker’s scale weighted standardized scores for each of the three situational variables so that the leader’s situational favorability = 4 (leader-member relations) 1 2 (task structure) 1 (positional power).
Figure 19.3 The Contingency Model of Leadership Effectiveness Based on Original Studies

SOURCE: Fiedler (1967a).
The theoretical combinations required by Fiedler for octant analysis fit the empirical multiple regression analyses conducted by Nebeker (1975). Beach and Beach (1978) also reported findings that supported an independent, additive view of the three variables of leader-member relations, task structure, and leader’s positional power. Beach and Beach (1978) asked students to estimate the probability of success and the situational favorability of a series of hypothetical leadership situations. These situations were presented as involving either good or poor leader-member relations, high or low task structure, and the leader’s high or low positional power. A correlation of .89 was obtained between the estimated probability of the leader’s success and the degree of situational favorability. A multiple correlation was then compared with situational favorableness as the criterion and the three situational favorability subscales as predictors. The beta weights obtained were .45 for leader-member relations, .33 for task structure, and .11 for positional power, comparable to the Nebeker formula of 4:2:1.
Earlier, situational favorability had been defined in terms of how much control the leader had in the situation. Support for the linkage of situational favorability and situational control came from a study by Mai-Dalton (1975) in which participants were asked to complete a leader’s in-basket test. The study found that high-LPC leaders tended to be most effective and were most likely to ask for additional information in moderate-control situations, whereas low-LPC persons engaged in the most information-searching behavior in high-control situations.
Determination of Situational Characteristics. In Fiedler’s original studies, the quality of interpersonal relations was measured by sociometric choices and related measures of liking. Open-hearth steel crews were judged to be highly structured and boards of directors or transient student groups were judged to be highly unstructured. The leader’s power was judged to be high for managers of gasoline stations and to be low for the informal leaders of basketball teams. Subsequently, Fiedler developed specific scales to provide measurements of the three situational variables for any leader-group situation. Other situational variables that have been assumed to determine the leader’s situational control included stress, cultural and linguistic heterogeneity, and the amount of experience.21
To measure leader-member relations, an eight-item group-atmosphere scale was developed that correlated .88 with earlier methods of estimating these relations. Respondents rated how much the situation was friendly or unfriendly, accepting or rejecting, satisfying or frustrating, etc. To measure task structure, a scale was created to obtain judgments about whether the goal was clearly stated, whether there was only one way to accomplish the task, whether there was one correct answer, and whether results were easy to check for correctness. To measure a leader’s positional power, a scale asked whether the leader could evaluate subordinates and recommend rewards, punishments, promotions, and demotions (Fiedler, Chemers, & Mahar, 1976). Schriesheim (1979a) found the group-atmosphere scale to be free of social desirability, but the positional-power scale correlated .42 with social desirability.
Meaning of Situational Favorability. For Fiedler (1978), situational favorability implied that leaders were certain that their decisions and actions would have predictable results, would achieve the desired goals, and would satisfy the leaders. At the favorable extreme and the unfavorable extreme, the leaders know where they stand in relation to their groups. In between, relations are more cloudy for the leaders.
Schriesheim and Hosking (1978) found a number of problems with the measurement of situational favorability. The three variables were assumed to interact in a relatively simple way to determine the amount of influence the leader had over the group, an assumption subsequently supported by Beach and Beach’s (1978) results. However, although Fiedler (1978) acknowledged the importance of other variables, he relied on just the aforementioned three among the many possible variables of consequence (Filley, House, & Kerr, 1976).
Between 1953 and 1964, Fiedler and his associates studied the effectiveness of leadership in a variety of groups and tested a contingency hypothesis from the results of those studies. Fiedler (1964) plotted the correlations and their medians between LPC scores (actually ASo) and group performance for the different octants—the different levels of situational favorability. Each plotted point in Figure 19.3 represented an obtained correlation between the leaders in a particular study in a designated octant of situational favorability for the leaders and the effectiveness of their groups. A positive correlation indicated that high-LPC (relations-oriented) leaders coincided with more effective groups. A negative correlation showed that low-LPC (task-oriented) leaders ran more effective groups. A positive median correlation for all analyses completed in a designated octant denoted the extent to which high-LPC leaders performed more effectively than low-LPC leaders. A negative median correlation disclosed that the low-LPC leaders were superior for a designated octant. Fiedler theorized that the curvilinear relation (as seen in Figure 19.3) was an indication that low-LPC leaders were more effective than high-LPC leaders in very favorable and very unfavorable situations (e.g., octants I and VIII), whereas high-LPC leaders were more effective in situations of intermediate favorability (e.g., octants IV and V).
Early on, Fiedler (1971b, 1978) was able to review efforts to validate the contingency model.22 The empirical investigations included field studies, field experiments, laboratory experiments, and octant analyses. Many more reviews followed (among them Ayman, 2002).
Field Studies. Field tests validating the model were completed with basketball teams, student surveying teams, bomber crews, tank crews, open-hearth shops, farm-supply cooperatives, training groups, departments of a large physical science research laboratory, a chain of supermarkets, and a plant that manufactured heavy machinery. W. A. Hill (1969a) reported analyses in a large electronics firm with assembly-line instructors. Fiedler, O’Brien, and Ilgen (1969) worked with public health volunteer groups in Honduras. Shima (1968) studied Japanese student groups; Mitchell (1970b), participants in a church-leadership workshop; and Fiedler (1971c), trainees in an executive development program.
An example of the operational support of applied findings was Loyer and O’Reilly’s (1985) study of Ontario community health supervisors. In favorable situations on the group-atmosphere scale, units led by low-LPC (task-oriented) supervisors were more effective (according to nursing directors’ evaluations of the units) than were groups led by high-LPC supervisors. As predicted by the model, groups led by high-LPC (relations-oriented) supervisors, compared with those led by low-LPC (task-oriented) supervisors, were more effective in situations that were moderately favorable to the supervisors. A similar confirmatory pattern was reported by Wearing and Bishop (1974) for the LPC scores of leaders of U.S. Army combat-engineer training squads.
Kennedy (1982) reanalyzed data from 697 fire and military personnel in 13 studies. As the contingency theory postulated, low-LPC leaders did best, according to supervisors’ and observers’ evaluations, in very favorable and very unfavorable situations, and high-LPC leaders did best in the moderately favorable situations. However, Kennedy also observed that leaders whose LPC scores were intermediate were generally more effective than those whose LPC scores were high or low; and their effectiveness was relatively unaffected by the favorability of the situation.
Conclusions supporting the validity of the contingency model were most likely to be reached if the criterion measure of effectiveness was limited to superiors’ evaluations of the performance of high-and low-LPC persons in carrying out their tasks as leaders. Rice (1978b) reviewed the relevant correlations by octants and found that almost all predictions fit the model. Table 19.3 presents Rice’s results. However, Giffort and Ayman (1988) found that the contingency model was also supported when they used subordinates’ satisfaction with coworkers as a criterion of effective leadership. The outcomes were dependent on situational favorability, as expected, but two other measures of subordinates’ satisfaction (with the job and with supervision) failed to be sensitive in the same way.
Table 19.3 Extent to Which the Contingency Model Fits Obtained Correlations of LPC and Superiors’ Appraisals as a Function of Situational Favorability in Eight Octants
| Predicted Direction: | I Negative | II Negative | III Negative | IV Positive | V Positive | VI Positive | VII Positive | VIII Negative |
| Empirical Analyses: | ||||||||
| Correlation of superior’s appraisal and LPC in the direction predicted by the model | 14 | 1 | 18 | – | 12 | 0 | 2 | 16 |
| Total number of analyses | 17 | 1 | 18 | – | 12 | 1 | 2 | 16 |
SOURCE: Rice (1978b).
Field Experiments. A number of experiments and controlled field studies also tested the model. Fiedler (1966) studied 96 experimentally assembled groups of Belgian sailors, half of which were led by petty officers and half by recruits. Half the groups began with structured tasks (routing a ship convoy through 10 and then 12 ports); the other half began with unstructured tasks (writing a recruitment letter). The results were consistent with the contingency model. In a controlled experiment conducted by Chemers and Skrzypek (1972) at West Point, leaders were chosen on the basis of sociometric choices by the members to determine in advance whom the members would choose as a leader. Then half the groups were assembled with preferred leaders and half with nonpreferred leaders. This study, with carefully preselected leaders, replicated the predicted median correlations. The generally supportive results are displayed in Figure 19.4. Fiedler (1978) concluded that the results of field research on work groups almost uniformly supported the model but that the results of experimental group research were somewhat less supportive
Figure 19.4 Median Correlations between Leader’s Performance and Group Performance for the Original Studies, Validation Studies, and the Chemers and Skrzypek (1972) Study
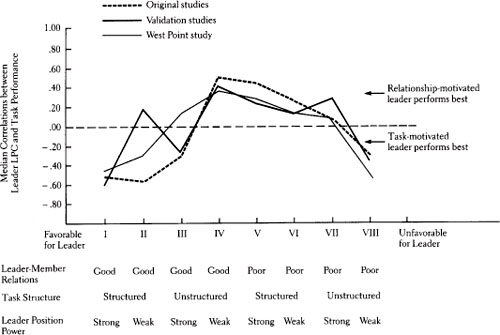
SOURCE: Fiedler (1997b).
Laboratory Experiments. Gruenfeld, Rance, and Weissen berg (1969) studied leaders under high, medium, or low support in experimental groups. They found that low-LPC leaders behaved in a more dominant manner than did high-LPC leaders, regardless of the level of group support, but especially under medium support.
Exceptions to the predicted relations were found in octant II (good leader-member relations and structured, weak power of the leader), where the correlations between LPC and group effectiveness in the laboratory studies were positive, rather than negative as predicted. The same results occurred in laboratory experiments by Hardy (1971, 1975) and Hardy, Sack, and Harpine (1973), who obtained LPC scores one or two weeks before their experiment. In two of these studies, leader-member relations were experimentally manipulated by assigning subjects to groups on the basis of preassessed sociometric scores. Rice, Bender, and Vitters (1980) conducted a laboratory study of 72 four-person temporary groups of West Point cadets using female and male leaders. The LPC scores related significantly to the groups’ performance of tasks, according to the contingency model, in several cases, although the investigators qualified their findings because they lacked direct measures of situational favorableness.
Singh, Bohra, and Dalal (1979) conducted four experiments with male Indian engineering students and demonstrated that a much better fit with the contingency model could be obtained if the situational favorability of the octants was placed on the horizontal axis according to how much the ratings of the quality of leader-member relations, task structure, and position actually contributed to situational favorability. They discovered that ratings of the power relations declined in importance to situational favorability, and ratings of leader-member relations increased in importance to situational favorability. They attributed the changes in the importance of the components of situational favorability to India’s return to democracy after the emergency rule by Indira Gandhi, which coincided with the repeated data collection. These shifts called into question Nebeker’s (1975) 4:2:1 fixed scheme for weighting the three variables that contribute to situational favorability.
Comparisons of the Octants. As shown in Table 19.3, a large number of studies have assessed the hypothesized relationships for designated octants. In these studies, usually efforts were made to select or create and compare two of the eight octants and to note the LPC of the leader in relation to the group’s effectiveness. Thirty-eight of these studies have been generally supportive of the contingency model.23
Supportive analyses of selected octants include dissertation studies of 122 child-study teams and their chairpersons in public schools (Jacobs, 1976), 64 groups of secondary-school juniors (Smith, 1974), and 40 task-oriented three-person experimental groups (Maher, 1976). Beebe (1975) manipulated the leader’s positional power by instruction, structure, and task assignments. Only good leader-member relations were involved to determine the effectiveness of 37 three-person groups for octants II and IV. The correlation of LPC and group productivity was .01 in octant II and .40 in octant IV, both nonsignificant. Nevertheless, the result for octant IV was near the usual results obtained in many other studies.
Unsupportive Results. Along with the field, laboratory, and octant studies that support the validity of the contingency model, there are a number of studies that have failed to find support for it. Lanaghan’s (1972) analyses of the effectiveness of 59 Illinois elementary schools and their principals and of the satisfaction of the teachers as a function of the behavior of the principals provided support for Fiedler’s contingency-model predictions in only six of the 80 situations analyzed (at the 5% level of confidence). In seven other situations, results for relations and task orientation were opposite to what would have been predicted by the model. Shiflett and Nealey (1972) compared the performance of three-man college groups with very high intellectual ability and with moderate ability in creative tasks in octants III and IV (weak and strong positional power). The results of the moderate-ability groups supported the prediction of the model, but those of the very-high-ability groups were contradictory and nonsignificant.
Two laboratory experiments by Graen, Orris, and Alvares (1971) and a field study by Fox (1982) of tax examiners in the Internal Revenue Service also failed to find the expected outcomes. But Fiedler (1971a) and Chemers and Skrzypek (1972) attributed these failures to methodological manipulations that were inadequate to test the model. The results obtained by Utecht and Heier (1976) and Vecchio (1977) also failed to support the model, but Fiedler (1978) found that Vecchio’s assignment of leaders to mixes of classmates whom the leaders ranked favorably and unfavorably was an invalid manipulation of good and poor relations. Isenberg (1981) found no support for the model in a study of communications. When the LPC scores of 62 Indian woolen mills supervisors were combined with task-structure and positional-power ratings of situational favorableness by Upmanyu and Singh (1981), they suggested that there was a need to reclassify the octants. A review by Rice (1981) concluded that followers were more satisfied when there were low-LPC (task-oriented) leaders in favorable situations and high-LPC (relations-oriented) leaders in unfavorable situations. Furthermore, contrary to the usual expectation that homogeneity of the leader and followers would be more satisfying to the followers, Rice noted that the followers’ satisfaction was highest when they and the leader had dissimilar LPC scores.
Some unsupportive studies only indirectly tested the contingency model. Fiedler (1977b) pointed out that much research designed to test the model failed to use favorable and unfavorable situations sufficiently different from each other to provide a valid test.
In studies that used only an approximate classification of situations—favorable, intermediate, or unfavorable to the leader—26 of 35 correlations of LPC and group effectiveness were as predicted by the model (Fiedler, 1971b). But critics faulted these conclusions. Some correlation coefficients were based on subsamples in the same study in which one subsample may have had good and the other may have had poor leader-member relations (Ashour, 1973a, 1973b; Graen, Alvares, Orris, & Martella, 1970).
A more general criticism was that most of the validations were based on concurrent measurements of LPC, leader-member relations, and group performance scores. Measures of leader-member relations and even LPC scores might be affected by the group’s performance (Vroom, 1976b). This cause-effect criticism could be leveled at a considerable percentage of research on leadership, not just at studies that have tested Fiedler’s model (Kerr & Schriesheim, 1974), but Katz and Farris (1976) actually found specific evidence that group performance could cause variations in leaders’ LPC scores.
Among 140 significant relations reported in the literature, Rice (1976) could find only one clear significant pattern relating the leader’s LPC score to the group’s effectiveness. When the leader described leader-member relations favorably, low-LPC leaders were clearly more effective; 23 of 26 significant effects (88%) under such conditions showed low-LPC leaders to be more effective than high-LPC leaders. When leaders described leader-member relations as poor, there was no clear pattern. This finding could be considered evidence that the group’s performance affected the leader’s judgment of the quality of relations with members. But a longitudinal study by Konar-Coldband, Rice, and Monkarsh (1979) of eight intramural basketball teams over a nine-week season concluded that previously assessed LPC scores of the leaders and the groups’ initial atmosphere did predict the groups’ subsequent performance according to the contingency model. Increments in effective performance beyond the initial levels were most likely for groups with low-LPC leaders and a good group atmosphere. An additional 7% of the variance in effective performance was accounted for by the interaction of the groups’ previous atmosphere and leaders’ LPC scores. The investigators also found that 10% of the increment in the groups’ atmosphere beyond the initial levels was accounted for by LPC interacting with the groups’ initial performance. They concluded that a systems approach that allows cause and effects to flow in both directions is required.
Differences in Octants. As was noted earlier, octant II, in toto, yielded mixed and widely diverging results. However, Fiedler (1978) argued that octant II, which requires a structured task with a powerless leader, may be created experimentally but is unlikely to exist in the field. Fiedler (1978) suggested that leaders who are placed in such circumstances will find the situation unmanageable. This suggestion, of course, fails to explain what is causing the varying results of octant II. A more important question is this: why is octant II, for example, less favorable to a leader than is octant III, since in both octants two of three variables favor the leader? What is required is differential weighting of the variables. The difference in task structure between octant II and octant III must be given more weight toward favorability than the leader’s positional power as weak or strong. This weighting was provided by Nebeker (1975) and Beach and Beach (1978). However, except for permitting the graphics to remain the same, a rationale and evidence are needed to support the logic that task structure is twice as important to a leader’s situational favorability as the power of the leader’s position. The same problem exists between octants IV and V, for which leader-member relations must be given more weight than task structure (as has been done).
Variations in Results. Empirically troublesome to some critics is the wide divergence of individual correlation coefficients in each octant, as can be seen in Figures 19.3 and 19.4. The median correlation for octant IV, for instance, may be .40, but the results that contribute to the median may range from .00 to .71. Another problem for which explanations are offered, but not necessarily accepted, is how to interpret some of the sudden shifts—say, from octant III to octant IV of the median correlation of –.29 to the median correlation of .40. Hosking (1978) believed that the most supportable inference about all octants except octant I is that the median correlations are random departures from a true correlation of zero. Schriesheim and Kerr (1977b) agreed, in a review of additional studies. Schriesheim and Hosking (1978, p. 500) concluded:
When the relevant studies are critically examined, and a distinction [is] drawn between those that constitute adequate tests of the model and those that do not, the results are far from encouraging. Examining both the size and direction of the correlations in each of the eight octants of the situational favorableness dimension, reveals that Fiedler’s model really has little empirical support.
However, Strube and Garcia (1981), using R. Rosen-thal’s (1978, 1979a) meta-analyses of the contingency model, thought that all but octants III and VII in Fiedler’s original validation were supportable, but they ignored octant VI. Strube and Garcia identified 33 analyses from which the model was built and 145 subsequent tests of the validity of the model. A meta-analysis of these data strongly supported the model’s validity. Vecchio (1983) believed that Strube and Garcia had used a biased sample of studies and suggested a need to qualify the conclusions they had reached, but Strube and Garcia (1983) rejected Vecchio’s criticisms. Then, a less extensive meta-analysis by Peters, Hartke, and Pohlmann (1985) provided additional but somewhat less strong support for the validity of the model than Strube and Garcia obtained. Finally, after including almost twice as many validation correlations as had been listed by Strube and Garcia (1981) and Peters, Hartke, and Pohlmann (1985), Nathan, Haas, and Nathan (1986) rejected the earlier supportive conclusions of both previous meta-analyses. Nathan, Haas, and Nathan based their rejection on the fact that the set of validity coeficients within each octant varied much too much. They stated:
The confidence intervals are too broad to allow any one to expect, as the theory predicts, that low LPC leaders would be effective when situational favorability was good and high LPC leaders would be effective when situational favorability was moderately poor. Worse, the fairly stable finding in Octant II, that when situational favorability is very good, high rather than low LPC leaders will be effective is directly opposite to what the theory predicts. At best, one can conclude that over half the time, correlations are above and below zero as predicted. (p. 10)
Fiedler (1971a, 1971b, 1973, 1978) systematically dealt with many of the earlier criticisms of his methodology. These included the statistical strength of evidence, of the conceptual meaning of the three variables defining situational favorability, and of the construct assessed by the LPC scales. He even anticipated many of the criticisms (Mitchell, Biglan, Oncken, & Fiedler, 1970). As T. R. Mitchell (1972) noted, if the validity of the hypothesized curvilinear relationship is to be tested, all eight octants must be assessed in a given study. Despite the difficulty of obtaining sufficient participants when the group, rather than the individual, is the unit of analysis, research designs must have adequate sample sizes and resulting statistical power (T. R. Mitchell, 1972).
Although the contingency model may still appear to be supported by a wide array of studies, the meaning of LPC remains unclear and controversial, and no adequate theoretical explanation of its effects has been presented. Moreover, the variability of the findings and the reverse results with octant II continue to undermine confidence in it. Yet analytically, the model compares favorably with alternative models.
Comparison with Alternative Contingency Models. Schriesheim, Tepper, and Tetrault (1988) compared two alternative contingency models with Fiedler’s contingency model. In the declining-octant model (Shiflett, 1973), the performance of both high-and low-LPC leaders should decline systematically from octant I to octant VIII as the situation becomes less favorable to the leader. In the declining-zone model, octants I, II, and III are most situationally favorable; octants IV, V, VI, and VII are the next most favorable; and octant VIII is the least favorable to the leader.
Fiedler’s contingency model predicts that high-LPC leaders will be more effective in octant IV than in octant I, II, III, or octant VIII. Four tests of the significance of the difference can be made to compare octant I with each of these other octants (II, III, and VIII). Four such tests can also be made for octants V against octants I, II, III, and VIII. Also, four such tests can be made for octant VI and four more for octant VII. A comparable number of tests across pairs of octants can be made for low-LPC leaders who are predicted by the contingency model to be more effective in octants I, II, III, and VIII and less effective in octants IV, V, VI, and VII. Similar tests can be made for the rival models. In the declining-octant model, effectiveness is expected to decline from octant I to octant VIII. Since octant I is the most favorable situation, it should coincide with the leader’s being more effective than in each of the other octants; octant II should yield better performance than each of the remaining octants; and so on.
Each octant was compared individually with each other relevant octant by Schriesheim, Tepper, and Tetrault (1988) using meta-analytical procedures. The data came from a variety of published investigations. Of 245 tests of the differences between pairs of octants, 62% fit the contingency model; of 281 tests, 54% fit the declining-octant model; and of 274 tests, 51% fit the declining-zone model. The investigators concluded that, overall, these results supported the greater validity of Fiedler’s contingency model than of the proposed alternatives.
In a cross-cultural situation, Chemers (1969) trained leaders in the culture of their followers or in the geography of the country. Low-LPC leaders were more supportive and developed a more enjoyable group atmosphere in the culture training situation than high-LPC leaders did in the geography-training situation. These findings agreed with Fiedler’s model in that in favorable situations, high-LPC leaders should tend to be concerned with the task whereas low-LPC leaders should tend to behave in a relationship-oriented manner. In unfavorable situations, the high-LPC leaders should be concerned with relations and the low-LPC leaders with tasks (Cummins, 1970).
Arrangements. Whether members of groups were co-acting (performing side by side) or interacting did not seem to influence the findings of Hunt (1967) or W. Hill (1969a), which were generally supportive but nonsignificant.
Verbal Behavior. The behavior, as well as the effectiveness of followers, depends on the favorability of the situation and the leader’s LPC. Fiedler (1967a) found that group members made more task-related comments in favorable situations and fewer such comments in unfavorable situations under a high-LPC leader. The reverse was true for group members under the low-LPC leader.
Furthermore, the group made more person-related comments in the unfavorable situation and fewer such comments in the favorable situation under the high-LPC leader.
Followers’ LPCs. The followers’ LPCs also may make a difference. Schuster and Clark (1970) studied first-and second-level supervisors in post offices. Under high-LPC second-level supervision, high-LPC first-level supervisors were better satisfied than their low-LPC peers. With low-LPC second-level supervisors, the satisfaction of high-and low-LPC first-level supervisors did not differ.
Hunt (1971) assembled groups—each with a manager, two supervisors, and two workers—to play a business game. Although the effects of manager-supervisor interaction did not account for variance in the teams’ performance, the effects of the manager and supervisor alone were each significantly related to the performance of the workers. Low-LPC managers and high-LPC supervisors had the best-performing groups; high-LPC managers and low-LPC supervisors had the poorest-performing groups. The two-level interaction effect also predicted the satisfaction of workers better than did either LPC effect alone.
Leaders’ Self-Monitoring. Ayman and Chemers (1991) found that among 83 Mexican middle-level managers, the predictions of the contingency model were valid only if the managers were low in self-monitoring. The managers rated their self-monitoring behavior. Their 184 subordinates rated satisfaction with the supervisors, coworkers, and the work. The predictions from the model failed to work when the managers rated themselves high in self-monitoring, but the results did conform to the contingency model when managers rated themselves low in self-monitoring.
Leaders’ Experience. The leaders’ experience with leadership changes the situational favorability (Bons & Fiedler, 1976). With continued experience, tasks become more routine and leaders get to know their subordinates and usually can work better with them. In addition, the leaders learn the expectations of the higher authority.
Although the effectiveness of leaders, as a whole, does not necessarily improve with experience (Fiedler, 1970a, 1972a), the contingency model predicts that leadership experience will have different effects on the performance of high-and low-LPC leaders. In a study of infantry squads by Fiedler, Bons, and Hastings (1975), 28 sergeants who served as squad leaders were evaluated at the time the units were formed and after they had five months of experience. The sergeants’ judgments about their situational favorability increased over the five months, as expected. The high-LPC leaders performed better at first when they had little experience and situational favorability than they did five months later. As predicted by the model, the low-LPC leaders performed relatively better after they had five months’ experience and gained situational favorability. Similar results were found by Godfrey, Fiedler, and Hall (1959) for the general managers of 32 consumer cooperatives; by McNamara (1968) for Canadian elementary and secondary school principals; and by Hardy and Bohren (1975) for college teachers. Furthermore, the training of leaders based on the contingency model generates similar dynamics and results (Chemers, Rice, Sundstrom, & Butler, 1975; Fiedler, 1972a).24
Organizational Shifting. Changes in organization can have similar effects on situational favorability, as can increased experience. Bons and Fiedler (1976) tested the contingency model using experienced leaders of army squads who were given new subordinates, new bosses, or new jobs.
In the stable condition of continuing with the same bosses, subordinates, and jobs, the experienced leaders who were low in LPC were unaffected, but the performance of experienced high-LPC leaders declined. When a change of boss, subordinates, or job moved leaders from moderate situational favorability to low situational favorability, the low-LPC leaders again did relatively better.
Fiedler’s Contingency Model offers a remedial plan for increasing the effectiveness of leaders that is different from all other theories of leadership. Blake and Mouton (1964), Hersey and Blanchard (1969b), R. Likert (1977a), and Vroom and Yetton (1974) would see a need to educate leaders to improve their styles. For Blake and Mouton, improvement would be toward the one best style: 9,9. For Hersey and Blanchard, it would depend on the stage in the group’s life cycle and the followers’ maturity. For Likert, it would be toward a democratic style. For Vroom and Yetton, the decision process to use would depend on the problem situation. But Fiedler (1978) suggested an entirely different course of action. Because a leader’s LPC is what matters, and because LPC is not very changeable, either one must identify and select leaders of high or low LPC to fit given situations, or leaders need to know their LPC scores and in what situations they are most effective—then they can try to change the situation, rather than themselves. Fiedler argued that changing leader-member relations, the structure of the task, or a leader’s positional power is easier than changing a leader’s personality. Leader Match (Fiedler, Chemers, & Mahar, 1976), a training program that tries to do so, is discussed in Chapter 34. The contingency model also has implications for leadership under stressful conditions, which is examined in Chapter 28.
In general, the leader who is more highly rated by superiors and peers, who is most satisfying to subordinates, and whose approach results in the good performance of the group is likely to be both relations-oriented and task-oriented in an integrated fashion. Blake and Mouton’s theory is the strongest endorsement of this conclusion.
However, many situational contingencies have been found to moderate the effects. These contingencies include the makeup of the subordinates and the organizational constraints, tasks, goals, and functions in the situation. The popular but underresearched and controversial Hersey-Blanchard model has focused on the followers’ psychological maturity and job experience as the most important contingencies affecting the leader’s need to be task-oriented or relations-oriented.
According to Fiedler’s widely researched contingency model, (1) task orientation (as measured by LPC) works best in situations which are either extremely favorable or extremely unfavorable to the leader, or in which the leader has very high or very low control; and (2) relations orientation works best in situations that are moderately favorable to the leader or in which the leader has moderate control. Despite a vast array of publications on the reliability, validity, and meaning of LPC and situational favorableness, and despite tests supportive of the model, the validity of the model continues to be disputed. Less controversial are the equally widely researched concepts and behavioral measures of the leaders’ consideration of their subordinates and the leaders’ initiation of structure for their subordinates, the subject of Chapter 20.