CHAPTER 9
LONG-RANGE FINANCIAL PLANNING AND CAPITAL BUDGETING

  1. 9.1 INTRODUCTION
  2. 9.2 PLANNING FOR THE FUTURE
    1. (a) Importance of Long-Range Financial Planning
    2. (b) CFO’s Role in Financial Planning and Capital Budgeting
    3. (c) Deferred Maintenance: A Cautionary Tale
    4. (d) Long-Range Financial Planning Process
    5. (e) Financial Planning Basics
    6. (f) Develop a Financial Model
    7. (g) Project and Reevaluate Target Liquidity
    8. (h) Based on Our Financial Policies and Structure, How Fast Can We Grow?
  3. 9.3 FINANCIAL EVALUATION OF NEW AND EXISTING PROGRAMS
    1. (a) Simple Portfolio Analysis
    2. (b) Advanced Portfolio Analysis
    3. (c) Annual Necessary Investment
  4. 9.4 CAPITAL BUDGETING: FINANCIAL EVALUATION OF PROJECTS THAT ARISE FROM EXISTING PROGRAMS
    1. (a) Example 1: Net Present Value and Benefit-Cost Ratio Illustrated
    2. (b) Example 2: Equivalent Annual Cost Illustrated
    3. (c) How to Manage the Total Capital Budget
    4. (d) Capital Budget and Capital Rationing
    5. (e) Rationing the Capital
  5. 9.5 FINANCIAL EVALUATION OF MERGERS, JOINT VENTURES, AND STRATEGIC ALLIANCES
    1. (a) Mergers and Acquisitions
    2. (b) Motives for Mergers and Acquisitions
    3. (c) Partnerships, Joint Ventures, and Strategic Alliances
    4. (d) Strategic Alliances
  6. 9.6 FINANCIAL PLANNING AND CAPITAL BUDGETING IN PRACTICE
  7. 9.7 CONCLUSION
  8. APPENDIX 9A: CASE STUDY: KIAWAH ISLAND COMMUNITY ASSOCIATION
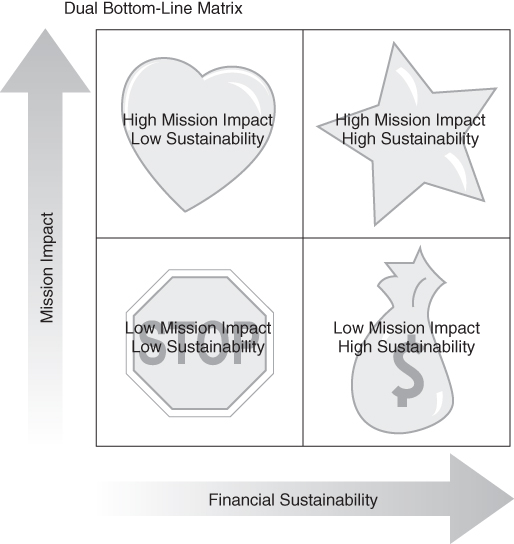
  9. APPENDIX 9B: EVALUATING SOCIAL ENTERPRISES

9.1 INTRODUCTION

If we consider that nonprofit boards carry a primary responsibility for the fiscal life of the organizations that they govern, then it follows that long-range financial planning is a primary method for carrying out that responsibility.1 Very often, the fiscal responsibility role is viewed within the frame of the annual budget but we postulate that nonprofit organizations need to reframe this to incorporate long-range planning.2 This chapter outlines the financial leaders' role in the long-range financial planning and capital allocation processes. Managing growth is one of the reasons organizations plan and do financial evaluations. The chapter begins by developing the financial plan for existing and already approved programs, then shows how the financial evaluation of new program alternatives such as new ventures are made. We then demonstrate how you may evaluate individual capital expenditures made as part of program implementation. A financial approach to evaluating mergers and acquisitions, partnerships, joint ventures, and strategic alliances follows. We conclude with a survey of actual practices in the areas of long-range financial planning and capital budgeting, to help you see what your peer organizations are doing.

Rhode Islanders Sponsoring Education (RISE) learned the value of long-range financial and program planning when its service demands outstripped its ability to meet those demands. A private nonprofit agency established in Rhode Island to educate the children of imprisoned women as a means of attacking the intergenerational cycle of poverty and violence, it established an 8-member committee (from its 25-member board of directors) to revisit its mission, vision statement, and goals. Then the committee established a long-range plan, which included goals, objectives, and action plans for RISE's future finances, as well as for its evaluation strategies, its role in the network of local nonprofit service providers, its public relations, and its staff and board structure. The six-page long-range plan specifies a cap on how many new students can be admitted each year to the program, with the cap based on the amount of funds raised from sponsors.

Before developing the plan, RISE (as would many nonprofits) took as many students as applied and hoped to later raise the needed funds. Equally important, the plan specified what would and would not be its core services. One of its board members, whose school also partners with RISE, praises it: “One of the beautiful things about RISE is that it doesn't try to be all things to all people.”3 Notice from this example that the strategic plan and the long-range financial plan should be consistent. As a side note, RISE also created a new associate director position, hiring an experienced Salvation Army manager who professionalized the agency by installing new systems and procedures.

Despite such success stories, some nonprofit managers and board members continue to devalue the planning process, perhaps because of (1) a philosophy that planning techniques are corporate-world methods that do not fit the values and philosophies of the nonprofit sector, (2) the often-changing nature of the environment within which they operate, (3) ignorance, or (4) a simple breakdown in their implementation of planning and evaluation techniques. Many nonprofit organizations create strategic plans but do not incorporate long-range financial planning along with program and fundraising plans. Faith-based organizations, for example, devalued planning skills in the early 1990s, partly because these techniques appeared to go against biblical admonitions to have faith and not be overly concerned about the future. Recent evidence, however, indicates this is changing, as more churches and other ministries are using long-range planning techniques.4

Executive directors/chief executive officers (EDs/CEOs) from a broad range of nonprofits indicate that, after fundraising, grant writing, and volunteer administration, the areas that they rate the highest for training needed are planning – which would include program and financial planning – and cooperative ventures.5 We address both of these topics in this chapter. Partly to deal with these sorts of knowledge/skill gaps, the Panel on the Nonprofit Sector (convened by the Independent Sector) recommends that organizations have individuals with some financial literacy on their boards.

Nonprofit financial planning was formerly limited mostly to the single-year budgeting process. This is neither strategic nor wise, but mere “bean counting.” To plan successfully, an organization must have a strategic thinker at its helm and an environment in which it infuses strategic, long-range thinking into all of its endeavors. Regardless of line and staff relations, everyone from the executive director down – and especially the chief financial officer (CFO) – must reframe their understanding of financial leadership and adopt a planning philosophy.

Planning is not just an extension of the budgeting process. It starts with good strategic planning, which identifies the key issues to which the appropriate numbers can later be attached, as we noted in Chapter 3.

We focus on formal planning, in that most business-sector studies have documented that organizations using formal plans tend to outperform those using informal plans. In the nonprofit arena, a recent study of churches indicates that those engaging in formal planning experienced greater growth in both attendance and finances.6

As nonprofits begin contracting with governmental agencies, they find that government oversight places emphasis on planning and reporting. Yet, as noted in the Indiana nonprofit survey done by Grønbjerg and colleagues, 30 percent of nonprofits refer to strategic planning as a major challenge, and 43 percent say that obtaining adequate funding is a major challenge.7 Considering these results, it is no surprise that long-range financial planning is a difficult task, one that many nonprofits choose not to undertake. But it is a vital part of proficient financial management. With that backdrop, let's turn to the long-range financial planning and capital project evaluation techniques.

9.2 PLANNING FOR THE FUTURE

(a) IMPORTANCE OF LONG-RANGE FINANCIAL PLANNING.  A best practices study of community associations documented the importance of long-term financial planning, listing both a plan for major assets (long-term financial plan) and for revenues and expenses (long-term operating budget) in its profile of best planning practices:

  • Establish a long-term financial plan for the association's assets (cash, accounts receivable, replacement fund, investments, etc.) that is reviewed and revised annually.
  • Develop written, board-approved investment policies and procedures.
  • Commission a reserve study and/or update current reserve study at least every three years and review the report annually.
  • Prepare a long-term operating budget covering the next three to five years.
  • Include reasonable reserves for future major repairs and replacement of common facilities in assessments as determined by the association's most recent reserve study.8

Businesses call the plan for major assets a pro forma balance sheet, and the long-term operating budget is a pro forma income statement. Think of pro forma as “projected”; its literal meaning is “as a matter of form.”

One financial policy that should be addressed periodically, as a best practice, is the specification of the levels of cash reserves held as operating reserves and as strategic reserves. Operating reserves represent money for a rainy day, and buffer against revenue shortfalls or unanticipated expense spikes. Strategic reserves may be called a building reserve in your organization – 44 percent of surveyed Denver-area nonprofits have a building reserve, for example.9 We highlight the needed total cash reserves in our discussion of the target liquidity level, one of the outputs of a well-constructed financial plan.

In addition to helping you establish the appropriate level for your target liquidity level, consisting primarily as cash reserves (including short-term investments), we see at least four other advantages for organizations that engage in long-range financial planning:

  1. It enables them to better determine the appropriate amount of net assets, or equity, in the organization's capital structure (which also implies how much debt the organization may carry; see Chapter 10).10
  2. They more fully benefit from strategic planning, and are able to mesh the strategic plan with financial policies and decisions and with yearly operating budgets. This is key in producing plans that are achievable and can lead to sustainability.
  3. It enables them to portray themselves as well-managed organizations to banks, bond investors, and foundations and agencies providing government grants; in fact, one consultant counsels philanthropists that one way to reduce the risk of their investment in nonprofits is to ensure that recipient organizations are implementing “financial plans for the long-term health of the organization.”11
  4. These organizations are better able to determine a reasonable growth rate for the organization's activities.

A late 2005 survey of Oregon-based nonprofits found that, even though fundraising efforts were deemed successful, 30 percent of the nonprofits were forced to reduce services to meet operational costs, and most nonprofits were concerned about rising healthcare costs for employees, increased costs of other insurance, and increased regulation for nonprofits.12 Anticipating negative trends such as these, by including their likely effect on the organization's financial position, would not only cause the nonprofit to hold a higher target liquidity level (to avert service cutbacks), but also help the organization prepare itself for the possible cost increases that lie ahead. The financial plan helps your organization see the effects of these trends on its financial position.

(b) CFO'S ROLE IN FINANCIAL PLANNING AND CAPITAL BUDGETING.  In his classic article “Strategy for Financial Emergencies,” Gordon Donaldson declares, “[T]he financial executive's primary managerial responsibility is to preserve the continuity of the flow of funds so that no essential decision of top management is frustrated for lack of corporate purchasing power.” Although written for business financial executives, Donaldson's assertion applies equally to nonprofit finance officers. The board treasurer and the organization's CFO share responsibility for ensuring that the nonprofit plans its financial future and allocates scarce capital to the best uses. Regardless of whether the treasurer is the CFO, he or she retains ultimate responsibility for these processes, so at a minimum the treasurer must oversee this important aspect of proficient financial management. As we have emphasized, doing this includes projecting the organization's liquidity and accumulation of or maintenance of the target liquidity level. It also entails working closely with your chief development officer, assuming your revenues include annual or deferred giving. Beyond this, there are several key components to the CFO's responsibility:

The CFO's role seems to be threefold. First, as part of the senior management team, the CFO contributes fully in overall strategic planning for the organization, always with an eye on the financial ramifications. The second role is to drive the capital planning process, maintain the rigor around assessment, keep everyone honest, and serve as “quarterback” of the capital planning team. The third role is the quantitative role: understand debt capacity, provide a consistent methodology for assessing return on individual projects, and generally support the decision-making process.13

We developed the strategic planning role in Chapter 3, and we shall return to evaluating debt capacity in the next chapter. Our focus in this chapter is to spell out the long-range financial planning process and the capital budgeting process.

(c) DEFERRED MAINTENANCE: A CAUTIONARY TALE.  Before entering into the long-range planning process, the CFO should evaluate the issue of deferred maintenance. The pressure on annual budgets to reduce costs often creates conditions where the organization decides to continue to operate aging assets while deferring maintenance costs and investments in new assets. This deferral may provide short-term budget relief, but an assessment of the risk involved in such a deferral should be undertaken in order to understand the long-term implications.14 The financial evaluation of risk looks at the annual operating costs as well as the potential fixed asset investment all within the more strategic context. In any case, deferred maintenance can have a detrimental outcome that must be carefully evaluated before such a decision is made.

(d) LONG-RANGE FINANCIAL PLANNING PROCESS.  Financial projections covering the next five years are developed in an exercise called long-range financial planning. These projections should be done periodically as part of the organization's strategic planning process. The main financial planning document should be based on all current programs as well as those future programs already approved. Later, planning scenarios can be developed to bring possible new programs or ventures into the picture. The purposes of the long-range financial plan are:

  • To tie financial resource requirements to the strategic plan (recalling both the enabling and constricting functions of finance)
  • To identify any future period with fund surpluses or, much more commonly, fund shortfalls
  • To determine approximate funding needs for the shortfall periods, which is the essential information the executive needs for planning capital campaigns, other special fundraising appeals, and endowment building
  • To identify the seasonal and cyclical aspects of the organization's cash flows
  • To bring together in one place all the interacting sources and uses of funds experienced by the nonprofit organization: operating, investing, and financing cash flows (which reflect your organization's “business model” – refer back to Chapter 3)
  • To build a financial contingency plan, or what Donaldson terms “a strategy for financial mobility”

We cannot emphasize too strongly the importance of doing a long-range financial plan. Not only will such a plan help a strong organization to become stronger, but it may spell the difference between survival and financial failure and dissolution for your organization. Often nonprofit organizations do a good job of selecting programs, but then fail to plan for the financial requirements of implementing those programs, leading a number of these organizations – especially private colleges – to fail.15

Averting a financial crisis from too-rapid or ill-advised expansion is well worth the expense and effort of long-range financial planning. An example to emulate here is Cedarville University (Cedarville, Ohio), which uses its strategic planning process to implement “managed growth.” Our chapter-opening vignette of RISE is another positive example.

Further, where programs are vital to the organization's mission but the financial plan indicates significant shortfalls, the ED/CEO is stimulated to search for other organizations to help share the load. Resource sharing may take place through a merger, acquisition, joint venture, or strategic alliance.

The degree of sophistication and level of detail in nonprofit organizations' financial planning varies. Many small organizations, and quite a few larger ones, do no formal long-range financial planning; this situation tends to indicate an organization whose overall financial administration process is poorly managed. Our Lilly study found that organizations not using “present and anticipated financial positions” to guide programmatic decisions tended to be those deficient in overall financial management.

Some of these organizations may even engage in strategic planning, but are in the dark about the funding feasibility of these plans and whether they need to begin arranging financing now or whether they can self-finance the program. Capital campaigns cannot be initiated and executed quickly. Other organizations have sophisticated, computerized financial models. Mostly these are larger organizations that can afford to devote staff and computer resources to the task or hire an outside consultant to develop the model. Many organizations, even those otherwise proficient in their financial management processes, fail to anticipate key events that could alter the future financial position of the organization. As a result, these organizations have no strategy for dealing with those events if and when they occur and no financial model with which to project cash flow. At bottom, proficient financial managers anticipate what could be, not merely what they think is the most likely financial future.

(e) FINANCIAL PLANNING BASICS.  Here's a simple approach to use to get started in financial planning. It is based on three vital inputs:

  1. The most recent three years of financial statements
  2. The capital budgets for the next five years, insofar as they are known. This should also include a lease-versus-purchase analysis for all assets under consideration. Leasing and alternative financing sources are covered in Chapter 10.
  3. Management and board financial policies regarding investments, debt, and minimum necessary liquidity

How might your organization assess its future capital spending needs? The best general approach is to first specify several categories of the external environment that will affect your organization's future (e.g., competition or regulations), then identify the specific external drivers that will be at work within those categories and that have relevance to your industry (e.g., youth services or performance arts). Then specify the internal goals that will best suit your organization to meet those anticipated developments in the external environment. Finally, detail the capital responses that your organization will have to make to achieve those internal goals: new or refurbished plant or equipment, enhanced information technology, renovation, expansion, upgrades to systems, training investments, increased research and development expenditures, multiyear brand- and image-building investments, and so on. Consult Exhibit 9.1 for a filled-out schematic for the hospital industry. The “shifting regulated and negotiated payment incentives” fits in the Technology/Regulation section as well, particularly regarding the dynamics around Medicaid.

Responses to External Drivers of Capital Need

Category External Drivers Internal Goals Capital Responses
Competition
  • Strategic efforts by other area hospitals
  • Emergence of specialty providers
  • Shift of volume to physician offices and other outpatient centers
  • Payer shifts of volume to lower-cost providers
  • Scarcity of medical professionals
  • Shifting regulated and negotiated payment incentives
  • Protect existing volume and market share
  • Create opportunities to expand market share
  • Avoid loss of profitable programs to specialty providers
  • Attract and retain valued employees and physicians
  • Retool programs that become unprofitable as a result of shifts In reimbursement
  • Facilities renovation or construction
  • Equipment purchases and upgrades
  • Automation and digital capabilities
  • Information systems upgrades
Technology/Regulation
  • Advances in technology
  • Advances in pharmaceutical therapies
  • Shift in procedures to outpatient settings
  • Bioterrorism preparedness
  • Privacy and security
  • Retain key physicians
  • Improve physician and patient satisfaction
  • Enhance quality of care and patient safety
  • Comply with regulatory mandates
  • Maintain community safety net services for health emergencies
  • Equipment purchases or upgrades
  • Process redesign around new equipment and treatment modalities
  • Renovations and expansion of ambulatory capacity
  • Joint ventures around ambulatory capacity
  • Implementation of digital capabilities
Consumers
  • Rise of consumerism in selection of healthcare providers
  • External reporting of quality and safety data
  • Extension of life expectancy
  • Aging population that uses more services
  • Shifting regional demographics
  • Invest in programs and services for the changing needs of an aging population
  • Communicate quality externally
  • Report external information accurately
  • Facilities renovation or construction
  • Equipment purchases or upgrades
  • IT/IS enhancements to reporting

Source: Financing the Future, Healthcare Financial Management Association, Used by permission.

Exhibit 9.1 Capital Planning Example Using the Hospital Industry

Armed with these inputs, the financial manager can obtain or develop operating forecasts that will enable the formulation of simple long-range financial plans. Although the next year may be somewhat detailed (depending on whether the operating budget has been developed yet), years 2 to 5 will show little detail – possibly only total revenue and total expense of operations.

The example that follows illustrates the long-range financial plan and the fact that the planning process, when used properly, takes at least two passes or iterations. The first pass takes the strategic plan and preexisting funding strategies as givens and determines each future year's funding surplus or shortfall. The feedback from this exercise provides the organization's managers and board with needed input for possible revisions of the strategic plan and/or the funding strategy, which is the second pass.

To the extent surpluses appear in forward years, the management team can choose whether to:

  • Develop program initiatives (expand present programs or add new ones)
  • Reduce debt
  • Increase investment in existing staff or technology
  • Build liquidity (if appropriate, based on financial policies)

Where shortfalls appear, organizations can choose whether to

  • If they have large cash reserves, draw these down
  • Reduce discretionary expenses
  • Redirect funds from noncore to core (essential to mission) programs
  • Sell investment securities from portfolio
  • Initiate capital campaign (if capital spending is the reason for the shortfall)
  • Increase interest revenue through the use of appropriate investment vehicles and/or building of endowment
  • Increase rental and/or unrelated business income revenue
  • Increase investment in fundraising for operations – annual campaign

If there are perpetual problems with shortfalls, permanently reduce expenses and work to initiate or increase investment in planned giving fundraising or make other business model changes.

At a minimum, do a projection of the statement of cash flows (SCF) (you may wish to refer to Chapter 6 for a review of this statement). To keep things even simpler, enter the last five or six years of statement of activities data into a computer spreadsheet. Then let the spreadsheet program do a straight-line projection of total revenue (income) and expenses. Exhibit 9.2 shows such a projection using the actual financials of an anonymous ministry organization.

Statements of Activities of a Nonprofit Organization
2012 2013 2014 2015 2016 2017 Projected 2018 Projected
2019
Projected
2020
Projected
2021
Projected
2022
Income:
Contributions $5,121,652 $5,088,913 $5,721,854 $5,725,263 $5,852,144 $6,618,502 $6,665,790 $6,945,143 $7,224,496 $7,503,849 $7,783,202
Net gain on disposal of fixed assets 29,733 214,717 85,714 34,816 42,641 78,749
Investment income 193,319 194,318 227,973 275,187 279,756 364,352
Sales less cost of goods sold 128,116 142,991 149,530
Total Revenue & Support $5,344,704 $5,497,948 $6,035,541 $6,163,382 $6,317,532 $7,211,133 $7,286,914 $7,627,449 $7,967,985 $8,308,520 $8,649,055
Expenses:
Program Activities:
Church growth, evangelism $1,618,616 $ 1,409,014 $ 1,526,571 $ 1,678,493 $ 1,873,124 $ 2,456,467
Media, translation 548,411 469,713 575,519 697,491 875,791 785,726
Theological, church leadership training 404,940 356,640 414,600 410,305 360,691 289,019
Education 272,770 199,141 217,979 246,747 334,175 302,764
Field administration 207,196 192,317 228,145 297,591 347,325 291,803
Appointees 206,719 209,831 133,666 108,690 108,726 94,001
Homeland ministries, furlough 671,830 760,737 726,156 615,136 743,129 866,198
Relief 96,276 44,915 118,758 192,541 133,910 434,442
Service to missionaries 71,872 59,049 137,027 135,292 182,386 137,644
Medical 40,448 41,616 38,114 27,428 57,871 40,639
Subtotal:
Program exps. $4,139,078 $ 3,742,973 $ 4,116,535 $ 4,409,714 $ 5,017,128 $ 5,698,703 $ 5,712,065 $6,052,459 $ 6,392,852 $ 6,733,246 $7,073,639
Supporting activities: Management
and general $ 814,414 $ 996,659 $ 864,530 $ 1,046,032 $ 1,149,552 $ 1,210,873
Fundraising Subtotal: 81,585 140,880 193,685 188,453 199,089 172,759
Support exps. 895,999 1,137,539 1,058,215 1,234,485 1,348,641 1,383,632 $ 1,501,193 $1,593,985 $ 1,686,778 $ 1,779,570 $1,872,363
Total expenses $5,035,077 4,880,512 5,174,750 5,644,199 6,365,769 7,082,335 7,213,258 7,646,444 8,079,630 8,512,816 8,946,002
Excess (deficiency)
of income over expenses
309,627 617,436, 860 791 519,183 −48.237 128.798 73.656 (18,995) (11 1,6 451) (204,296) (296,947)
Unadjusted net assets — end of year* $4,388,295 $ 5,005,731 $ 5,866,522 $ 6,385,705 $ 6,337,468 $ 6,466,266 $ 6,539,922 $6,520,927 $ 6,409,282 $ 6,204,985 $5,908,039

* Shows what net assets would be without adjustments or transfers.

Source: This table uses actual data for a ministry organization, but the organization's name has been withheld and the years changed. Projections were done by author using Microsoft Excel. This is done by simply entering the numbers shown for contributions, then highlighting the range, and clicking and holding down the drag handle on the bottom right of the range and dragging it to the right over several cells.

Exhibit 9.2 Financial Projection Providing Early Warning of Financial Deterioration

Notice the deteriorating trend; if the trend had continued, the organization would have ended up out of business. Simply knowing that this is what will occur if corrective action is not taken is well worth the time and effort of the entire planning exercise. If you were the CFO of this organization, and its financial policies rule out the use of short-term debt, how might you close the gap in future periods?

As you reflect on the situation, you will likely identify three situational factors that generally act as constraints on your actions:

  1. You cannot draw down liquidity without violating the minimum liquidity financial policy (target liquidity level).
  2. Short-term debt is forbidden (not uniformly but commonly, in nonprofits).
  3. All programs are core (so no program may be eliminated or severely curtailed).

The financial manager might recommend these possible courses of action to the ED/CEO and the board:

  • Reduce discretionary expenses.
  • Increase the investment in fundraising.
  • Increase rental and unrelated business income.
  • To the extent possible, shift investment portfolio to higher-yield investment vehicles (within risk parameters) and/or, once you get large enough, build endowment.
  • Revisit the minimum liquidity target to see if it should be set higher in the future.

The planning exercise is valuable because when shortfalls are projected, they provide early warning of impending financial shortages, and when surpluses are expected, we may consider opportunities to expand or enhance the mission or build endowment. Furthermore, as noted earlier, you may engage in contingency planning, selecting for further study events that are not expected. Although they are not considered “most likely,” and therefore are not incorporated into your normal financial plan, these events may still be quite probable and they could have a significant impact on your revenues, expenses, assets, or liabilities. High-profile natural disasters would be a prime example. These typically siphon off significant donation funding from many non-relief US nonprofits, especially food banks, homeless shelters, and after-school programs.16

(f) DEVELOP A FINANCIAL MODEL.  The next phase in your financial planning process is to develop a full-blown financial model of your organization, its operations, its asset requirements, and how these will be financed. A financial model may be defined as “the financial representation or model of how an organization works and functions, created in such a way that it can productively be used as a means to simulate the real world.”17 This more complete portrait of your organization's financial future adds significant value to the simple forecast we profiled earlier by:

  1. Showing asset requirements of growth (or scale-backs), along with the need for financing those asset requirements, by projecting key aspects of the statement of financial position (SFP).
  2. Incorporating relationships between the various financial accounts into cause-and-effect relationships, which is easily done even in a financial spreadsheet model.
  3. Showing the true effects of revenue, expense, liability, and net asset changes on the target liquidity level, by backing out noncash effects of depreciation, amortization, and other accounting adjustments such as losses on discontinued operations or restructuring charges.
  4. Identifying knowledge and information gaps that must be addressed for the organization to have a better understanding of its financial interrelationships and cash flows – some of which will be discovered in the processes of modeling points 1, 2, and 3. Others will be unveiled as banking, payment system, and regulatory policies and constraints (Chapter 11) are built into the model and as loan covenants (Chapter 10) and restricted cash and other restricted net assets are identified in the model.
  5. Allowing a view of the financial position, funding need, and revenue coverage of expense changes when any single input to the model changes in value. This what-if scenario analysis function is the most valuable feature of a financial model, in the view of most users. See Appendix 9A for an example.

It is beyond our scope to go into detail on the hows of financial modeling, and there are print and Internet sources to help you to develop a model.18 We use a publicly available financial planning model developed by PricewaterhouseCoopers for service businesses to show you the level of detail and interaction between your forward-year projections.19

Exhibit 9.3 shows the set of assumptions that go into the financial model. Many items are computed as a percent of sales, or total revenues.

c09ex007
c09ex007
c09ex007

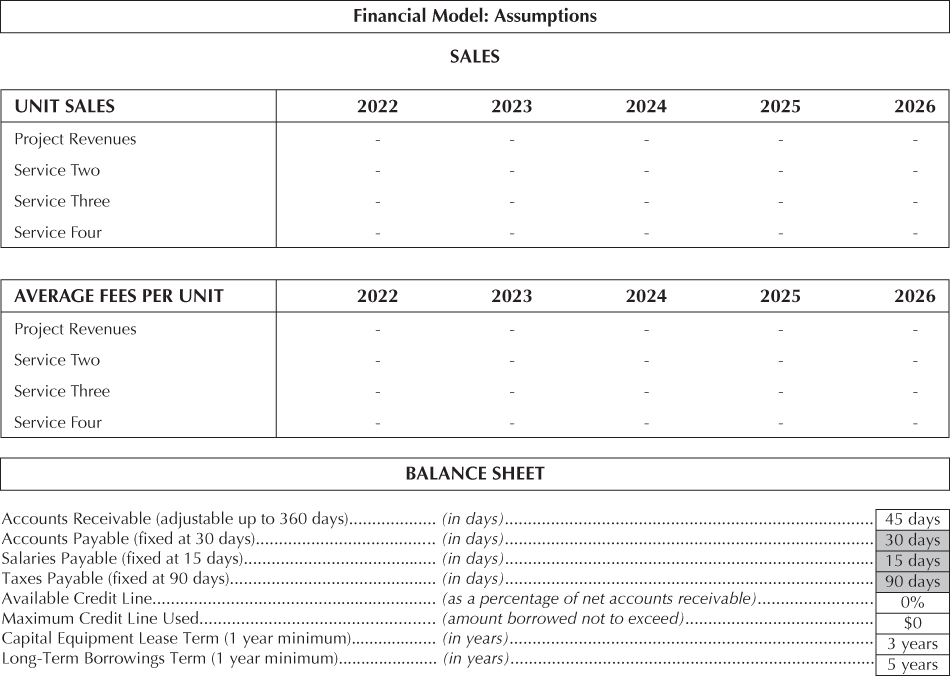
Exhibit 9.3 Financial Model Assumptions – Service Business Example

Next we see our first projected financial statement, the Income Statement (Exhibit 9.4). It is similar to the nonprofit statement of activities. As you study it, note the level of detail that is appropriate for your long-range financial plan. You may wish to customize it with your organization's Statement of Activities captions, or use it as is if you are projecting for a for-profit subsidiary that is involved in generating unrelated business income.

Income Statement (SA) ($)

2022 2023 2024 2025 2026
Revenue
 Project Revenues
$0 $0 $0 $0 $0
Total Revenues $0 $0 $0 $0 $0
Operating Expenses
 Production Process
$0 $0 $0 $0 $0
 % of Revenues 0% 0% 0% 0% 0%
 Sales & Marketing $0 $0 $0 $0 $0
 % of Revenues 0% 0% 0% 0% 0%
 Administration $0 $0 $0 $0 $0
 % of Revenue 0% 0% 0% 0% 0%
Total Operating Expenses $0 $0 $0 $0 $0
 % of Revenue 0% 0% 0% 0% 0%
 Interest Expense $0 $0 $0 $0 $0
 Interest Revenue $0 $0 $0 $0 $0
Income Before Taxes $0 $0 $0 $0 $0
 Tax Expense $0 $0 $0 $0 $0
Net Income (or Surplus) $0 $0 $0 $0 $0
 % of Revenue 0% 0% 0% 0% 0%

Source: PricewaterhouseCoopers. © 2005 PricewaterhouseCoopers. All rights reserved. PricewaterhouseCoopers refers to the network of member firms of PricewaterhouseCoopers International Limited, each of which is a separate and independent legal entity. Downloaded from: www.pwcv2rform.com. Accessed 1/2/06. Used by permission.

Exhibit 9.4 Projected Revenues and Expenses – Service Business Example

Note that the Net Income would be the Change in Net Assets for a nonprofit organization and that tax expense (Tax Exp) will most likely be zero for tax-exempt nonprofits (unless they have to pay some use or excise taxes or taxes on unrelated business income).

Next, we need to project the SFP, or balance sheet. Notice in Exhibit 9.5 the service business projected balance sheet developed by PriceWaterhouseCoopers. Again, you would modify it to the account categories for your organization, including a breakdown in “Cash” for unrestricted cash and restricted cash. The caption “A/R” is an abbreviation for accounts receivable, which would fit commercial nonprofits but might instead be pledges receivable for the donative nonprofit or grants receivable for other nonprofits.

Balance Sheet (SFP) ($)

2022 2023 2024 2025 2026
ASSETS
Current Assets:
 Cash $0 $0 $0 $0 $0
 Net Accounts Recv $0 $0 $0 $0 $0
Total Current Assets $0 $0 $0 $0 $0
Gross Fixed Assets $0 $0 $0 $0 $0
 Less Accum Depreciation $0 $0 $0 $0 $0
Net Fixed Assets $0 $0 $0 $0 $0
TOTAL ASSETS $0 $0 $0 $0 $0
LIABILITIES
Current Liabilities:
 Accounts Payable (30 days) $0 $0 $0 $0 $0
 Salaries Payable (15 days) $0 $0 $0 $0 $0
 Taxes Payable (90 days) $0 $0 $0 $0 $0
 Line of Credit (X% of net A/R) $0 $0 $0 $0 $0
 Current Portion of Cap Equip Lease $0 $0 $0 $0 $0
 Current Portion of Long-Term Debt $0 $0 $0 $0 $0
Total Current Liabilities $0 $0 $0 $0 $0
Long-Term Liabilities:
 Capital Equipment Lease (3 years) $0 $0 $0 $0 $0
 Long-Term Debt (5 years) $0 $0 $0 $0 $0
Total Long-Term Liabilities $0 $0 $0 $0 $0
TOTAL LIABILITIES $0 $0 $0 $0 $0
Net Assets
Without Donor Restriction $0 $0 $0 $0 $0
With Donor Restriction $0 $0 $0 $0 $0
Total Net Assets $0 $0 $0 $0 $0
LIABILITIES & NET ASSETS $0 $0 $0 $0 $0

Source: PricewaterhouseCoopers. © 2005 Pricewaterhouse Coopers. All rights reserved. PricewaterhouseCoopers refers to the network of member firms of PricewaterhouseCoopers International Limited, each of which is a separate and independent legal entity. Downloaded from www.pwcv2rform.com. Accessed 1/2/06. Used by permission.

Exhibit 9.5 Projected Assets, Liabilities, and Net Assets —Service Business Example

We modified the business format slightly. For Equity, we use Net Assets, and you may also wish to split out Unrestricted Net Assets, Temporarily Restricted Net Assets, and Permanently Restricted Net Assets rather than Net Assets with Donor Restrictions and Net Assets without Donor Restrictions.

Finally, and for many organizations possibly the most important projection, is the sources and uses of funds projection. It is similar to a projected SCF, and you may opt to use your SCF format rather than the sources/uses template shown in Exhibit 9.6. Regardless, study it carefully, noting how the financial plan details the needs for funds and the anticipated funding sources. You may leave one category in the latter blank (zero value), using this as the “plug figure” for your projected long-range financial plan. Then strategize on how to meet that shortfall as you view the first-pass projection of your sources and uses. That leads us directly to the target liquidity level assessment, our next topic.

Statement of Sources & Uses ($)

2022 2023 2024 2025 2026
BEGINNING CASH $0 $0 $0 $0 $0
Sources of Cash
 Net Income $0 $0 $0 $0 $0
 Add Depr/Amort $0 $0 $0 $0 $0
 Accounts Payable (30 days) $0 $0 $0 $0 $0
 Salaries Payable (15 days) $0 $0 $0 $0 $0
 Taxes Payable (90 days) $0 $0 $0 $0 $0
 Additions to Line of Credit $0 $0 $0 $0 $0
 Additions to Cap Equip Lease $0 $0 $0 $0 $0
 Additions to Long-Term Debt $0 $0 $0 $0 $0
Total Sources of Cash $0 $0 $0 $0 $0
Uses of Cash Less Changes In:
 Net Accounts Rec $0 $0 $0 $0 $0
 Gross Fixed Assets $0 $0 $0 $0 $0
 Reductions to Line of Credit $0 $0 $0 $0 $0
 Reductions to Cap Equip Lease $0 $0 $0 $0 $0
 Reductions to Long-Term Debt $0 $0 $0 $0 $0
Total Uses $0 $0 $0 $0 $0
CHANGES IN CASH $0 $0 $0 $0 $0
ENDING CASH $0 $0 $0 $0 $0

Source: PricewaterhouseCoopers. © 2005 PricewaterhouseCoopers. All rights reserved. PricewaterhouseCoopers refers to the network of member firms of PricewaterhouseCoopers International Limited, each of which is a separate and independent legal entity. Downloaded from: www.pwcv2rform.com. Accessed 1/2/06. Used by permission.

Exhibit 9.6 Projected Sources and Uses of Funds – Service Business Example

What is the bottom line on the sources and uses of funds projection? Ending cash. If the total of the anticipated sources of cash are inadequate to cover anticipated uses of cash, your ending cash will be eroded over time. Move now to arrange additional sources of funds or reduce anticipated uses of funds to bridge the gap between sources and uses. Furthermore, many organizations will want to intentionally plan to have a smaller total-uses-of-cash figure, in order to build toward higher values of ending cash as it targets a higher liquidity level.

(g) PROJECT AND REEVALUATE TARGET LIQUIDITY.  Earlier in this book we profiled evaluating the necessary level of liquidity (Chapters 2, 5 , and 8) and how to measure liquidity (Chapters 2 and 7). Equally valuable is an analysis of the target liquidity level that is based also on the projected financial position several years in the future. In this way, we not only know what level of operating reserves to hold, but also the level of strategic reserves to hold. Strategic reserves include amounts accumulated to prefund capital expenditures, funds for unanticipated strategic options (such as new programs or large one-time service needs that may arise), and funds for a board-designated endowment, or quasi-endowment, the income from which may help fund program expenses. These additional funds are necessary because nonprofits typically do not earn enough of a surplus (“profit”) of revenues over expenses to self-fund such expenditures on a timely basis.20

The beginning point for this analysis is the Ending Cash projection we looked at in our sources and uses projection (refer to Exhibit 9.6). Recall, from our ratios presentation in Chapter 7, the definition of target liquidity level and also a related ratio, target liquidity level lambda:

images

Total amount of credit line is the ceiling amount approved for the bank, or the maxi- mum amount that may be borrowed at any one time. It is similar to the credit limit on a credit card.

images

where:

Projected OCF is the operating cash flow amount for the next year
Uncertainty of OCF is the standard deviation of the organization's historical operating cash flows (OCFs) for at least the past three years

The first thing we add to Ending Cash is the amount held in short-term investments. Notice on our projected balance sheets (refer to Exhibit 9.5) that no line item was listed for short-term investments. If your organization has short-term investments (beyond cash and cash equivalents, with cash equivalents being very short-term investments with a maturity at the time of purchase of three months or less), you should list those on your projected balance sheet immediately below the cash row. Then determine the total amount of your organization's negotiated credit line, if any, and add this to the total you had for (Ending Cash + Short-term investments). This amount will not be shown on your projected balance sheet except in the special case in which you plan to have borrowed up to the limit of that credit line at the balance sheet date, say, 12/31/2022. Your organization will find that one of the primary benefits of projecting a balance sheet is to know how much of a credit line to request from a bank. For comparison purposes, if you need to determine what another peer organization has arranged in a past year for its credit line you would have to search the notes that accompany the financial statements to find the total amount of the credit line. Finally, subtract also from your projected balance sheet any amount shown under current liabilities for “Credit line” or an equivalent current liability entry, normally “Notes payable.” This represents amounts borrowed under a credit line or similar short-term borrowing arrangement with a bank or other short-term lender.

For example, let's say you project Ending Cash of $5,000, short-term investments of $15,500, have arranged a credit line for $100,000, and project a borrowed amount of $45,000. Your projected target liquidity level would be $75,500 (= $5,000 + $15,500 + $100,000 − $45,000).

If your organization typically has significant across-year variability in its operating cash flows (consult your last five SCFs to check this), you will also want to calculate the projected TLLL, or projected target liquidity level lambda, which involves two modifications to the formula: (1) add the next year's projected operating cash flow to projected TLL and then (2) divide the sum from step 1 by the standard deviation of your organization's historical operating cash flows.

Revisiting our previous example, let's say your organization expects an operating cash flow for the next year of −$35,000 and has these historical operating cash flows for the past five years:

PAST YEARS OPERATING CASH FLOW
1 $45,000
2 −25,000
3     5,000
4 −15,000
5   10,000

Clearly, your organization has experienced significant variability in its OCFs. We need to calculate the standard deviation of this sample of cash flows to use in our calculation of projected TLLL. Let's illustrate that calculation by using Microsoft Excel and the built-in function for sample standard deviation:

images

Using this sample estimate for our OCF variability, we get this projected TLLL:

images

If your organization's OCFs are approximately normally distributed (appearing as an almost symmetrical, bell-shaped curve when graphed), we can use this information to estimate our probability of running out of cash.

First, let's assume that “out of cash” is a negative cash balance. This implies we exhaust our Ending Cash, then exhaust our short-term investments, then use up any previously unused credit line availability, and finally burn through any positive OCF that comes in the next period.

Second, in our illustration, next year's projected OCF is forecasted to be a negative $35,000, which we noted should drop our TLL to $40,500. Based on historical OCF variability (a standard deviation of $27,000 plus), what is the chance we will drop below $0 in cash next year? We take the difference between $0 and our forecast of $40,500 (= TLL + Projected OCF), and divide that by $27,018.51. This gives us how many standard deviations $0 falls below our $40,500 forecast, which is actually called a “z score” in statistics:

images

Notice that this figure is exactly the same as our projected TLLL.

The question is now: What is the probability of our liquidity dropping not just below $40,500, but below $0, in the forthcoming period? The TLLL number of 1.50 tells us that $0 is 1.5 standard deviations below the expected value of $40,500. Visually, looking at Exhibit 9.7, one-half of the possible outcomes fall above $40,500, so these would represent 50 percent of the outcomes, or a 50 percent likelihood. To determine how likely an outcome below $0 is, we need to determine the likelihood of an outcome falling between $0 and $40,500, then add that to the 50 percent likelihood of an “above $40,500” outcome, and finally subtract this sum from 100 percent. We can consult a standard normal table to get the likelihood of the $0 to $40,500 outcome, or use the NORMSDIST function to do this for us, using Excel. We start by getting the probability of getting an outcome above $0:

images

Therefore:

images
Illustration of distribution of target liquidity level outcomes using hypothetical example.

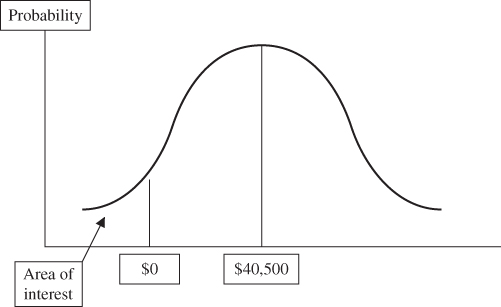
Exhibit 9.7 Distribution of Target Liquidity Level Outcomes Using Hypothetical Example

Interpretation: This calculated value for the area suggests that the chance of our organization running out of cash is less than 7 percent for the upcoming year.

We may decide this probability of running out of cash is too high. If we were to plan based on a slightly larger credit line, say $123,000 instead of $100,000, our TLL jumps $23,000 to $63,500. That gives us a TLLL of 2.35 = $63,500/$27,018.51.

Let's see how this revised credit line amount affects our probability of running short on cash.

images

Therefore:

images

The board and CFO may find a probability of less than 1 percent to be acceptable. We see here the value of iterative and interactive financial planning, whereby different values can be plugged in for target liquidity and the preferred policy decision selected. In this case, the organization decided its original TLL was too low and bumped it up by $23,000. It would not have necessarily done this by increasing the credit line amount, however, and may have (given sufficient lead time in the planning process) built up the level of short-term investments instead.

(i) Scenario Analysis and Sensitivity Analysis. Running various scenarios through your financial model to see their likely effect on revenues, expenses, assets, liabilities, and the target liquidity level is very helpful. If you are not prepared to do this scenario analysis, at least vary your revenues up and down by 5, 10, and 15 percent to see the effect on your financials, and do the same with expenses. You may wish to develop or use an Excel revenue scenario template to help you see the results of varying revenue and support levels.21

We agree with Donaldson that an organization needs a database for a strategy of funds mobility in order to cope with unexpected changes. The advice of consultant Hilda Polanco is on point: “Discuss and develop plans for mitigating any financial risks demonstrated by the scenarios, including specifying “triggers” for implementing plans.”22 In Exhibit 9.8 we present a template modified from Donaldson's business template. It lists items as uncommitted reserves, reduction of planned outflows, and liquidation of assets. This template is related to the tiers of liquidity that we presented in Exhibit 2.2 in Chapter 2; you may wish to review that diagram before going any further. In Exhibit 9.8, we see an estimate of funds that could be made available from both internal and external sources. Note that these are funds that have not already been committed for use in the next three years. These include:

Available for use within:
Resources Three months One year Three years
I. Uncommitted reserves
 Instant reserves
  Surplus unrestricted cash
  Unused line of credit
 Negotiable reserves
  Additional bank loans
   Unsecured (no collateral)
   Secured (have collateral)
  Additional long-term debt
  Additional funds raised*
II. Reduction of planned outflows
 Volume-related
  Change in production or service schedule
 Scale-related
  Marketing/promotion program
  R&D/New program development budget
  Administrative overhead**
  Capital expenditures
 Value-related
  Fundraising expenditure**
  Capital campaign**
  Endowment campaign**
III. Liquidity of assets
 Shutdown (temporary)
 Sale/divestiture of unit
SUBTOTAL
TOTAL RESOURCES


$
$


$
$


$


$


$
$


$
$
$
$

$
$
$


$

$


$


$
$


$
$
$

* It is unusual to be able to raise more funds the same fiscal year when increasing fundraising efforts, although some organizations (especially faith-based organizations) are able to do this at times.

** Generally, pare back or defer, but do not eliminate entirely. If “Additional funds raised” is a Level I objective, this will preclude cost reductions in one or more of the fundraising categories.

Source: Adapted from Exhibit I in Gordon Donaldson, “Strategy for Financial Emergencies,” Harvard Business Review (November/December 1969): 67–79. Used by permission.

Exhibit 9.8 Inventory of Resources for Financial Mobility—a Template

  • Uncommitted reserves. This includes instant reserves and negotiable reserves:
    • Instant reserves (unrestricted cash balances, unrestricted short-term marketable securities, and the unused portion of the bank credit line, if any) are instantly available for any purpose. Buy time for the organization in order that it can mobilize other resources – implying that the size of the instant reserves should be larger the larger an unexpected cash deficit might be and the longer it takes the organization to tap other resources.
    • Negotiable reserves (new short-term bank loans, new long-term debt issues, new fundraising approaches or intensity) involve some form of negotiation and are therefore less certain. Also, the amounts depend on the degree and type of previous use of these items (long-term debt issues depend on previous use of long-term debt and short-term debt). Consider the sequencing and interrelationships in this category of funding sources.
    • Collateral for short-term loans is typically inventory and accounts receivable (ruling out this form of borrowing for many nonprofits), although at times grants and contracts receivable may serve as security for loans.
  • Reduction of outflows. Here the view is toward what existing commitments to planned outflows may be reduced and a consideration of whether an unexpected need that arises might better be met through one of these reductions rather than drawing on uncommitted reserves – the wisdom of which depends on how large and pressing the need is, the size and accessibility of the organization's reserves, and the special circumstances related to the unexpected need.
    • Value-related expenditures are not directly related to the organization's services, but do affect the donor franchise and donors' perceived value (such as expenditures on an ongoing capital campaign).
    • The largest potential fund source here is usually the scale-related outflows, in that they offer the most flexibility regarding expenditure timing.
    • Volume-related cuts are best done if service demands are also declining.
    • New and unexpected needs are golden opportunities to revisit the organization's priorities, which is a reason that selective budget cuts may be appropriate as an organizational response.
    • “Defending the remaining financial reserves may be more important than defending the budget” – so keep these intact to protect against future totally unexpected and urgent needs whenever possible.23
    • If your organization is already very lean, and few if any cutbacks are possible without causing service provision cutbacks, rely more on a larger instant reserves level and less on reduced outflows for meeting unexpected needs.
    • At times reductions or deferrals in annual campaigns or deferred giving campaigns may be necessary, but recognize the effect on this on your donors and their perceptions, including the loss of additional opportunities to solidify your organization's value proposition in their minds.
  • Liquidation of assets. Temporary suspension of the use of property or eventual sale of property, facilities and plant, equipment, and land.
    • Recognize that there is a great deal of uncertainty here if assets are sold off, both with respect to amount and length of time to consummate the disposal.
    • This requires an estimate of “liquidation value.” What amount would you realize if you had to sell the assets quickly?
    • It is best to identify in advance which operations are least “mission-central” and which would have the smallest effect on the organization's revenue stream.

Even more valuable, once you have completed Exhibit 9.8, is to do a second inventory of funding resources based on a projection of what you think they are likely to be a year from now. Especially important in that second inventory is the anticipated change in instant reserves: If an erosion in instant reserves is anticipated, take action now to tap negotiable reserves and/or a reduction planned outflows in order to restore your instant reserves. Remember that your primary financial objective as a nonprofit is to maintain your target liquidity level.

(ii) Other Financial Goals and the Organization's Life Cycle.  If yours is a commercial nonprofit (can price its services to more than cover costs), you may also adopt some profitability goals for some of your lines of business. Or your organization may be at the point in its life cycle to start or build your endowment fund. For example, the University of North Florida planned a new student union (cost: $30 to $35 million) but is also building its endowment to $100 million by a certain point in time in order to (1) increase operations funding with a more predictable annual income, (2) improve its standing in the academic community, and (3) decrease its dependence on the state legislature's funding allocations.24 Stevens notes that different stages in your organization's life cycle may occasion different financial priorities; we quote here only the ones that are part of your financial planning objectives.25

STAGE IN LIFE CYCLE FINANCIAL CHALLENGE
Idea Stage Obtain funding or financing
Start-Up Stage Create a breakeven budget
Manage cash flow
Growth Stage Diversify program revenues
Obtain line of credit or working capital loan
Recognize that each program has different costs; some will produce surpluses, some will not
Thoroughly understand and budget administrative costs
Budget depreciation as an operating expense
Set aside cash surpluses for working capital reserves
Maturity Stage Develop net asset (equity) balances
Create operating reserves from unrestricted income
Continue to develop working capital reserves to internally finance cash flow and growth
Set up “repair and replacement” reserves, funded by depreciation allowances
Possibly develop an endowment, take on a mortgage, or consider other forms of permanent capital
Decline Stage Use reserves only for regenerating activities, not for deficit spending
Examine the budget for top-heavy administrative expenses
Turnaround Stage Create a financial plan to pay off creditors and restore organizational credibility
Consider and obtain a debt reconsolidation loan to allow you to focus on the future while responsibly handling past debts
Cut back to minimal expense levels
Train on new mindset: “Just because it's in the budget doesn't mean there's cash available”
Terminal Stage Establish an orderly way to go out of business

Smaller organizations, especially those with $1 million in annual revenues and support or less, will find this life-cycle framework valuable for prioritizing their financial strategies and long-term financial plans. A key concern that we have not yet addressed, however, is how fast our organization can grow.

(h) BASED ON OUR FINANCIAL POLICIES AND STRUCTURE, HOW FAST CAN WE GROW?  If you make some simplifying assumptions, you can determine the approximate rate of growth of activity for your nonprofit organization. This framework works much better for a commercial nonprofit (in which revenues tend to bear a direct, causal link to asset investment) than for a donative nonprofit, but it will give insight in either case. The nonprofit version of this “sustainable growth model” was developed by Marc Jegers.26 We base our presentation on his model, beginning with the data inputs needed to estimate the maximum growth rate in service provision. Your organization's maximum rate of growth in service provision jointly depends on its profitability (degree to which revenues more than cover expenses), capital structure (relative use of debt financing), and efficiency. There are two sets of inputs: operating variables and financing variables.

(i) Operating Variables.  The operating variables in this model are the year-beginning and year-ending service levels, the growth rate of that service provision, the efficiency of service delivery, and profitability relative to asset investment.

  • Level of service provision at the beginning of the year, X0.
  • Level of service provision at the end of the year, X1.
  • Growth rate in service provision, g = (X1X0)/X0.

The efficiency (labeled as α) with which the organization “produces” X, relative to total assets, which we represent as T: α = X/T, and the change in α (labeled as images) is:

images

The profitability of the organization, or the change in net assets, is represented by P. Your organization might normally refer to this as your surplus. P would be equal to total revenues (whether restricted or unrestricted, whether gathered through fees, dues, donations, grants, or sales) less total expenses. Express this profit in relation to total assets (with the ratio labeled as m):

images

(ii) Financing Variables.  On the statement of financial position (SFP) every dollar of assets must be financed by either debt (borrowed money, liabilities) or net assets. Therefore, we have the SFP identity:

images

The capital structure is the relative use of net assets (what some call equity or used to call fund balance) and debt in financing assets, with d being the ratio of debt to net assets:

images

For consecutive years, just include the year as the subscript:

images

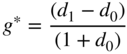
(iii) Projection Model. What we wish to determine is g*, the maximum growth rate in service provision. If you calculate this model using your year-end numerical values, it will tell you the ability to grow your service levels for the upcoming year. (For example, if you do it at the end of 2022, you will see what your maximum growth rate is projected to be for 2023.) You will have to specify, as an input to the model, how your relative use of debt financing will change during the year (d1) compared to the beginning-of-year (which is, of course, the end of the last year) relative use of debt financing (d0). The model calculates the maximum growth rate of service provision to be:

images

Your growth rate is limited by the use of debt financing for this year and next year (d0 and d1), the relative efficiency from this year to next year (images = α10), and the “return on assets” (m).

For example, let's say that our charity has a 0.50 debt-to-net-assets ratio that will not change during the upcoming year; its ratio of service provision to total assets is 0.70 and is expected to increase to 0.75; and its ratio of profit (or surplus) to total assets is 0.05. The maximum growth rate of service provision for the upcoming year is:

images

(iv) Interpretation. The level of service provision for our charity can grow during the upcoming year at a maximum rate of 15.83 percent unless one or more of these events occur: (1) it uses more debt for each dollar of net assets; (2) it increases its efficiency more than the 7.143 percent increase in efficiency already projected (which was based on increasing X/T from a 70 to 75 percent ratio); or (3) it increases its “profit” (change in net assets) as a percent of assets.

(v) Special cases. Three special cases allow you to simplify this formula:

Case 1: Capital structure and efficiency do not change. In this case, the formula simplifies to show the effect of financing growth strictly through profits and just enough additional debt to keep the D/NA ratio unchanged:

images

Case 2: Capital structure does not change and there are no profits (m = 0). In this case, the formula simplifies to show the effect of a change in efficiency on growth:

images

Here the growth rate simplifies to being the rate of growth in efficiency.

Case 3: Efficiency does not change and there are no profits (m = 0). In this case, the formula simplifies to show the effect of a change in the capital structure on growth:

images

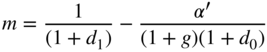
(vi) Minimum required profitability.  A very helpful planning formula can be developed from the sustainable growth model. For starters, we know the growth rate in service provision that we desire. We project our anticipated capital structure and efficiency level. The question is: What rate of profit (as a percent of assets) must we generate in order to grow at our desired growth rate? We can solve for that profit ratio with this formula:

images

(vii) Cautions.  We offer four cautions as you apply this sustainable growth model:

  1. If you use revenues as your measure of service provision, make sure to subtract any “in-kind gifts,” because these will distort the revenue to assets relationship for planning purposes.
  2. Because of the permanently restricted nature of endowments, we recommend that you subtract any endowment-related amounts from revenues, expenses, assets, and net assets.
  3. Because of the long-term restrictions on most trusts, either modify your trust- related revenues, expenses, assets, liabilities, and net assets, or subtract any trust-related amounts from these accounts.
  4. Related to point 3, a messy issue for nonprofits is the degree to which revenues and net assets are restricted versus unrestricted. Particularly, to what degree your organization's gifts restricted versus unrestricted, and what are the revenue implications of this?

If these amounts are insignificant for your organization, you may ignore them in your growth calculations. If any of them are significant, you may either modify your numbers as recommended or ignore these issues but consider the sustainable growth rate as only a very rough approximation of the true sustainable growth rate.

9.3 FINANCIAL EVALUATION OF NEW AND EXISTING PROGRAMS

Up to this point, we have assumed that you knew what programs you would plan for and on what scale you would operate those programs. Now let's shift our focus to how to do program evaluation of the portfolio (or set) of programs your organization offers or could offer. Deciding which activities to engage in and how much in resources each activity will receive is sometimes called programming.

An illustration of this concept is a listing (in Exhibit 9.9) of some of one organization's 158 different human services program elements, subactivities within the three similar groups of activities called programs.

Program Structure (Partial Listing)

Program Program Elements
Human services Adoption agencies
Day care centers
Food banks
Meals-on-wheels services
Foster care for abused and neglected children
Drug and alcohol recovery
Housing Apartment complex development for low-income families and the elderly Specialized housing for disabled persons
Health care Nursing care facilities (four states)

Exhibit 9.9 Programs and Program Elements for a Social Services Organization

The remainder of this chapter will highlight four interrelated issues: (1) how to deter- mine which programs to engage in, (2) how to determine how much in organization resources (if any) to devote to each program on an ongoing basis, (3) how to evaluate the possible addition of new activities (program elements), and (4) how to evaluate the ongoing investment of organizational resources in the various activities. We begin by analyzing the financial manager's role in programming.

Programming involves four steps:

  1. Identifying program alternatives
  2. Analyzing program alternatives
  3. Making the programming decisions
  4. Developing program support

In programming, some major finance-related responsibilities in both the analysis of program alternatives and programming decisions fall on the financial manager. In analyzing program alternatives, the financial manager might assist in four activities:

  1. Specify resource (including financial) requirements. Nonfinancial resources include equipment, facilities, materials, and supplies, and staff and professional time.
  2. Develop a financial plan, which provides a summary of all the financial consequences of the programming decisions: sources of funds, costs of resource usage (program expense budgets for multiple years), any surplus or deficits to be expected, and a need for special fundraising campaigns or borrowing.
  3. See that discounted cash flow analysis is conducted when the projects have revenues associated with them.
  4. As profiled earlier in this chapter, determine financial feasibility for the organization by projecting cash flows in a long-range planning study. The study might result in an estimate of the additional grants or donated funds that must be obtained for the organization to remain financially viable if it pursues a given program alternative.

At times the analysis of program alternatives involves consideration of new programs and/or larger resource commitments than usual. The financial manager provides the same kind of assistance as before, but additionally must help the ED/CEO and board see the big picture in financial terms. We need to learn about service portfolios and relative cost coverage to see specifically how the financial professional can contribute to the discussion.

(a) SIMPLE PORTFOLIO ANALYSIS.  A good starting point for your program diagnosis that about any ED/CEO, board, and CFO might use is the Dual Bottom-Line Matrix developed by Peters and Schaffer.27 It is provided in Exhibit 9.10.

Illustration of Dual bottom-line matrix portfolio analysis.

Source: Reprinted from Jeanne Bell Peters and Elizabeth Schaffer, Financial Leadership for Nonprofit Executives: Guiding Your Organization to Long-Term Success, p. 51. Copyright 2005 CompassPoint Nonprofit Services, published by Fieldstone Alliance, Inc. Used with permission of the publisher.

Exhibit 9.10 Dual Bottom-Line Matrix Portfolio Analysis

Programs in the lower left quadrant, “stop signs,” should be closed down soon. At the opposite extreme, “star” programs at the top right are keepers to which you will want to increase resource allocations. Bottom-right programs are “money signs” that may help to fund those “star” programs. Finally, “heart” programs should normally be kept and work should be done to improve the sustainability of these programs.

(b) ADVANCED PORTFOLIO ANALYSIS.  We presented some more advanced portfolio models in Chapter 3, which we will not duplicate here. One weakness of most of these models is the failure to include liquidity and financial flexibility. Appendix 9B provides one view of how to evaluate “social enterprises” from a financial perspective. In that model, liquidity is a key driving factor in the evaluation, corresponding to our view that achieving and maintaining a target liquidity level is the single most important financial objective of a noncommercial nonprofit and one of the most important variables in commercial nonprofits.

(c) ANNUAL NECESSARY INVESTMENT.  If a program is growing but funding resources are not growing more quickly, the manager is faced with the situation in which that program will be draining an ever-increasing share of investable monies over time. The implication is clear: Other programs being offered or considered will have to have funding cut over time. Very few nonprofit managers foresee this type of situation, and equally few study past financials (laid out by program) to even see this in retrospect. This is just the type of contribution you can make to assist your board and top-management team in diagnosing and strategically positioning an organization for a desired future in which top-priority programs and mission achievement are secure. Compare the organization's future position to its present position.

Once your management team and board have agreed on a set of programs, conduct a final check on the structure of selected programs before making financial and personnel decisions:28

  • Are the operating plans well developed?
  • Have nonfinancial resources been identified?
  • Have financial constraints been considered?
  • Are the desired results from the program well defined?
  • Does the program have a detailed list of objectives?
  • Will the program achieve the organizational goals?

It is at this point that a set of pro forma balance sheets and statement of activities should be drawn up for one to five years in the future. You might lay out a set of four scenarios for each year. Include the status quo (no change in present situation), as well as optimistic, most likely (“base case”) and pessimistic scenarios. This will greatly assist in answering the third question (“Have financial constraints been considered?”).

The financial manager may also assist in the development of program advocates within the funding sources. The idea here is to procure some stability over the funding source. By demonstrating how the source's funding is critical to a program's long-range financial viability, the organization may be able to gain a deeper, more permanent degree of commitment.

The final duty is budgeting. Financial managers have primary responsibility for the budget process, with approval authority resting with the board. Our concern here is to ensure that programming decisions are translated into budget line items. (Chapter 8 is dedicated largely to budgeting.) Ideally, as each year progresses, use last year's strategic and long-range financial plan to be the starting point not only for the new strategic and long-range financial plan, but also for the development of next year's operating and capital budget. Consider it a warning signal when the long-range financial plan is not used to help develop budgets. Possibly the plan is too inaccurate, or the organization is unaware of the tie between programming and budgeting. Obviously, those organizations updating long-range plans less frequently than yearly have less direct correspondence between plans and budgets. Plans are most likely to be implemented when they drive the resource allocation embodied in the annual operating and capital budgets. Finally, the process of planning is invaluable, forcing discussion and resolution of the trade-offs and prioritization involved in spending decisions.

9.4 CAPITAL BUDGETING: FINANCIAL EVALUATION OF PROJECTS THAT ARISE FROM EXISTING PROGRAMS

Programs spawn projects, and these projects often involve large capital allocations with multiyear cash flow effects. These will affect your organization's target liquidity level for years to come. Consequently, the next key question when evaluating a capital project is: Will the capital expenditure cover all of its costs and provide an adequate return on invested capital? This is a pivotal question for evaluating capital expenditures that bring in revenues as well as for selecting between alternative expenditures that involve only costs. Even donative nonprofit organizations may have to consider both capital expenditure types. Any expenditures bringing in multiyear cash revenues should be evaluated in the way we show next. Not doing so could lead to a faulty decision for projects providing cash revenues (revenue would increase, but with an extremely low return on invested capital) or when selecting between two or more alternatives that have different up-front costs or different life spans. Two simplified examples illustrate this point.

(a) EXAMPLE 1: NET PRESENT VALUE AND BENEFIT-COST RATIO ILLUSTRATED.  Youthsave, Inc. occupies a building that is much larger than it needs in the foreseeable future. Youthsave has fixed up the part of the building it occupies, but the other parts of the building are in disrepair and would need major remodeling in order to be usable. Youthsave has received repeated inquiries from other nonprofit organizations wishing to rent the space it has not renovated. Several have indicated that Youthsave's prime central business district location would lead them to pay $1,000 per month, payable in a lump sum at the end of each year, for an office area of 2,500 square feet. The rental prospects would also pay all utilities used by them. Youthsave has received three sealed-bid remodeling estimates from contractors having strong track records of high-quality work. The lowest bid is $95,000. Assuming it would be 15 years both for the lease and before the area would have to be remodeled again, and ignoring any leasehold improvement considerations, should Youthsave engage in the revenue enhancement project? (Assume the organization will not have to pay tax on the rental income.)

(i) Approaching a Capital Expenditure Analysis.  Because the remodeling is an up-front expense and the rent is paid on a monthly basis in the future, it is incorrect to merely multiply the revenue per month by the number of months and then subtract the up-front cost. A dollar received or paid today is worth more than a dollar received or paid 1, 2, or 12 years from now because it can be invested to earn interest. This fact is recognized as the time value of money. It implies the need for these three steps:

  1. Specify the project's anticipated cash flows: What cash outflows will result and when, what cash inflows will result and when?
  2. Select a discount rate to reflect the time value of money: What rate of return could you have earned per year if you did not tie funds up in this capital project?
  3. Apply the discount rate to future cash flows (those anticipated next year and in following years), then subtract any up-front costs to determine the ROIC and project acceptability.

Step 1. Let's show a cash flow timeline. Cash outflows are shown as spikes below the horizontal axis, cash inflows are represented by spikes above the axis. We have an initial (“period 0”) outflow of $95,000 followed by 12 end-of-year inflows of $12,000 (each end-of-year $12,000 is 12 × $1,000):

$12 $12 $12 $12 $12 $12 $12 $12 $12 $12 $12 $12
| | | | | | | | | | | |
0 1 2 3 4 5 6 7 8 9 10 11 12
–$95 Period

Step 2. The organization can invest long-term funds at about 10 percent, and the mort- gage rate is about 10 percent. So we will use an interest rate of 10 percent to determine the present value (present dollar equivalent) of each of the future cash flows.

Step 3. We will compute two measures of project acceptability. The first, net present value (NPV), represents the surplus of revenue over expense, if any, after stating all cash flows in today's terms. We “discount” each future cash flow back to today's value by dividing it by (1 + interest rate) raised to a power representing how many years away the flow occurs. Equivalently, multiply the cash flow by 1/(1 + interest rate) raised to the appropriate power.

For example, to discount a cash flow that will occur two periods from now, using a 10 percent discount rate, multiply it by: 1/(1+0.10)2 = 1/(1.1)2 = 1/1.21 = 0.8264. Then subtract the initial remodeling outlay, which does not need to be adjusted to present value because it occurs at present. A table can be set up to show the calculations:

YEAR CASH FLOW PRESENT VALUE FACTOR PRESENT VALUE OF CASH FLOW
0   −$95,000 1.0000   −$95,000.00
1   $12,000 0.9091     10,909.20
2   $12,000 0.8264      9,916.80
3   $12,000 0.7513      9,015.60
4   $12,000 0.6830      8,196.00
5   $12,000 0.6209      7,450.80
6   $12,000 0.5645      6,774.00
7   $12,000 0.5132      6,158.40
8   $12,000 0.4665      5,598.00
9   $12,000 0.4241      5,089.20
10   $12,000 0.3855      4,626.00
11   $12,000 0.3505      4,206.00
12   $12,000 0.3186      3,823.20

When we sum up the right column, we get a negative value for NPV: −$13,236.80.

Because the time value factors in our table are rounded to four decimal places, this estimate is slightly inaccurate.

We could key these numbers into an Excel spreadsheet and use Excel's built-in NPV financial function to get a more exact NPV. The formula looks like this: =NPV(0.10, range of inflows)–Initial Investment cell. The range of inflows is merely the cell address range in which you entered the year 1–12 cash inflows, which would each be $12,000.

We have to subtract the outflow (or add it, if we entered it as a negative number) to have Excel handle it properly. In Youthsave's case, the exact NPV turns out to be negative:

images

(ii) Making the Capital Expenditure Decision.  What should Youthsave do? After we have calculated NPV, these decision rules tell us what to do:

  • If the NPV is positive, the project more than covers all costs, including financing costs (or forgone investing revenues). Approve it.
  • If the NPV is zero, the project just covers all costs. Approve it.
  • If NPV is negative, revenues do not cover all costs. Because the rental contract does not cover all costs in this case, it should be turned down.

If you prefer to think in terms of benefit-cost ratios, you could have expressed the data somewhat differently. Add up the present value of all the cash inflows (in the “Present Value of Cash Flow” column), which equal $81,763.20. This is your financial benefit amount. Then divide this by the amount of the initial investment, expressed as a positive amount. The resulting benefit-cost ratio, also called the profitability index, signals a good project if greater than 1, benefit equivalent to cost project if equal to 1, and a poor project if less than 1:

images

Inserting the numbers for our example:

images

In this case, the project would be turned down because the benefit-cost ratio is less than 1. The benefit-cost metric is consistent with the NPV metric when making an individual project go/no-go decision. Again, we are looking at the project in purely financial terms, and there may be nonfinancial reasons why you still might implement it. Be aware that you are causing a financial drain on your organization to do so, however.

Now compute a complementary measure that is easier to interpret because it is expressed in percent. This measure, ROIC, or return on invested capital, indicates the financial return per year, after adjusting for the timing of project cash flows. Some organizations call it the time-adjusted rate of return. It tells us what interest rate that the initial investment earns per year when generating the cash inflows forecasted for the project. You can use the IRR function built into Excel in order to calculate ROIC.29 In our example, the ROIC is relatively low:

images

This return is clearly less than the 10 percent annual rate Youthsave can earn if it leaves that money invested. Additionally, the 7.06 percent return is less than the annual interest rate Youthsave would pay a bank to borrow money for a real estate loan to be able to purchase rental property.

Is it worth the effort to calculate NPV or ROIC? What if Youthsave ignored the time value of money? In that case, the analyst would have multiplied the annual inflow of $12,000 by 10 years to get a total project revenue of $120,000. Then the analyst would have subtracted the initial investment of $95,000 to get a $25,000 net return, and the organization might have made the investment. Properly evaluated, this is not a good investment; the ROIC is too low and the investment in remodeling is not cost beneficial.

This same approach of discounting cash flows can be used when evaluating mergers, joint ventures, strategic alliances, or other strategic investment decisions.

Before considering these, let's illustrate a common capital investment scenario: How do we evaluate capital projects that involve only costs?

(b) EXAMPLE 2: EQUIVALENT ANNUAL COST ILLUSTRATED.  Compared to a business, the nonprofit organization encounters many more capital projects that generate no revenues. Some of these projects are “independent” projects that are undertaken in support of service delivery: buying a new van, adding capacity, buying office furniture, and so on. The key here is in getting multiple sealed bids on construction projects or comparing among various vendors for a vehicle or equipment to find the one with the best combination of quality, price, payment terms, warranty, and service after the sale. In some purchasing situations, however, the analyst must select one from between two clearly identifiable alternatives.

Assuming quality, service after the sale, and other nonquantifiable factors are roughly the same, the analyst can find the project having the lowest “cost per year” by once again discounting cash flows. The technique is very similar to the discounting we just illustrated, but is a bit more involved. Called equivalent annual cost (EAC), it may be applied to alternative projects having different life spans and that will be repeated indefinitely (once a machine wears out, it is replaced with another identical machine).

The Trinova Soup Kitchen is considering which of two commercial stoves to purchase. The first, the Everlast model, costing $41,500, would cost $300 per year to operate (including electricity, cleaning, and maintenance) and would last approximately eight years. The second, the Value Miser, costs only $25,000, would cost $450 per year to operate, and would last only five years. Which should Trinova buy, assuming each is equally reliable within its expected lifespan?

First, let's see how someone might do a rough analysis in this example, not taking the time value of money into account.

images
images

Based on this approximation method, which ignores the fact that $1 of cost today is not the same as $1 of cost in later years, Trinova would select Value Miser because its cost per year is $5,450 (compared to Everlast's $5,487.50). Clearly, however, the advantage is almost insignificant—about $38 a year.

Let's redo the analysis with a correction: (1) discount the annual operating costs to today's present dollar equivalent (“present value”), then (2) spread the sum of all acquisition and operating costs over the life span to arrive at a correct cost per year. The appropriate discount rate is again 10 percent.

Step 1.  Calculate each alternative's NPV.

Year EVERLAST Cash Flow (CF) Present Value of CF VALUE MISER Cash Flow (CF) Present Value of CF
0 $(41,500) $(41,500.00) $(25,000) $(25,000)
1 (300) (272.73) (450) (409.09)
2 (300) (247.93) (450) (371.90)
3 (300) (225.39) (450) (338.09)
4 (300) (204.90) (450) (307.36)
5 (300) (186.28) (450) (279.41)
6 (300) (169.34)
7 (300) (153.95)
8 (300) (139.95)
NPV $ (43,100.48) $ (26,705.85)

Step 2

Convert the NPV into an equivalent “cost per year.” The formula used to make this conversion is beyond our scope,30 but essentially converts the NPV to an equivalent equal amount (“annuity”) for each of the years of the project's life span, using a 10 percent interest factor.

Everlast Value Miser
Cost per yr. = $8,078.93 Cost per yr. = $7,044.94

Notice the much larger advantage now demonstrated by Value Miser. Taking into account the time value of money – the fact that costs occur in different amounts at different times and the return on investment given up by the much larger (if less frequent) outlay for Everlast – the annual cost savings jump to about $1,000. Much of this comes from the opportunity to repeatedly invest the difference in the two stoves' initial outlays ($41,500 − 25,000 = $16,500) in securities yielding 10 percent, generating investment income (or avoiding interest expense) that would not be received if Trinova buys the Everlast model. The additional funds can be directed into new programs or into existing program expansion.

Discounted cash flow analysis is a technique used daily in thousands of businesses. One area that we see overlooked in many capital budgets is deferred maintenance. Consider this observation from Grant Thornton's “State of the Nonprofit Sector” report:

An organization-wide inventory of maintenance needs for all facilities is a good starting point. Work with your facilities management team to identify all capital projects that require immediate attention (e.g., leaky ceilings in a child care center). By soliciting input from across the organization and communicating how projects and their related costs fit into the organization's strategy and goals, and health and safety laws, the totality of projects and how limited resources must be allocated and projects prioritized can be fully understood.31

Once again you can see the difference that proficient financial management can make in your organization. Even when you are evaluating capital investments that must be made regardless of the financial attractiveness, draw up a cash flow table. Doing so provides the numbers that you will need to do an overall cash budget for your organization, a topic we covered in Chapter 8.

(c) HOW TO MANAGE THE TOTAL CAPITAL BUDGET.  The capital budget is the listing of all capital projects that the organization wishes to invest in, typically ranked from best to worst or from most necessary to least necessary. Although a business can “in theory” always raise funds when it has a project that will provide an adequate return for shareholders, a nonprofit organization is often limited by the total dollar amount it can invest in capital projects in a given year. This situation, known as capital rationing, arises from the inability to raise funds from any kind of stock issue, the unwillingness or inability to borrow funds, and a limited ability to generate funds from revenue-providing activities or capital campaigns. Special capital campaigns work superbly for periodic building or expansion programs, but cannot be utilized for every year's capital project funding. Some organizations are now experiencing success in raising relatively large unrestricted commitments such as one for $100 million the University of Notre Dame received using a “Philanthropic Succession Partnership.”32

(d) CAPITAL BUDGET AND CAPITAL RATIONING.  Example: There is $150,000 in funds available for capital projects in 2019 at Charity First. First, list the desired capital expenditures from best (or most necessary) to worst (least necessary). The dollar amount of each investment should be included along with a grand total. Projects that generate revenues should have the computed ROIC number listed next to them. To ensure that later year cash flows are included in the long-range financial plan, another column may be included to signify such flows. Exhibit 9.11 provides a sample listing for an organization.

Charity First Capital Budget
Project Cost ROIC Future Year Cash Flows?
New central air conditioning unit $120,000 N/A* Y
Repair roof 25,000 N/A* N
Renovate, rent office space 30,000 12 percent Y
Buy another copier 3,000 N/A* Y
Total $178,000

* N/A means not applicable; usually this means that the project generates no revenue or cost savings.

Exhibit 9.11 An Organization's Overall Capital Budget

The total capital budget in Exhibit 9.11, $178,000, is then compared to capital available for projects. The “capital available” amount is based first on a portion of the cash reserves, which will be listed on the balance sheet as cash.33 Second, there may well be some short-term marketable securities that are not included in the cash account. However, some of the total in cash and marketable securities is temporarily restricted (for a certain time period or until some action is taken by the organization) or permanently restricted (permanent endowment or revolving loan funds). The temporarily restricted portion may include funds restricted specifically for the purpose of fixed assets, so some or all of this should be included in capital available. Your board may have also designated some longer-term investments for this purpose, and you would include this. Much care must be applied in arriving in the “capital available” figure because, in many organizations, three-fourths of monies raised from donors and foundations are restricted as to purpose or time of availability.

Let's say that the amount of capital available for Charity First is $150,000. Which project(s) should be funded?

(e) RATIONING THE CAPITAL.  The way to ration scarce capital, assuming the organization cannot free up or raise funds to meet the shortfall, is to consider which set of available projects best utilizes capital available. With the four projects in our example (Exhibit 9.11), there are only 12 combinations available that would keep us within our $150,000 capital limitation:

  • 1 only
  • 2 only
  • 3 only
  • 4 only
  • 1 and 2
  • l and 3
  • 1 and 4
  • 2 and 3
  • 2 and 4
  • 3 and 4
  • 1, 2, and 4
  • 2, 3, and 4

For each of these combinations, check to verify that the combination's total capital budget would not exceed capital available. At the same time, make sure donor or fund restrictions are adhered to. This process can be tedious and very time consuming when there are many projects and consequently multiple combinations to evaluate.

If one or more of the top-ranked projects are “must-haves,” the analyst's job is considerably simpler because now only the amount of capital available after subtracting the cost(s) of the must-have project(s) need be allocated to remaining project combinations.34 Returning to our example, the first two projects might be must-haves. Together they would use up $145,000 of the available $150,000. Only the copier purchase could be funded with the remaining $5,000.

One very important caution: There is an assumption in the foregoing analysis that each of the proposed projects has roughly equal program or mission benefits; that is, each contributes to the organization's mission to roughly the same degree. Looking back at our list of projects, each is a general office-related investment, and it is not necessary to pinpoint the benefits of the various projects. We are not looking at allocation between various programs, some of which contribute more to mission achievement than others, with these projects.

9.5 FINANCIAL EVALUATION OF MERGERS, JOINT VENTURES, AND STRATEGIC ALLIANCES

(a) MERGERS AND ACQUISITIONS.  Some, but not all, mergers and acquisitions in the nonprofit sector are financially motivated. In these, the financial manager's role is pivotal. Either the CFO must do the financial analysis of the proposal, or locate a fellow staff member or consultant or board member who can do it. The CFO must translate the financial ramifications of the proposal to top management and the board in either case.

(b) MOTIVES FOR MERGERS AND ACQUISITIONS.  There are numerous reasons why organizations merge with or acquire other organizations, but most fall into one or more of these categories:

  • Synergy-programmatic
    • Geographic or service-offering extension
    • Competitive threat
    • Survival
  • Synergy-financial
    • Revenue enhancing
    • Cost reducing

(i) Programmatic Synergy. Synergy is commonly defined as “two plus two equals five,” or the whole is greater than the sum of the parts. The combined organizations are in the same or closely related industries. The key in programmatic synergy is in program accomplishment – quality and/or quantity. To illustrate, perhaps Alphanumerics has a widespread distribution network and Betaphonics has an advanced and very effective donor acquisition program. Together, the Alphabeta organization can expand the mission achievements beyond what either organization could do on its own.

(ii) Financial Synergy. When the efficiency of the combined organizations is such as to reduce costs or increase borrowing power, we have financial synergy. The enhanced financial strength that results is what propels the merger or acquisition. Quite often, programmatic synergy and financial synergy go hand in hand because effective service delivery and enhanced program achievements usually result in increased donations and the organization's borrowing power increases correspondingly. The factors that bring about financial synergy may be from revenue enhancement or from cost reduction. Exhibit 9.12 illustrates some of these factors.

Financial Synergy

Revenue-Enhancing Factors* Cost-Reducing Factors
New fundraising methods (e.g., face-to-face meetings) Sale of unneeded assets
Shared expertise Economies of scope (eliminate overlapping service networks)
Larger resource base to invest in fundraising Shared expertise
Initiation of business ventures Bring fundraising in-house if one or both of the organizations formerly relied exclusively on outside fundraising counsel
Increasingly risky business ventures can be initiated (due to larger net asset base, less-than-perfectly correlated cash flows)
Initiation or expansion of planned giving

* For this profile, “revenue” and “income” are used interchangeably.

Exhibit 9.12 Ways to Bring About Financial Synergy through Combinations

You should be aware of a couple of issues here. Earned income may be increased not only because of the initiation of ventures related to the core mission of either preexisting organization, but also because existing ventures may be expanded. Additionally, the new organization may take on riskier program activities and ventures (which typically offer greater revenue-expense differentials) due to the facts that (1) the new organization has a larger net asset base, and (2) the overall cash flows of the merged organization are more stable.35

Over on the cost reduction side, we key in on economies of scale and economies of scope. Economies of scale refer to lowered costs per unit of service delivered as the service quantity increases. Every organization faces some costs that are fixed (e.g., CEO salary), and the greater the output the less the fixed cost per unit of output (e.g., cost per meal served in a rescue shelter). One study in England and Wales finds that most nonprofits are currently too small to fully take advantage of available economies of scale,36 and we believe this is the case in the United States as well.

Illustrating, let's say salaries are $200,000 at Alphanumerics and $350,000 at Betaphonics; they would not be $550,000 ($200,000 + $350,000) at the combined Alphabeta. Duplicate workers would be let go in some areas (e.g., you don't need two fundraising directors), and as Alphabeta grows, the increased volume of service would not necessitate a proportional increase in workers. Specialization and division of labor account for much of the increased efficiency. Similarly, the land and building requirements of the merged organization might be 50 or 60 percent of the sum of the separate organizations. One area of savings is in the headquarters facilities. Reengineering opportunities have larger payoffs in bigger firms, generally. Summarizing, an organization experiences economies of scale whenever costs per unit fall as the scale of options is expanded.37

Economies of scope refer to sharing of costs across various programs. Computer resources can be shared by unrelated programs that two merging nonprofit organizations may offer. Fundraising efforts can be shared. The key is that the total costs of producing the products or delivering the services are less when joined in one organization rather than carried out by two separate organizations. Distribution and marketing costs are often given as prime examples of cost elements that can be shared, making the overall cost of delivering a given service lower. One example of this, elimination of duplicate service networks, is so important we have pulled it out as a separate item in Exhibit 9.12.

Commercial ventures are appealing not only for the revenues they bring in, but also because they often share costs with core service programs. Mergers and acquisitions often promise lower costs both because of scale economies and scope economies. However, businesses have tried to exploit these economies for much longer than nonprofits. Some of the spectacular failures come from unrelated diversification. We can learn three things from the lessons learned from the relative success of the many corporate mergers and acquisitions:38

  1. Trying to gain stability through a merger with or acquisition of an organization whose cash flows are high when your cash flows are low is extremely difficult. The goal here is to find an organization whose cash flows follow a different cycle due to economic risks that are quite different from the merger partner. The combined cash flow stream is more predictable, a safety factor that enhances financial viability for both entities when they join together. This is similar to the pooling-of-risks concept that underlies insurance. When one sector is hitting the skids, the story goes, the other should be doing famously well.
  2. Why has this concept been so difficult to apply? One reason is that it is most difficult to find organizations with cash flow streams exactly opposite to each other (see Exhibit 9.13). Instead, one may find an industry whose economic cycle turns a little sooner or later than the economy as a whole, or a “defensive” industry, such as soft drinks, which experiences less cyclicality of sales and cash flows. Graphically, the offsets in most cases are not as dramatic, as shown in Exhibit 9.14.

    Illustration of perfect offset for two organizations’ cash flows over time.

    Exhibit 9.13 Perfect Offset for Two Organizations' Cash Flows Over Time

    Scheme for perfect offset for two organizations’ cash flows over time.

    Exhibit 9.14 Partial Offset for Two Organizations' Cash Flows Over Time

    On top of this, it takes considerable skill to put the right mix of business together to achieve a stable cash flow “portfolio” (set of companies or organizations). The ideal merger or acquisition target organization may not be the right size for a match-up with yours, and even if it were, its growth rate may be quite different than that of your organization, meaning the combined mix is out of balance in a year or two.

  3. Related mergers or acquisitions may not be safer. Although it would seem to be less risky to deal with business and markets you already know, reaping the benefits may be elusive. The quality of the individual entities, how much integration it takes to gain the benefits of synergy (e.g., can the cultures be merged), how real the perceived “relatedness” is, and whether the combination provides improved competitive advantage are all key success factors.
  4. A strong management team at the acquired company is not sufficient. Having a strong management team at the target company may seem important, but in fact it is the acquiring company's management skill and resources that are essential for realizing merger-acquisition benefits. They must have the financial talent and managers that can conduct strategic analysis of diverse industries and markets.

On the positive side, two basic strategies have been found to work for businesses, and these guidelines should prove helpful to nonprofit organizations as well. Under each we see specific road maps.

Strategy 1: Increase the cash flow stream through synergy.

  1. Special skills and industrial knowledge of one partner can be used to solve competitive problems and opportunities the other partner is facing.
  2. In the long run, cost per unit can be reduced by investing in markets closely related to current markets. Associations have found this true in their mergers.39 They are able to benefit from:
    1. Scale effects
    2. Rationalizing of product and other important management tasks
    3. New opportunities for technical innovation
  3. Expanding business in an area of competence can lead to the development of a “critical mass” of resources necessary to do well in a market as a threshold size is reached (e.g., banks must be money centers or super-regional banks in order to have the size necessary to offer a broad range of cash management services).
  4. Transfer cash from cash-rich to cash-poor units to avert outside borrowing.
    1. Some businesses are always cash-rich (Microsoft); in a nonprofit organization, some programs always need to be subsidized. These may be core programs.
    2. Each area may have different cyclical or seasonal patterns of cash surpluses or cash shortages.
  5. If a company is diversified, direct cash-rich areas to provide funding to areas that are currently cash-poor, but soon to be cash generators – increasing long-run profitability (cost coverage) for the organization as a whole.
    1. Low-growth area sends funds to high-growth area.
    2. Internal market intelligence of diversified company can be valuable as information is shared.
  6. Through pooling of risks, the diversified company can have lower borrowing costs and do more borrowing, if it so desires.
    1. It gains a larger debt capacity.
    2. It requires a smaller target liquid reserve (not including debt).

Strategy 2: Decrease risk.

  1. Reduce variability of the cash flow stream so that it is less than just the average of the variability of the two separate entities. This refers to the offsetting cash flow patterns we graphed in Exhibits 9.16 and 9.17. Down cycles in Organization 1 are partly offset by the up cycles in Organization 2, so that Organization 1 + 2 is on more solid footing than either organization was independently. This feeds back to lower borrowing costs in Strategy 1.F.
  2. By acquiring or merging with a unit that consistently generates positive operating cash flows, the organizational self-funding of core programs whose cash expenses exceed cash revenues becomes possible. Funding risk is reduced.

What is the bottom line in many business combination failures? Failure comes because companies (1) merge with or acquire what is readily available, not what “meets sound strategic and economic criteria”; (2) pay too high a price for the acquisition; (3) do not necessarily have the resources and management commitment to exploit the potential advantages; or (4) have too-different cultures.

(c) PARTNERSHIPS, JOINT VENTURES, AND STRATEGIC ALLIANCES.  Cross-organizational strategic alliances, partnerships, and joint ventures provide a less costly or significant change than mergers or acquisitions, while enabling some of the same resource- pooling benefits. We begin our discussion with partnerships and joint ventures.

A formal partnership is defined as an association of two or more entities or persons to carry on a business for profit as co-owners.40 Because it is looked upon by the IRS as a pass-through entity, a partnership is not taxed. Instead, the partners are liable for income tax.41 A joint venture does not involve an ongoing relationship among the two parties but is a one-time setup of at least two persons or entities in a business undertaking. However, a joint venture is treated as a partnership when it comes to federal income taxation. The motives for these combinations are usually to expand and/or diversify program activities.

Often the nonprofit does not have the financial resources to launch or expand some program or service that it wishes to provide. Yet the managers may not want to start a social enterprise or be able to get ongoing grant funding. By setting itself up as the sole general partner in a limited partnership, it can tap the limited partners (e.g., cash-rich pension funds or profit-sharing plans) for needed capital. Most joint ventures have involved healthcare or university organizations. These organizations mostly cite the need to raise capital as the motive for engaging in joint ventures. The primary caution to be noted is that the nonprofit as general partner may jeopardize its Section 501(c)(3) exempt status if the joint venture conducts an activity unrelated to its charitable purpose. The IRS is watching healthcare joint ventures to ensure that the nonprofit partner does not cede control to the for-profit partner.42 The joint venture should be structured to allow the nonprofit to further exclusively its charitable purposes, protect its exempt assets, and not allow for private individuals' benefit and inurement. Instead of being part of a joint venture itself, the nonprofit may form a subsidiary or affiliate to serve as general partner. Another alternative is for the nonprofit to serve as a limited partner in the joint venture when the partnership does not further the organization's exempt purpose.

Another possible setup, having partnerships with other exempt organizations, must further the exempt purpose of each organization in order for each organization to be exempted from paying tax on its share of the income earned. Otherwise, the organization must pay unrelated business income (UBI) tax based on its share of income and expenses.

Why should your organization be interested in partnerships and joint ventures? First, some non–income-producing informal partnerships can be established that help your organization better achieve its mission without added financial or manpower drains. A great example is the Minnesota Housing Partnership, which has seen its role in ensuring that Twin Cities' affordable housing expand in services offered (including financing), geographic scope, and coordination benefits to partner organizations.43 Another example is in higher education: Colleges and universities may contract with for-profit distance learning providers in order to be able to offer online classes to their students. Second, consider the reasons healthcare organizations give for engaging in joint ventures:44

  • Raise needed capital.
  • Grant service providers (physicians) a stake in a new enterprise or service, thereby increasing physician loyalty and patient referrals.
  • Bring a new service or facility to a needy area.
  • Share new enterprise risk.
  • Pool various areas of medical competency.
  • Attract new patients.
  • Induce physicians not to refer patients elsewhere.
  • Prevent physicians from establishing a competing healthcare operation.

Some of these motivations will pertain to any nonprofit arena, particularly the need to raise capital, the desire to bring a new service or facility to a needy area (such as the low income housing joint ventures that have sprung from the low-income housing tax credit),45 risk sharing on a new enterprise, and competency pooling. The finance office can make a special contribution to the managerial discussions regarding the need to raise capital, and in fact may have originally surfaced the need for a joint venture by documenting a funding shortfall in the long-range financial plan. At a minimum, the financial manager can assist in determining the amount of capital that should be raised. Also, regarding risk sharing, through the use of scenarios, the finance staff can show the financial effects of uncertain future outcomes of a proposed new venture, helping top management to see the benefit of engaging in a joint rather than a sole venture. Recall that target liquidity is the primary financial objective of the nonprofit, and when there is evidence of a high probability that a go-it-alone venture will financially cripple the organization one has a strong impetus to investigate and properly structure a joint venture.

(d) STRATEGIC ALLIANCES.  When two or more organizations agree to pool resources and skills in order to achieve common goals, as well as goals specific to each organization, the pooling creates a strategic alliance. These cooperative arrangements are often multiyear – when businesses enter into joint ventures these may last for 30–50 years – and may encompass just one functional area or activity (e.g., marketing) or more than one functional area (e.g., manufacturing and marketing). Let's consider two examples. First, the Fox Cities Children's Museum in Appleton, Wisconsin, was given a collection of dolls. The museum did not know how best to exhibit the dolls, so it allied with a local business. The owner of the business, Roxanne's Doll Shop, first volunteered as curator of the doll collection and then came aboard as manager of the museum's gift shop when that shop was later revitalized.46 Another example is the alliance between the Stairstep Initiative, a grassroots organization committed to building up the African American community on the north side of Minneapolis, and Glory Foods of Ohio. The Stairstep Initiative hopes to bring jobs to an economically distressed area of Minneapolis through economic development. It wanted to start up an inner-city manufacturing partnership, and after initially partnering with General Mills to develop a food packaging factory, it came into contact with Glory Foods of Ohio. Based on mutual interests, the two companies formed an alliance creating a manufacturing plant called Siyeza. This plant employs 60 people from the northside of Minneapolis and produces a family-size meal product line for Glory Foods.47

Strategic alliances encompass equity joint ventures, in which two organizations both contribute capital to a third organization, and share in profits and risks. Given our focus on nonprofits, we will focus in this section on nonequity ventures, another form of strategic alliance. Nonequity ventures include initiatives such as a joint service development team or a cooperative advertising campaign. The latter types of ventures are more flexible and can be revised, restructured, or ended more easily. Note the word “strategic”; if a vendor and a customer are simply tying their purchasing and supply systems together, this is an operational partnership as opposed to a strategic alliance. The purpose of strategy is to advance mission achievement through selection of markets served, new service development, and similar activities.

(i) Motives for Strategic Alliances.  Adapting from the excellent review of business strategic alliances compiled by Varadarajan and Cunningham,48 nonprofits may benefit for several reasons. They:

  1. Broaden service line/fill service offerings gaps
    • Fill gaps in current service offerings
    • Broaden present line of services
    • Differentiate or add value to the service
  2. Enter new services domains/gain a foothold in emerging industries or industry segments
    • Diversify and take advantage of growth opportunities in new services domains (due to traditional market stagnation)
    • Gain foothold in areas where alternative, substitute technologies are developing by allying with organizations already exploiting those technologies
  3. Enhance resource use efficiency, lowering costs by taking advantage of:
    • Scale, scope, and experience effects
    • Differential costs of labor, raw materials, or other inputs
  4. Extend resources, particularly when a merger (and loss of corporate identity) is unacceptable but the organization cannot manage the internal development or acquisitions
    • Especially for smaller organizations that do not have the resources to invest in research and development (R&D), capital equipment, new products or services, and other activities necessary for meeting the needs of clients

We are most interested in same-industry, or intra-industry strategic alliances. Why would a nonprofit wish to form an alliance with another organization currently competing for resources in the same geographic market(s) or with another organization which constitutes a potential competitor? By pooling product or service development costs, production/delivery costs, and/or marketing resources, the two (or more) organizations may be able to seize new service or market opportunities that neither organization could seize on its own. Many times, however, the perceived competitive threat may not be large because the services provided are geared toward different clienteles or the organizations are separated far enough geographically that their service areas do not (and will not) overlap. Most nonprofits are already members of a trade association (e.g., the homeless shelters holding membership in the Association of Gospel Rescue Missions [AGRM] or the many foundations comprising the Council on Foundations) and understand what the benefits are of banding together when there is no competition between the vast majority of the members.

(ii) Financial Aspects of Strategic Alliances. Joint fundraising alliances, such as the new donor development program coordinated for faith-based rescue missions by the AGRM, illustrate that the function that a nonprofit alliance is built around may be fund development. Fundraising is part of the treasury function in corporations, and is therefore legitimately characterized as a finance function strategic alliance.49 In a case such as this, the first task for the finance office should be ready to make the argument for cooperative fundraising, showing the efficiencies (real cost savings) involved as well as the commonly noted potential for more funds to be raised.

Second, the finance office will have to be ready to project the needed financial resources that are the driving force between most strategic alliances (as well as for partnerships, joint ventures, and mergers). Management teams will be naturally reluctant to enter into such arrangements. Management might fear donor attrition, to the extent the alliance partner is either (1) a potential draw to this organization's donors, or (2) viewed negatively by this organization's donors, who will in turn react negatively when hearing of the alliance.

Furthermore, their management may not want to give up operating autonomy. Varadarajan and Cunningham make the point that whenever an organization has financial resources to either acquire or internally develop the skills and other resources needed to exploit a market opportunity, it is quite unlikely to enter into a strategic alliance due to a loss of operational control. The desired resources include assets, capabilities, organizational characteristics and processes, information, and expertise. So alliances are not necessarily cost related; business alliances have been predominant for achieving market or sales growth and for gaining access to new markets.

Third, the financial manager should highlight the risks of strategic alliance, because she or he has ultimate responsibility for asset protection. Two major risks are the possible “stealing” of skills by the alliance partner and the possibility of becoming overly dependent on alliances. Both of these are lesser issues to nonprofit organizations than for businesses trying to protect and build manufacturing and R&D capabilities.

(iii) Financial Projections of Mergers, Acquisitions, or Joint Ventures. Financial spreadsheet software is ideally oriented for projecting the before-and-after financial positions of an organization. Spreadsheets have built-in scenario (or version) managers to assist the analyst in quickly generating optimistic, most likely, and pessimistic cases for a proposed merger, acquisition, or joint venture.

As an example, let's look at the before-and-after situations of a private school considering a merger with another private school. After projecting combined enrollments and cost savings due to the larger size and the ability to share costs, the analyst ends up with the data shown in Exhibit 9.15.

Item Present Statement of Activities ($) Proposed Merger Statement of Activities ($)
Revenues:
 Tuition $300,000a $920,000f, g
 Fundraisers 25,000 65,000
 Meal revenue 15,188b 40,500h
 Other 3,200 5,000
Total revenue: 343,388 1,030,500
Expenses:
 Salaries and wages 225,000c 325,000i
 Employee benefits 48,000 72,000
 Insurance 30,000 32,000
 Materials 35,000 45,000
 Rent 20,000d 20,000
 Utilities 14,400 16,400
 Interest 6,000e 6,000
 Other 3,250 5,000
Total expense: 381,650  521,400
Surplus/(Deficit): $(38,263) $509,100

a Based on 150 students × $2,000 tuition

b Based on $1.25 × 60 students eating on average × 5 days per week × 9 months × 4.5 weeks per month

c Based on faculty/administration of eight

d The main school building is rented

e Offices (with a multipurpose room) constructed with borrowed money

f Enrollment projection w/merger: 400

g Tuition projection w/merger: $2,300

h Meal revenue w/merger: $32,400

i Based on faculty/administration of twelve

Exhibit 9.15 Merger Analysis Worksheet

Why the cost reductions from a merger? Salaries are fixed up to a point, meaning they do not change with small changes in enrollment. Administration costs (principal's salary and benefits) are fixed, and only one principal is needed for the merged institution. Registration and/or certification fees that the school must pay are fixed. Labor, energy, and maintenance expenses are not totally fixed but are, rather, step-function or semivariable costs. Some expenses will vary by headcount but are also partly controllable—travel, supplies, and technology.50 The combined school can order maintenance and office supplies in larger quantities, gaining quantity discounts. Other administrative costs – office related, financing, and purchasing – also decline on a per-student basis as enrollment increases due to the merger. As the number of students increases, these fixed costs, when figured on a per-student basis, decline.

The proposed merger is a winner, financially, from the vantage of the merger partner doing this financial analysis. Using scenario analysis (Exhibit 9.16), even the worst-case scenario from our school's perspective is (1) better than the current situation, and (2) a generator of a fiscal surplus, which can be used to replace aging plant and/or build endowment reserves.51

Scenario Summary Most Likely Worst Case Best Case
Changing cells
Enrollment projection with merger 400 325 500
Tuition projection with merger $2,300 $2,000 $2,400
Surplus or deficit $509,100 $231,506 $799,225

Exhibit 9.16 Scenario Summary

9.6 FINANCIAL PLANNING AND CAPITAL BUDGETING IN PRACTICE

We review here some evidence regarding program evaluation capital budgeting and long-range financial planning.

Evaluation may be built into existing programs and can benefit from the use of an external evaluator who brings credibility without adding significant cost. Such program evaluations contribute to organizations' planning efforts, based on a study done by mail, telephone, and on-site investigation.52 Nonprofits believe they are ill-equipped to conduct program outcome assessment in many cases. Very few nonprofits have received training in outcome measurement, outcome data analysis, or service improvement strategies based on outcome results. This study noted that “most organizations performing outcome measurement are just beginning to become comfortable with it and to use the information to improve programs and support other activities such as marketing or fundraising.”53 Strategic and long-range financial planning have no doubt been hampered by measurement inadequacies, but should improve over time as this information gets used in planning processes.

Those organizations deemed successful based on meeting two financial goals – having a balanced budget without borrowing from an endowment or tapping cash reserves – were more likely to evaluate sources and uses of funds, forecast revenues and costs, and prepare detailed financial projections before making major decisions. This was discovered in a small-sample strategic planning study conducted by William Crittenden.54

A major study of hospitals' capital expenditures indicate that there is a significant gap between “have” and “have-not” hospitals: Hospitals with strong balance sheets (good liquidity, reasonable debt) and a “successful strategic capital planning process” are investing enough to more than offset depreciation. Struggling hospitals, however, become less creditworthy, losing access to capital, and struggle to keep current with today's demands but seem unable to build for tomorrow's needs.55 Another survey finds that 41 percent of hospitals' capital budgets went for major modernization, 14 percent for new programs, 14 percent for medical equipment, 14 percent on information systems, 5 percent on other equipment, and 5 percent on code compliance.56

Most of the 254 nonprofits surveyed in the Denver and Boulder areas foresee significant capital expenditures in future years. Of the 254 surveyed nonprofits, 88 percent foresee client population growth within the next five years, 60 percent asserted that current facilities would be unable to meet those needs within five years, and most said that the reason for this would be inadequate space for future programs. There was also considerable concern regarding the quantity, cost, location, and quality of space available.57

Most surveyed Indiana nonprofits do not have financial reserves dedicated to projected capital needs or to facility maintenance. These reserves could be used to cope with unexpected outlays for repair or replacement, but only 44 percent of Indiana nonprofits have reserves for maintenance needs and only 35 percent have reserves for capital needs. Faith-based nonprofits were the most likely to have these types of reserves, and arts/culture/humanities and mutual benefit nonprofits were the least likely to have reserves.58

With respect to capital budgeting evaluation techniques, an early study indicates that the payback method (how many years to recover the initial investment) was used by 45 percent of faith-based respondents, and 30 percent used cost-benefit analysis. A mere 7 percent used ROIC, and 4 percent used NPV in project evaluation.59 A recent study, not of nonprofits but of Canadian municipal governments, finds a minority use formal capital budgeting evaluation techniques, and those that do tend to use the payback techniques despite the fact that it ignores the time value of money. More emphasis is placed on quantitative/financial factors than on qualitative/intangible factors.60 The best news, though, comes from a recent study of US nonprofit agricultural coops: Over 50 percent used NPV, ROIC, or the benefit-cost ratio (profitability index) in their capital project evaluations.61 We expect to see wider adoption of sophisticated techniques as proficient financial management becomes valued more highly by nonprofits. In a study of arts organizations' investments in facilities, Woronkowicz finds that when they used some debt financing, (1) 93 percent experienced one or more years of deficits in the years after facility completion, with most of the organizations (63.6 percent) running one or two years of deficits, and the remainder running at least three years of deficits; (2) on average nonprofits that invested in facilities experienced increases in expenses while revenues remain unchanged; (3) a primary reason for #2 is that borrowing-related costs contributed to higher expenses (the majority of the organizations used at least some debt financing).62

Perhaps the ultimate scorecard for long-range financial planning and capital budgeting practices is whether or not an organization monitors impact and performance against its strategic plan. At the board level, the evidence shows room for improvement. When 381 nonprofit board chairs and 1,379 chief executives were asked “Is the board is good at monitoring performance and impact against strategic plan?,” only 54% of the respondents gave their board an A or B grade (BoardSource “Leading With Intent” study).63 Clearly this finding is linked to whether or not a balanced scorecard or dashboard indicators are used (see Chapter 3), but performance-against-financial plan should also be a valuable tool for monitoring performance against strategic plan. Asked whether “Board members appropriately balance short-term and long-term needs,” directly relevant to our topics in this chapter, 64% of executives and 74% of board chairs agreed or strongly agreed, which leaves around 25% or 35% of the organizations seeing a need for improvement in this regard.64 Long-range financial planning will enable organizations to reset and manage toward a liquidity target while anticipating and arranging the funding necessary to achieve financial sustainability.

9.7 CONCLUSION

Long-range financial planning and proper capital allocation are vital parts of ensuring a prosperous and mission-achieving future for your organization. Making sure you have a business model that positions your organization for financial sustainability, as we suggested in Chapter 3, is vital. We have focused on the role of financial staff in the development, evaluation, and implementation of these plans. Occasions that make long-range financial planning especially critical include these observed by consultant Hilda Polanco:

  • Increasing personnel costs, especially associated with medical insurance
  • Relocation costs as a property lease nears expiration
  • Conclusion of a significant multi-year grant
  • Possibility of reduced revenue from public sources as government budgets shrink
  • Demographic or other social shifts that may affect the scope and nature of an organization's programming65

The power of financial spreadsheet software and newer special-purpose planning software for forecasting and proposal evaluation has been demonstrated. We have also seen that nonprofit organizations are increasingly turning to interagency collaborative arrangements including partnering, strategic alliances, and mergers in order to leverage scarce resources. Informal partnerships, often labeled strategic alliances, abound. These may involve many organizations, underscoring the importance of having all organizational personnel work together as team members to communicate and implement the strategic plan. Financial personnel will be the first line of defense to avert financial catastrophes when the organization attempts to move too quickly or when necessary funds do not come in on a timely basis. Finally, financial strategies and policies can be developed or revised by the finance staff, with appropriate approvals by senior management and the board of directors.

Notes