1 kilo to 10 kilos
(2.2 pounds to 22 pounds)
400 g CO2e recycled paper, with every copy printed getting sold
1 kg (2.2 pounds) CO2e average
2 kg (4.4 pounds) CO2e the same book on thick virgin paper, with half the copies getting pulped
> The carbon footprint of a typical paperback is about the same as watching 12 hours of programs on an average TV.
Overall, reading is a low-carbon activity, and there is plenty of room for it in the sustainable lifestyle.* Why? It’s hard to drive or shop while you read. For a short while, a gripping novel halts the consumerist lifestyle in its tracks.
My average figure is based on a 250 g book printed on paper from a mix of virgin and recycled pulp.1 I’ve assumed that 60 percent of all copies made are actually sold, even though I’ve heard more pessimistic estimates than this. The economies of scale in printing are such that it pays to print too many.
At the high end, the same book is printed on heavyweight high-gloss virgin paper and weighs 350 g. Half of the print run is pulped without ever hitting the shops.
At the low end, the book still weighs 250 g but is printed entirely on recycled paper. Roughly speaking, it takes about twice as much energy to make paper from trees as it does from recycled pulp—though the actual value varies enormously depending on the efficiency of the paper mill and the quality of the paper.
What you are reading right now doesn’t yet exist as I write, but I’m guessing that, in carbon terms at least, you are holding a better-than-average paperback because my publisher thinks about these things. However, once you stop to think about it, there are all sorts of difficult questions about what to include in the sums. I haven’t included the electricity burned by my computer as I’m typing right now, or any part of the footprint of my publisher’s offices at Greystone, or a host of other possible elements.
Nonetheless, I hope this book pays for itself in carbon terms fairly easily. You have to cut out only about three car miles to cancel out its production.
All carbon footprints need to be thought of in terms of “bang for buck”: do the benefits outweigh the impact? To maximize the “bang” side of the equation, you simply have to read this book, talk about it, and pass it around.
Electronic book readers deserve a mention. I guesstimate that an e-reader such as Kindle, Kobo, or iPad has a footprint of around 50 kg.2 If I’m right, you’d have to get through at least a hundred paperbacks (bought new and then sent to recycling) before the paper savings outweighed the embodied emissions of the reader itself. This is before electricity consumption of the reader and in IT networks has been taken into account. E-readers may be wonderful devices, but I can’t see a carbon argument for getting one, unless it gets you reading more. You can’t yet take them in the bath, but potentially you can have your favorite e-bookshelf with you almost wherever you go.
1 kg (2.2 lbs.) CO2e an 800 g (1.8 lb.) loaf
> Bread is good stuff: a year’s calorific intake can be had for around half a ton CO2e. That’s only 5 percent of the 10-ton lifestyle and one-sixth of the current U.K. diet.
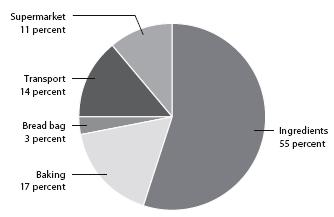
As Figure 5.1 shows, just over half the emissions of a loaf of bread come from the actual growing of the ingredients. About one-sixth is the baking. Transport is typically one-seventh, and the supermarket itself adds about one-ninth. The bag is a very small consideration—and if it helps to keep the bread fresh for longer, it is probably well worth it.
Bread is a great low-carbon food provided we actually eat it. There’s the catch. It gets thrown away because we are fussy eaters and because it doesn’t keep well. Tristan Stuart’s eye-opening book Waste has a picture of a Marks & Spencer sandwich factory systematically discarding four slices from every loaf: the crust and the next slice from each end.3 The remaining slices get made into fresh sandwiches and are still at risk of being trashed before they are sold. Only once safely through the checkout do the odds of a sandwich being eaten start looking good, but there are still such hurdles as children who won’t eat crusts and over-catered corporate lunches.

FIGURE 5.1: The footprint of bread at the supermarket checkout.
Loaves sold straight to consumers are no better, because the shelf life is so short. Plenty is trashed by the supermarkets, and plenty more goes stale in bread bins or ends up in a half-eaten sandwich. To keep the carbon cost of your bread to a minimum, buy only what you need, enjoy the crusts, and get your children to do the same. Find uses for stale bread: as toast, as an accompaniment to soup, and so on. And buy smaller loaves if you are not getting through the larger ones— the introduction of the 600 g loaf will help with this.
400 g CO2e from a carton, with few road miles
1,040 g (2.3 lbs.) CO2e average
1,500 g (3.3 lbs.) CO2e over-elaborate bottles, transported for thousands of miles by road
> So if you drink three bottles of typical wine per week, which is pushing the limits of a healthy lifestyle, that is about 150 kg (330 lbs.) per year, equivalent to driving 210 miles in an average car.
My estimates here are based on a study I did for Booths supermarkets (Figure 5.2). For a typical bottle, just over one-third of the footprint comes from the production of the wine itself. Whether or not it is possible to reduce this by buying organic wine is not clear, although there may be other environmental benefits of the organic option. It is difficult to know from the label what the carbon intensity of a particular vineyard is, so I have just given all wine a typical value, based on various studies.
The glass bottle accounts for a similar amount of carbon to that of the wine it contains. There is a simple savings to be made here: by buying wine boxes or cartons, you can reduce the footprint of the packaging by a factor of about five. In doing so, you will also reduce the weight, so transport emissions can also be slashed by one-third. There will be absolutely no loss of quality, even though you might lose some choice. If the carton offends you, you can always decant the wine into a jug.
There is a lot that can be done without getting rid of the glass altogether. Organico is a wine distributor near where I live that has started importing some of its wine unbottled. This cuts the transport weight. It does its own corking and puts a £2 ($3) deposit on the bottles, which are themselves 15 percent lighter than normal and are made from clear glass because this is better for eventual recycling. One further nice touch is that they have done away with the concave bit under the bottle that has always struck me as fundamentally dishonest.
Note that shipping is only a small component, so it doesn’t matter all that much what continent your wine comes from. Far more important are the road miles—both in your country and in the country of origin. For this reason, locally produced wine could cut the footprint by 25 percent, provided that your neighborhood has the right kind of climate. A New Yorker is probably better off drinking wine shipped from Europe than by road from closer-by California.
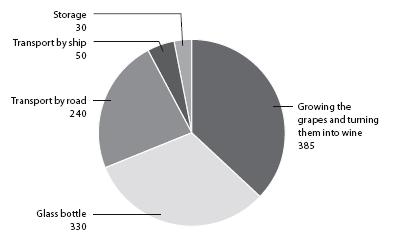
FIGURE 5.2: The carbon footprint of a bottle of wine (in grams CO2e).
Because it is less dilute, wine often turns out to be a slightly less carbon-intensive way of taking alcohol on board than beer (see A pint of beer).
All these calculations assume that you recycle any packaging.
Cork, plastic, or screw top? In carbon terms all are insignificant (see misdirection of attention), but the good old-fashioned cork won’t be in any danger of bobbing around in circles in the Pacific for a thousand years.
0.75 kg (1.7 lbs.) CO2e Ecosheet
1.7 kg (3.7 lbs.) CO2e PET for plastic bottles, from recycled materials
3.4 kg (7.5 lbs.) CO2e polystyrene from virgin materials
3.5 kg (7.7 lbs.) CO2e average
4.4 kg (9.7 lbs.) CO2e polypropylene for injection molding, made from virgin materials
9.1 kg (20 lbs.) CO2e some types of nylon4
Plastic is such useful stuff: it’s tough, durable, and waterproof. No wonder we use so much of it. Unfortunately, plastic tends to be so durable that it hangs around in landfill sites for centuries, clutters up the stomachs of animals and fish, transforms remote Scottish beaches into junkyards, and ends up in almost every ecosystem you can think of. But from a purely carbon perspective, its inability to rot is good news in as much as it won’t add to methane emissions from landfill: if we assume that the plastic is put in the trash rather than tossed into a street or field, those hydrocarbons are going back underground where they came from.
As the figures above show, the footprint of making plastic from virgin material is about double what it would be if recycled products were being used. The challenge for recycling plastics is that it’s difficult but necessary to separate the various types and process them separately. This isn’t true for Ecosheet, however. This brand-new construction material can be made from the full range of different plastics, so almost nothing goes to landfill. Once you have finished with it, the sheeting can even be reworked into new boards. The makers, 2K Manufacturing, told me that they don’t even need to heat up waste plastic to the usual recycling temperatures to create their boards. As I type, only a few sample boards per day are being produced, but by the time you read this, full production is expected to have been underway,5 the Science Museum in London will have used the stuff to build its new exhibition on climate change, and it should be available in North America. Biodegradable plastic packaging is worth a mention because it can be a well-intentioned disaster area. It sounds great, but if you send it to landfill, it rots down and emits methane, and if you throw it into the recycling, it can ruin the entire batch. It should be compostable instead, but I have also heard that it releases chemicals that slow down the degrading process for the rest of the trash or heap.
Zero CO2e heated by solar energy
0.5 kg (1.1 lbs.) CO2e modestly filled, efficient gas heater
1.1 kg (2.4 lbs.) CO2e generously filled, efficient gas heater6
2.9 kg (6.4 lbs.) CO2e generously filled, electric water heater
> A daily bath adds up to between 180 and 1,050 kg (between 396 lbs. and 2,310 lbs.) CO2e per year—that’s between 2 and 10 percent of the 10-ton lifestyle.
In our family at least three of us often end up using the same water, even if not all at the same time. (Anyone who’s been running through mud has to go last.) Since we top up with hot, the bath is always full to the brim by the end. That is about 120 liters (31 gallons), giving a footprint per person of around 400 g.
If you were to read a book in the bath for an hour, you’d probably add 50 percent to the footprint of the average full bath by pulling out the plug with your toes from time to time and topping up with hot. So the actual leisure activity would be 500 g (1.1 lbs.) per hour on top of the functional bath itself. That is quite a bit higher than most TV watching but still a lot lower than any pastime that involves using a car.
In winter you can reclaim about half the heat simply by leaving the plug in until it goes cold. This works provided that you actually want the heat in your bathroom and don’t object to the idea of old bathwater hanging around.
The comparison with showers (see A shower) might be a surprise. Electric showers on the market range from 7 kilowatts at the weedy end to 11 kilowatts at the powerful end. For the same impact as a full bath from an efficient gas furnace you could have a 9-minute high-volume “power shower” or a 13-minute weedy shower. In comparison with sharing bathwater, you would have to be a family of fast scrubbers to make the electric shower win out. That’s even without taking account of any bathwater heat reclaimed (which isn’t an option for the shower unless you have a plug and are prepared to stand in an ever-deepening pool). To be fair, though, showers where the hot water comes from a gas furnace, which is increasingly the norm, are much more carbon efficient and generally will work out as using less energy than a bath unless the latter is shared among many people.
What about other options? A trip to the swimming pool could have a much higher impact than a bath, even if you were to walk there (see A swimming pool), whereas a wild swim comes out best of all—though not many of us live near a clean and safe river or lake.
Overall, baths do serve a purpose, and even the most luxurious needn’t be too bad as long as they are not electrically heated. Then again, if everyone in your household has extravagant bathing habits, they could easily come to over 1 ton per year.
125 g CO2e a 250 g pack, local and seasonal
1.9 kg (4.2 lbs.) CO2e the same pack, air-freighted from Peru to the New York in January
3.5 kg (7.7 lbs.) CO2e the same pack, air-freighted from Peru to the U.K. in January
> If you live in New York and your entire diet were as carbon intensive as long-haul asparagus, your food footprint alone would be more than the entire footprint of the average North American. If a Londoner did the same, the footprint of his or her food alone would be more than three times the average U.K. citizen’s total footprint.
The numbers here are based on data from Booths supermarkets, which to their credit took steps to increase their local sourcing when they saw the impact of the Peruvian product and are now emphasizing the benefits of seasonal food more strongly than ever. Air-freighted from Peru to New York, asparagus comes in at 8 kg CO2e per kilo (3.6 kg CO2e per pound) or, to put it another way, about 40 g of carbon per calorie. It is over 50 times more carbon efficient to get your calories from bread.
When produce is being moved, a mile by air has more than 100 times the climate impact of a mile by sea. This is because it takes a lot of energy to keep a plane in the air—and also because engine emissions tend to do more damage at high altitude than they do at ground level (see Flying from Los Angeles to Barcelona). For this reason it is difficult to see how there can be any place at all for air-freighted food in a sustainable world.
Examples of other foods that are very likely, when out of season, to have been air-freighted or (just as bad) grown in an artificially heated greenhouse include baby corn, baby carrots, snap peas, small green beans,7 fine beans, okra, shelled peas, lettuces, blueberries, raspberries, and strawberries.
At the other end of the scale is asparagus grown in season in your own country. This cuts out a staggering 97 percent of the footprint. When asparagus is out of season (which is most of the time), try to favor low-carbon options such as kale, carrots, parsnips, turnips, or leeks.
Flying from closer-by California, Washington, Michigan, or even Mexico has less impact than flying from Peru. And at each end of the local asparagus season there are periods in which a small amount of heating makes the crop viable.
None of the estimates here include the footprint of cooking the food, which is likely to be around 100 g CO2e if you simmer it for 8 minutes with the lid off.
A final comment: the recipe book I consulted advised strongly against air freight on taste grounds, stressing the importance of eating asparagus within 48 hours of harvesting.
0.6 kg CO2e washed at 30°C (86°F), dried on the line
0.7 kg CO2e washed at 40°C (104°F), dried on the line
2.4 kg CO2e washed at 40°C (104°F), tumble-dried in a vented drier
3.3 kg CO2e washed at 60°C (140°F), dried in a combined washer-drier
> If you wash and dry a load every two days, that’s equivalent to 440 kg (970 lbs.) CO2e, which is like flying from London to Glasgow and back with 15-mile taxi rides to and from the airports.
Modern washing powders work just as well at 30°C (86°F), so there is a very simple savings to be had here of 100 g CO2e per wash just by turning the temperature down. But the bigger savings relate to drying. As the numbers above show, for a typical 40°C (104°F) wash nearly three-quarters of the carbon footprint comes from the drying rather than the washing. Tumble driers generally use electricity to generate heat. This is more than twice as carbon intensive as generating heat from gas. If you use a conventional vented drier, most of the heat is simply pumped out to the outside world, so overall it’s a wasteful activity. Condensing driers use a little bit more energy still, although, in winter at least, all that heat stays inside your house, where it is probably of some use.
Overall, a household running the tumble drier 200 times a year could save nearly half a ton by installing a clothes rack inside and a washing line outside. In winter the evaporation from drying clothes will cool your house down slightly, but it’s a marginal effect, and on a baking hot summer’s day, our clothes drying in the kitchen act as free air-conditioning.
Make sure that your washer has a good spin function. It is much more efficient to remove most of the water by spinning it off than by evaporating it.
All the figures listed above are based on a full 5 kg (11 lb.) load (half loads use a little less energy each time, but they work out as much less efficient per garment washed). I’ve allowed around 220 g per wash for the embodied emissions in the appliances themselves.8 If this estimate is correct, the manufacture and delivery of the appliances account for nearly 10 percent of the total carbon footprint of each wash.
You can probably improve on the lifetime of your washer and/or drier if you look after it and get it repaired when it breaks. Switching from a typical 1998 machine to a new one with an “A” rating might gain you around 10 percent in efficiency9; in other words, roughly enough to offset the emissions required to make the new machine but no more. So the message is that unless your machine is particularly cranky and inefficient, there is no real carbon case for getting a new one.
While on the subject of washing, have you optimized the frequency with which you wash stuff? I don’t want you to start going around smelly, but it’s worth asking the question: does stuff go in the wash unnecessarily often? If you can reduce the number of washes you do without upsetting anyone, there is a time savings to be had, too, so it’s a great example of life getting better as the carbon comes down.
1 kg (2.2 lbs.) CO2e veggie burger
2.5 kg (5.5 lbs.) CO2e 4-ounce cheeseburger
> If you eat a cheeseburger each day, that’s a massive 910 kg (2,000 lbs.) CO2e per year—the same as driving 1,500 miles in a fairly efficient car and just over 1 month’s worth of ration in the 10-ton lifestyle.
The 4-ounce cheeseburger described here provides 515 calories. If this were the only type of food you ate, the average man would need about five burgers per day provided he didn’t do much exercise. (The average woman could get away with one fewer.)10 If you managed to keep up this diet for a year without killing yourself, you’d cause about 4.6 tons of carbon emissions just through your food.
The cheeseburger’s footprint breaks down as shown in Table 5.1.
The biggest factors here are the beef and the cheese. As we’ve already seen, animal products tend to be more carbon intensive than vegetables and grains because animals consume a lot of energy just to keep themselves warm and move around. This makes their job of converting animal feed into meat and milk inherently inefficient.
There is another big problem with beef and dairy farming. Cows, like sheep, are ruminants. This means that they belch out methane, a greenhouse gas 25 times more potent than CO2. The result is that beef and lamb have around double the carbon footprint per kilogram of meat compared with that from pigs.
| Component | Grams CO2e | |
| Beef (108 g) | 1,910 (4.2 lbs.) | |
| Cheese (20 g) | 250 | |
| Bun (40 g) | 50 | |
| Salad (20 g) | 10 | |
| Condiments (20 g) | 80 | |
| Cooking and transport | 200 (approx.) | |
| total | 2,500 (5.5 lbs.) | |
TABLE 5.1: The carbon footprint of a 4-ounce cheeseburger.
A further consideration is that excessive demand for meat provides an incentive for deforestation because it raises the demand for arable and grazing lands. That said, there is plenty of land, for example in the U.K., that is fit for cattle and sheep farming but not for crops, and there can be a conservation benefit in having animals on the land.
It is unclear whether the footprint of the burger could be reduced by using organic or free-range meat and cheese. The Cranfield University study11 I have used for my figures found that organic cattle farming had few or sometimes negative carbon benefits. However, the organic farmers I know who have studied this report were scathing of the assumptions made about organic practices and yields. The carbon benefits of rough grazing are also unclear. On the one hand less feed is required, but on the other hand there are complex implications on yield and rumination.
At the time of writing, my inclination is to say that a low-carbon diet can safely contain a bit of beef and lamb from rough pastures, but the whole area clearly warrants further research. And in the meantime, there’s always the low-carbon veggie burger option.
See also Steak and Deforestation.
3.15 kg (6.9 lbs.) CO2e
> In the U.K. we get through about 50 billion liters (13.2 billion gallons) of gas and diesel per year. That’s something like four bathfuls, right up to the brim, for every man, woman, and child in the land.
The pie chart in Figure 5.3 speaks for itself. If you were to pour a quart of gasoline on the floor and strike a match, the fumes would account for only about three-quarters of the carbon story. The other quarter is caused by the supply chain of the fuel: getting it out of the ground, flaring off the gas, shipping it around the world, refining it, and getting it to the pump.
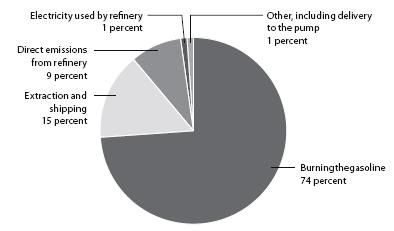
FIGURE 5.3: The footprint of gasoline is more than just the CO2 that comes off the fuel.
This extra quarter doesn’t usually feature in car emissions statistics (including official greenhouse gas “conversion factors”), which generally deal only with the stuff that comes out of the exhaust pipe. This is one part of the reason why the carbon footprint of driving is often so badly underestimated.
The story for diesel is slightly different. Each quart has a slightly higher footprint (13 percent), but it has a proportionately higher energy content to compensate. Diesel engines are typically about 30 percent more efficient at turning fuel energy into vehicle movement. But if only it were that simple. The downside is that, although they have got much cleaner in recent years, diesels also belch out many more particulates, and this also contributes to climate change (see Black carbon) as well as causing asthma. Overall, it is hard to say which wins as the environmental vehicle fuel.
Biodiesel deserves a mention as a controversial option, full of problems but also with some potential for the future. The first thing to say is that using land to grow fuel rather than food puts pressure on the world’s forests, and chopping trees down already accounts for 18 percent of global emissions (see Deforestation). With a fast-growing world population, land is likely to feel increasingly scarce in future. The second negative point to make is that considerable emissions are involved in the growing of the fuel crop and the process of turning it into fuel. Some people even think this can even add up to more than the emissions from fossil fuels. On the plus side for biofuels is the potential to create them from unavoidable agricultural waste and the prospect that future technologies may be able to create them efficiently from algae. Overall, biofuels might one day be a useful part of the solution, but they are not likely to be a magic wand.
2.5 kg (5.5 lbs.) CO2e efficiently produced
4 kg (8.8 lbs.) CO2e average
6.1 kg (13.4 lbs.) CO2e inefficient production with excessive use of nitrogen fertilizer
> A typical kilo (2.2. lbs.) of rice causes more emissions than burning a quart of diesel.
Rice deserves a place in your consciousness not only as a food on your table but as an important piece of the global jigsaw. It provides 20 percent of the world’s food energy in exchange for 3.5 percent12 of its carbon footprint (Figure 5.4). Its global footprint is just a fraction less than that of cement production (see 1 kg (2.2 lbs.) of cement). Europeans and Americans get just 1 or 2 percent of their food energy from this crop, but the figure is very much higher in Asia, where 89 percent of the world’s total rice harvest is consumed.13
I suspect that plenty of greens will be slightly unsettled to hear that rice, the simplest of foods, is a surprisingly high-carbon staple, much more so than wheat, which is nutritionally similar. That’s because of the methane that bubbles out of the flooded paddy fields and the excessive helpings of fertilizer that are all too often applied.
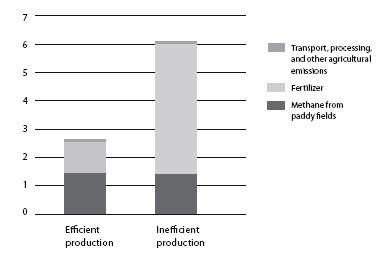
FIGURE 5.4: The carbon footprint of 1 kg (2.2 lbs.) of rice (in kg CO2e).
Around the world, 600 million tons CO2e of methane is thought to be emitted from rice paddies, accounting for around 1.2 percent of the total global footprint and about three times the footprint of all the cement produced in Europe. Even more significant are the 161 million tons of fertilizer, mainly nitrogen based, that are applied to the crop.14 That’s a little over 1 ton of fertilizer for every 3 tons of rice produced. If this is made in an efficient factory and applied sparingly, at well-chosen moments, each ton applied may only result in 2.7 tons CO2e. If not, the figure could be as high as 12.3 tons CO2e.
I have guesstimated just 100 g CO2e per kilo (5o g per pound) of rice for the production of agricultural machinery and the transport of the rice to market. The majority is eaten in its country of origin, and I can’t imagine rice ever finding its way into a hothouse or an airplane.
If we were to feed the world entirely on food that was as carbon intensive as rice per calorie, what would happen? With smart use of fertilizer, global emissions from agriculture would come in at 11 percent of the current total, compared with the current 18 to 20 percent. But if the worst practice were the norm, agricultural emissions would increase.15
It’s possible to grow rice without flooding the field and thereby cut out the methane. However, it’s harder work (because you have to do more weeding) and you might need more fertilizer, which would mean a trade-off that could end up taking the net carbon impact either way. As with lots of agriculture, we don’t fully understand what goes on or what the best options are. It is another important area for research, as the number of human mouths soars ever higher, along with the global temperature.
See also Fertilizer.
Desalinating a cubic meter (260 gallons) of water
Zero CO2e solar powered (technology permitting)
5 kg (11 lbs.) CO2e average, a reverse osmosis plant in Sydney using electricity from coal
23 kg (51 lbs.) CO2e inefficient thermal desalination plant
> Globally, desalination accounts for perhaps 0.6 percent of our footprint—and this is rising fast.
Each day the world desalinates around 60 billion liters (16 billion gallons) of water—that’s 60 million tons—and that figure is currently doubling about every decade.16 Something like half of the total takes place in and around the dry, oil-rich Middle East, but desalination also accounts, for example, for 13 percent of California’s electricity usage and 31 percent of its gas consumption. Emissions per liter vary hugely depending on the efficiency of the process and the carbon intensity of the electricity used. If a new plant in Sydney is typical of the global efficiency (it uses relatively efficient technology but powers it with electricity from coal), that leaves a global carbon footprint of about 300 million tons CO2e—or something like 0.6 percent of all global emissions. And that figure is likely to continue increasing rapidly, not least because the world is getting hotter and drier in many regions—a feedback loop of climate change. Spain, which looks set to be one of the countries within Europe most directly affected by changing climate so far,17 doubled its desalination between 2000 and 2004.
At the high end of the spectrum are inefficient thermal desalination processes. A big improvement on this is reverse osmosis. Various options exist for using spare heat from fossil fuel–burning power stations (though we should be careful not to double-count the benefits: in these situations the desalination plant may claim carbon neutrality while the power station claims to be offsetting its emissions by supporting the desalination plant).
At the low-carbon end, Seawater Greenhouse18 claims to have developed a technique for using solar heat to desalinate water for greenhouse-cultivated crops in arid regions. In theory the desalination itself is just about carbon neutral. I haven’t personally investigated the technique, but the company has won awards and has some large pilot projects already in operation. I include it here because it is the kind of technology that gives hope in the midst of increasing desertification problems around the world.
Apart from greenhouse gases, another nasty by-product of desalination is the brine concentrate that is returned to the sea, increasing the salinity and messing up marine ecosystems.
3 kg (6.6 lbs.) CO2e my favorite old nylon traveling pants
6 kg (13 lbs.) CO2e my cotton jeans
> “Natural” materials may sound greener, but the footprint tells a different story.
My cotton jeans weigh 600 g (1.3 lbs.). Cotton has a footprint of around 7 kg CO2e per kilo (3.2 kg CO2e per pound).19 On top of that there is dying, cutting, sewing, an allowance for waste fabric, buckles and zips, transport, and so on, which probably takes the total to about 6 kg (13 lbs.) per pair—equivalent to an 8-mile drive in an average car.
But this figure doesn’t tell the whole story. Over the 4 years I suspect I’ll get out of them, the footprint of washing and drying them is likely to be several times the footprint of producing them in the first place. My best estimate is four times more (Figure 5.5).200 It all depends how quickly I get them dirty (quite quickly) and how tolerant I am of the dirt (probably more than most) and how they are washed and dried. But there’s no avoiding the fact that the jeans are heavy when wet and they take a lot of drying.
At the other end of the scale is a pair of pants I’ve had for 12 years. They have traveled extensively, and I’ve worn them endlessly around my home, too. They weigh just 250 g, and they dry fantastically fast. I can’t seem to wear them out. They cost $75, which felt like a lot at the time but now seems a bargain. They are made of some fancy fine-woven nylon. Nylon has a footprint of between 7 and 9 kg CO2e per kilo (3.2 and 4.1 kg CO2e per pound) depending on the specification21—so 12 kg CO2e per kilo (5.5 kg CO2e per pound) of finished pants, or 3 kg (6.6 lbs.) per pair, is probably about right.
Even if I wear my cotton jeans right into the ground, I can’t envisage getting more than 200 days of solid use out of them. That works out to a minimum of 30 g CO2e per day—or more than 100 g per day once I factor in the laundry. By comparison, my nylon pants are probably good for 600 days of wear, so that’s just 5 g per wear-day, and because they virtually drip dry, the laundry aspect probably adds only an extra 6 to 12 g. All told, then, the nylon pants are less than one-tenth as carbon intensive as the jeans.
What about the rest of my clothes? If a pair of pants makes up one-quarter of my daily clothing, and if everything I wore were equivalent to my jeans, my clothing footprint would be 45 kg (99 lbs.) CO2e per year for the garments themselves plus around the same again for washing and more than double again if I use a dryer. But if everything I wore were equivalent to my nylon pants, I could cut my clothing footprint to just 7 kg (15 lbs.) per year, or 16 kg (35 lbs.) including laundry.
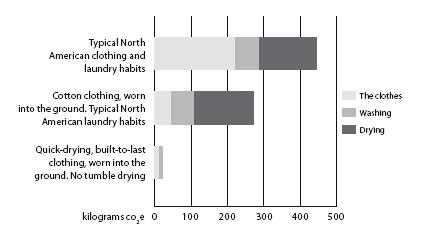
FIGURE 5.5: The annual carbon footprint of buying and washing clothes.
In reality, the average U.K. person has a clothing footprint closer to 225 kg (496 lbs.) per year, or more than 400 kg (882 lbs.) including laundry, which suggests, not surprisingly, that we are nothing like as good at wearing things into the ground as my scenarios suppose.
All told, if you live in the U.K., clothing and textiles will typically make up about 2 percent of your footprint. And there are broader environmental issues to consider, too. For example, the Aral Sea is drying up partly because of cotton plantations in its catchment22 and the clothing and textiles industry produces toxins that find their way into water supplies.
Here are some tips for keeping the total impact of your clothing to a minimum:
> Buy stuff that is easy to wash and dry.
> Buy stuff that is built to last.
> Wear it and use it until it falls apart, or pass it on.
> Buy second-hand.
> Repair things rather than throwing them out.
> Donate or recycle clothing rather than putting it in the trash.
> Favor synthetic fibers over natural ones.
2 kg (4.4 lbs.) CO2e a raw 4-ounce beefsteak
> A steak has about the same impact as 25 bananas. If you have one per day, that would be more than 700 kg (1,540 lbs.) CO2e per year, equivalent to 1,000 average car miles.
Beef is a climate-unfriendly food, coming in at almost 18 kg (40 lbs.) CO2e per kilo (or 8 kg CO2e per pound).23 About nine-tenths of this footprint comes from the beef farming itself. As we’ve already seen, using animals to produce food tends to be inefficient compared with eating crops (see A house), and cows have the added problem that they ruminate, producing enough methane to roughly double the climate change impact of farming them.
Less widely discussed than the methane are the nitrous oxide emissions, which account for about three-tenths of the footprint of beef farming. This gas is released when nitrogen fertilizer is applied to grass and other fodder crops, and when the grass is silaged. Last, there is the CO2 itself, at around one-fifth of the farming footprint. This is caused by the tractors, other farming machinery, and energy required to make fertilizer.
I’m using the same footprint figure here for all beef, although you could argue the case for attributing more to the most expensive cuts than to the mechanically reclaimed stuff that finds its way into economy burgers. In that sense, offal and processed meat may well be a greener choice than more premium meat products. But however you look at it, food from cows remains toward the top of the carbon spectrum—despite the ongoing debate about whether the footprint of beef and milk can be reduced (see Milk).
3.6 kg (7.9 lbs.) CO2e
> So a single egg has about the same footprint as four bananas, even before you cook it.
If you tried living entirely off eggs (and survived the cholesterol overdose) you’d meet your calorific needs for around 30 percent of the total footprint of the 10-ton lifestyle. This makes eggs less carbon intensive than some animal products but more so than most vegetable-based foods. Figure 5.6 shows that, as with nearly all foods, most of the impact of egg production comes from the farming itself (in this case the rearing of birds and growing of their feed) rather than the packaging or transport.24 Chickens don’t ruminate, so methane isn’t much of a problem. But nitrous oxide is the main contributor to the footprint of the final product.
I’ve based my figures for the farming part of the footprint on a study by Cranfield University. This study suggests that—from the perspective of climate change—organic eggs come out about 25 percent worse than those from battery farms. This just goes to illustrate that if responding to climate change sends us into a blinkered drive for efficient production, some other values are going to have to suffer. This book isn’t about telling you what values to have, but from time to time it’s worth remembering that climate change is not the only issue. If you care about animal welfare as well as climate change, buying fewer eggs but making them organic might be a sensible compromise.
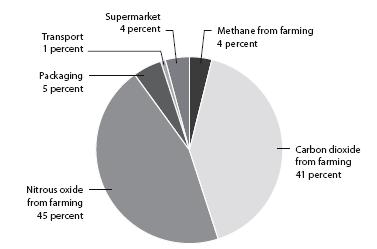
FIGURE 5.6: How the carbon footprint of eggs (not including cooking) cracks up.
0.4 kg CO2e organic loose tomatoes, traditional variety, grown locally in July
9.1 kg (20 lbs.) CO2e average
50 kg (110 lbs.) CO2e organic “on the vine” cherry tomatoes, grown in Ohio in March
> For the same impact as just 1 kg (2.2 lbs.) of the most energy-intensive tomatoes, a man weighing 224 pounds could eat his own body weight in oranges.
Shocking! Tomatoes, at their worst, are the highest-carbon food in this book. But at their best, tomatoes are perfectly fine.
At the low end of the scale a high-yield classic variety is grown in the summer with no artificial heat required.25 The middle and high figures are based on a detailed but controversial study by Cranfield University.26 The middle figure is averaged across all varieties and times of year. Classic loose tomatoes, the ones that our parents were brought up on, cause only just over half the carbon, at 5.6 kg CO2e per kilo (2.8 kg CO2e per pound), whereas “specialist” varieties (defined here as cherry, plum, cocktail, beefsteak, and others) come in at almost 30 kg CO2e per kilo (13.6 kg CO2e per pound) because the yield is so much lower per acre, so they need more heat per pound.
Perhaps Cranfield’s most unsettling finding was that when heat from fossil fuels is required, organic is the highest-carbon option, again because the yield was thought to be lower. At the high-carbon end, therefore, with a staggering 50 kg of greenhouse gas per kilogram (23 kg CO2e per pound), are out-of-season organic, cherry tomatoes sold “on the vine.”
So, tomato lovers concerned about climate change would do well to stick to the season (July to October in most of North America) and to favor classic varieties, sold loose. In the winter, it makes carbon sense to stick to canned tomatoes, but if you do want to buy fresh tomatoes outside the local growing season, it is almost certainly preferable to buy them from Mexico, California, or another warmer place rather than choose local versions produced in heated greenhouses.
5.9 kg (13 lbs.) CO2e canned
6.9 kg (15 lbs.) CO2e fresh from the store or frozen
I’ve chosen trout for my example even though I’m not sure I’ve ever seen it in a can. That’s because up to the point of slaughter it has clocked up a carbon footprint that’s fairly average for fish. At this level, fish comes out as a carbon improvement on beef and lamb—and it’s healthy, too. But before you rush out and switch your diet over to eating the stuff seven days a week, bear in mind that many of our fish stocks are getting dangerously depleted, and if we all switched over from ruminant meat we’d probably wipe out global fish stocks in a decade.
I hesitate to mention that in the studies I looked at, overfished cod comes out with a slightly lower carbon footprint than salmon.27 Once again, then, we each have to balance up carbon emissions with other concerns. The list in Table 5.2 will help shed some light on the carbon part of the puzzle. For the fish-stocks part, check out SeaChoice’s handy fish-purchasing guide at www.seachoice.org.
When canned fish are compared with fresh stuff over the counter, the refrigeration is a bigger deal than the can, so fresh fish come out slightly higher in carbon (Figure 5.7). But then the fresh version is 100 percent fish, with no added oil, and it usually tastes better, too. Fresh fish has a similar footprint to frozen up to the time when you buy it. But the footprint of the frozen version could carry on going up for months in your freezer if you forget it is there.
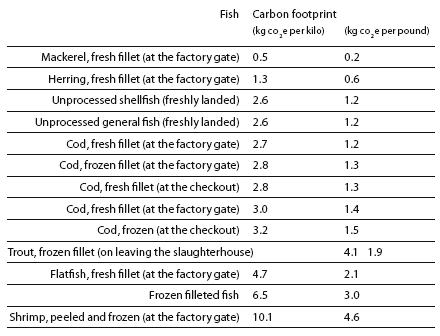
TABLE 5.2: The carbon footprint of different seafoods according to various studies.28
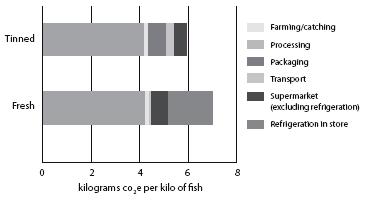
FIGURE 5.7: The carbon footprint of canned and fresh fish.
90 kg (198 lbs.) CO2e a low-energy bulb for 1 year
500 kg (1,100 lbs.) CO2e a 100-watt incandescent bulb for 1 year
By “incandescent bulb” I mean the old fashioned kind with the glowing tungsten wire. In the U.K. it is now illegal for stores to buy them, so they will soon be museum pieces—at last. Leaving a light on for a whole year might sound extreme, but having an average of one bulb turned on unnecessarily at any one time is almost certainly quite common. (In my office building, which is just 3 years old, and oddly rated environmentally “Excellent” by the Building Research Establishment, the light is permanently on in the shower. There is simply no off switch.)
As the figures above show, low-energy bulbs have the potential to save an enormous amount of electricity. However, efficiency alone won’t bring about a low-carbon world, because the less costly something becomes, the more we tend to use it—so the result can end up being more consumption. In the case of lighting, this translates to “I’ve left a few lights on, but it’s OK because they are low-energy ones.” There’s also the fact that the money we spend on bills will end up being spent elsewhere—a cheap flight, perhaps (see Rebound effect, discussed within The world’s data centers).
Like any form of electricity wastage, leaving the lights on is one of the cheapest ways of trashing the planet, though the precise impact depends on where you live. I’ve based the figures here on a typical U.K. energy mix, but if you live in Australia, the footprint is about 60 percent higher. Some people might argue that if you live in France, it’s OK to leave the lights on because it mostly comes from low-carbon nuclear power, but in my analysis that doesn’t stack up (see Unit of electricity).
Finally, there’s no truth in stories you may have heard that the act of turning a light on uses the same energy as leaving it on for half an hour.
0.42 kg (0.92 lbs.) CO2e recycled general steel
2.75 kg (6 lbs.) CO2e virgin general steel
6.15 kg (13.6 lbs.) CO2e virgin stainless steel
> So virgin general steel has about three times the carbon footprint of cement (or, for that matter, porridge made from half milk and half water) per pound.
These figures are for steel in its raw form at the foundry gate. In other words they do not take account of any additional emissions that might be required to transport it to wherever it will be used or turning it into something useful like a car or a part of a house. The value of recycling immediately becomes evident, because recycled steel has less than one-sixth of the footprint of its virgin equivalent.
Another key factor is the country of manufacture. This can make a big difference, for three reasons:
> Steel manufacture requires electricity, and the carbon intensity of this varies from country to country depending on how it is generated.
> The amount of energy used depends on the efficiency of the steel plant, with less developed countries often having less efficient manufacturing.
> A final small consideration is that if the steel is made a long way from its final market, there will be an additional shipping impact.
A report for the U.K. government30 estimated that the emissions associated with the manufacture of 1 ton of steel in China were typically three times those for steel made in the U.S., where production is carried only two-thirds of the footprint per ton of steel made in Denmark or the U.K. only half (Table 5.3). India came out worse than China, and Nigeria is worse still—at over 11 times more carbon-intensive than for U.S. production.
| Country | Carbon emissions % of U.S. production | |
| Australia | 125 | |
| Austria | 225 | |
| Brazil | 175 | |
| Canada | 200 | |
| China | 300 | |
| Colombia | 600 | |
| Czech Republic | 275 | |
| Denmark | 75 | |
| France | 150 | |
| Germany | 200 | |
| India | 500 | |
| Indonesia | 500 | |
| Iran | 100 | |
| Japan | 150 | |
| Korea (South) | 75 | |
| New Zealand | 450 | |
| Nigeria | 1125 | |
| Norway | 550 | |
| Pakistan | 326 | |
| Poland | 225 | |
| Russian Federation | 350 | |
| Slovakia | 250 | |
| South Africa | 475 | |
| Sweden | 150 | |
| Ukraine | 300 | |
| U.K. | 150 | |
| U.S. | 100 | |
| Venezuela | 425 | |
TABLE 5.3: Carbon emissions for steel produced around the world (per ton of steel, as a percentage of U.S. production).
* “Sustainable lifestyle”: this is a tricky expression. It doesn’t bear much scrutiny, and we could get hopelessly bogged down defining it. However, I strongly suspect that whatever your definition I would still stand by my assertion that it leaves plenty of scope for reading.