Figure 37: Android Studio Project Explorer, Showing Android Project View
Eclipse has been around for a very long time and has proven to be a very popular IDE. As a result, there is quite a bit of material written about it, from books and blogs to Stack Overflow questions and official project documentation.
Android Studio shares a lot of functionality with its parent, IntelliJ IDEA. However, IDEA itself has not achieved Eclipse’s level of popularity, even though it has long been the IDE of choice for many “power developers”. And Android Studio’s changes to IDEA are largely undocumented.
Hence, this chapter will serve as a quick tour of the Android Studio IDE, to help you get settled in. Other Android-specific capabilities of Android Studio will be explored in the chapters that follow.
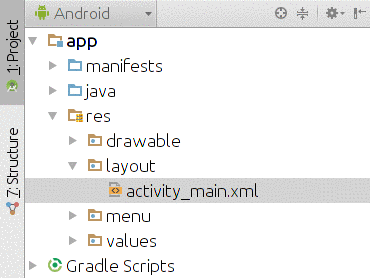
After the main editing area — where you will modify your Java source code, your resources, and so forth — the piece of Android Studio you will spend the most time with is the project explorer, usually available on the left side of the IDE window:
Figure 37: Android Studio Project Explorer, Showing Android Project View
This explorer pane has two main “project views” that an Android developer will use: the Android project view and the classic project view.
By default, when you create or import a project, you will wind up in the Android project view.
In theory, the Android project view is designed to simplify working with Android project files. In practice, it may do so, but only for some advanced developers. On the whole, it makes the IDE significantly more complicated for newcomers to Android, as it is rather difficult to see where things are and what relates to what.
We will return to the Android project view a bit later in the book and explain its benefits relative to resources and Gradle’s sourcesets.
However, for most of the book — most importantly, for the tutorials – we will use the classic project view.
To switch to the classic project view, click the pair of arrowheads to the right of the “Project Files” tab just above the tree in the explorer, and choose Project:
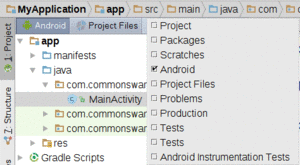
Figure 38: Android Studio Project Explorer, Showing Project View Drop-Down
This will change the contents of the tree to show you all of the files, in their associated directories:
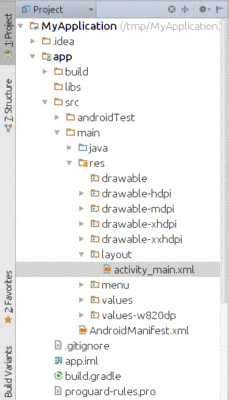
Figure 39: Android Studio Project Explorer, Showing Classic Project View
This project view is much like its equivalent in other IDEs, allowing you to find all of the pieces of your Android project. We will be exploring what those pieces are, and how their files are organized in our projects, in the next chapter.
Right-clicking over a directory or file in the explorer will give you a context menu with a variety of options. Some of these will be typical of any sort of file manager, such as “cut”, “copy”, and/or “paste” options. Some of these will be organized according to how IntelliJ IDEA manages application development, such as the “Refactor” sub-menu, where you can rename or move files around. Yet others will be specific to Android Studio, such as the ability to invoke wizards to create certain types of Android components or other Java classes.
Double-clicking on a file usually opens that file in a tab that allows you edit that file, using some sort of editor.
Some file types, like images, can be opened but not edited, as Android Studio does not have editors for all file types.
Of course, as you change your app, you will want to try it out and see if it works, whether on a device or an emulator.
As noted in Tutorial #2, to run your project, just press the Run toolbar button:

Figure 40: Android Studio Run Controls, Showing Green Arrow to Run the App
You will then be presented with a dialog indicating where you want the app to run:
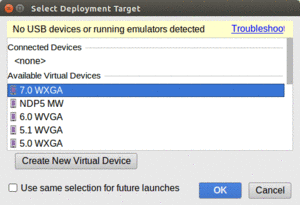
Figure 41: Android Studio Device Chooser Dialog
The “Connected Devices” category lists any devices or running emulators that the build tools can find. Some may be disabled due to compatibility issues, such as having an emulator for an old version of Android where your app requires a newer version of Android.
The “Available Emulators” category lists all AVDs that you have defined in the AVD Manager that are not already running. Again, you may find that some are disabled for compatibility reasons.
The “Create New Emulator” button brings up the wizard to create a new AVD, just like the one you can launch from the AVD Manager.
Once you have run the project on the emulator, if you make changes, by default you will be in “Instant Run” mode. Rather than rebuild the whole app, Android will attempt to patch the existing app on the device or emulator to reflect your changes.
The run controls in the Android Studio toolbar will change at this point:

Figure 42: Android Studio Run Controls, Showing Instant Run State
Specifically:
Instant Run uses a variety of tricks to pull off its feats of magic. As a result, it may have bugs, causing the patched app to run different than would a completely fresh build. You can disable Instant Run entirely via Settings, by searching for “Instant Run” in the search field:
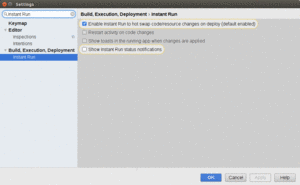
Figure 43: Android Studio Settings, Showing Instant Run Items
Beyond your app itself, Android Studio will generate other sorts of diagnostic output, in the form of “console”-style transcripts of things that have occurred. The two of these that probably will matter most for you are the Gradle console and LogCat.
By default, docked in the lower-right corner of your Android Studio window is a “Gradle Console” item. Tapping on that will open up a pane showing the output of attempts to build your application:
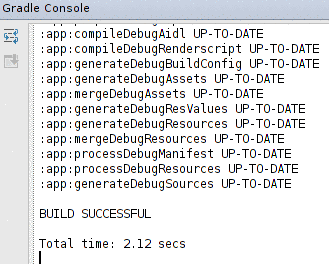
Figure 44: Android Studio Gradle Console
This may automatically appear from time to time, if specific build problems are detected, and you can always go examine it whenever you need.
Click on the “Gradle Console” item again to collapse the view and get it out of your way.
Messages that appear at runtime — including the all-important Java stack traces triggered by bugs in your code — are visible in LogCat. The “Android Monitor” item docked towards the lower-left corner of your Android Studio window will display LogCat when tapped:
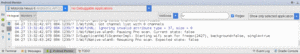
Figure 45: Android Studio LogCat View
LogCat is explained in greater detail a bit later in this book.
Not everything related to Android is directly part of Android Studio itself. In some cases, tools need to be shared between users of Android Studio, users of Eclipse, and users of “none of the above”. In some cases, while the long term direction may be to incorporate the tools’ functionality directly into Android Studio, that work simply has not been completed to date.
Here are some noteworthy Android-related tools that you can access via the Tools > Android main menu option.
As we saw in Tutorial #1, the SDK Manager is Android’s tool for downloading pieces of the Android SDK, including:
You can launch the SDK Manager via Tools > Android > SDK Manager from the Android Studio main menu, or by clicking on the “droid in a box” toolbar button:

Figure 46: Android Studio SDK Manager Toolbar Icon
The AVD Manager is the tool for creating emulators that emulate certain Android environments, based upon API level, screen size, and other characteristics.
You can launch the AVD Manager via Tools > Android > AVD Manager from the Android Studio main menu, or by clicking the “droid and a screen” toolbar button:

Figure 47: Android Studio AVD Manager Toolbar Icon
Elsewhere in this book, you will see references to tools associated with the Dalvik Debug Monitor Server (DDMS), such as using it to help inspect your running apps for memory or threading issues. You will also see references to tools like Hierarchy View, for trying to make sense of your UI as it appears at runtime, after you have programmatically made lots of changes to it.
In Eclipse, DDMS and Hierarchy View are “perspectives”, added to Eclipse via the ADT plugin.
For everyone not using Eclipse — including Android Studio users — DDMS and Hierarchy View are available via the Android Device Monitor standalone tool. Android Studio users can launch the Monitor via Tools > Android > Android Device Monitor from the main menu.
This will first bring up a splash screen:
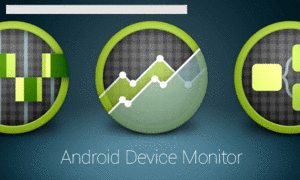
Figure 48: Android Device Monitor Splash Screen
followed by the Monitor itself:
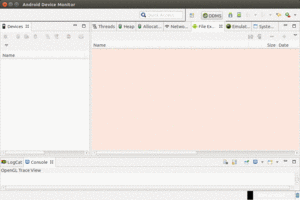
Figure 49: Android Device Monitor, As Initially Opened
If you read about things available from DDMS or Hierarchy View online, such as in blog posts or Stack Overflow answers, most of those capabilities should be available to you via the Android Device Monitor.
When you install Android Studio for the first time, your installation will be set up to get updates on the “stable” release channel. Here, a “release channel” is a specific set of possible upgrades. The “stable” release channel means that you are getting full production-ready updates. Android Studio will check for updates when launched, and you can manually check for updates via the main menu (e.g., Help > Check for Update… on Windows and Linux).
If an update is available, you will be presented with a dialog box showing you details of the update:
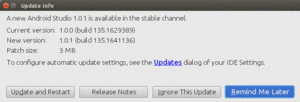
Figure 50: Android Studio Update Dialog
Choosing “Release Notes” will bring up a Web page with release notes for the new release. Clicking “Update and Restart” does pretty much what the button name suggests: it downloads the update and restarts the IDE, applying the update along the way.
Clicking the “Updates” hyperlink in the dialog brings up yet another dialog, allowing you to choose which release channel you want to subscribe to:
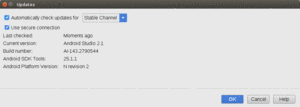
Figure 51: Android Studio Update Release Channel Dialog
You have four channels to choose from:
Android Studio’s Project Structure dialog and Translations Editor are covered later in this book.