The campaign of 1960—the longest, costliest, most hectic campaign Americans had endured up to that point—dramatically changed presidential politics forever.
Dwight Eisenhower, the nation’s first septuagenarian commander in chief, eagerly counted the days to his retirement in January 1961, anticipating a long rest on his Pennsylvania farm. The aspirants for his job, meanwhile, crisscrossed the country in a frenzy of activity as Election Day approached. “It is time for a new generation of leadership, to cope with new problems and new opportunities,” insisted John Kennedy, the 43-year-old Democratic nominee.1 He delivered speeches in 46 states that year. His Republican opponent, 47-year-old Richard Nixon, was even more aggressive, personally campaigning in all 50 states. “You had two relatively young men with enormous drive,” said Robert Finch, Nixon’s campaign director, “and it was quite a show.”2
It was a year of firsts—the first contender to parlay a series of primary victories into a nomination (Kennedy), the first use of jets to whisk candidates from one state to another, the first extensive deployment of television commercials ($14 million spent on TV by Nixon and Kennedy), and the first televised debates between presidential nominees.3 American politics undeniably entered the Modern Era in 1960.
Future candidates from both major parties would do their best to imitate Kennedy, who eked out a victory over Nixon. The new president had defied the Democratic bosses, trusting his fate to the primaries. They, too, would go the primary route. Kennedy had built a powerful organization that was loyal only to him, not his party. They would do the same. Larry O’Brien, who had been one of Kennedy’s key aides, ran into Barry Goldwater during the 1964 campaign. Goldwater’s political philosophy couldn’t have been further from Kennedy’s, but he appreciated effective tactics. “We had a chat that I remember quite well,” O’Brien said, “because Barry wanted to let me know he had followed the Kennedy campaign procedure throughout.”4
The presidential race of 1960 changed the way that candidates—and presidents themselves—were covered by the media. The Kennedy-Nixon debates had revealed the raw power of visual images, elevating television to a dominant role it would not relinquish. Presidential press conferences had never been televised live, but Kennedy broke with tradition in 1961. “This is the right thing,” he told his press secretary, Pierre Salinger. “We should be able to go around the newspapers if that becomes necessary.”5 Print reporters complained about being demoted to minor roles in a sideshow. Kennedy paid them no heed.
These two trends—the decline of party bosses and the rise of television— permanently altered the political landscape. Nominees would henceforth be chosen in primary elections, not at party conventions. Sixteen Democratic primaries were staged in 1960, a total that ballooned to 34 by 1980 and 40 by 1992. The bosses had always preferred to nominate candidates with middle-of-the-road philosophies and extensive political experience. The primary system produced Goldwater (an extreme conservative) for the Republicans in 1964, George McGovern (an extreme liberal) for the Democrats in 1972, and Jimmy Carter (a one-term governor of Georgia) as the 1976 Democratic nominee. Times most definitely had changed.
Kennedy’s Catholicism had inspired many of the bosses to oppose him in 1960—even fellow Catholic David Lawrence, then the governor of Pennsylvania. “I was fearful that we would lose Pennsylvania,” he later admitted, “and that any chance I would have as governor of getting a majority in both houses of the [state legislature] would go skimmering if Kennedy was the head of the ticket.”6
One can only imagine how Lawrence and his contemporaries would have reacted in 2008, faced with a battle for the Democratic nomination between a woman (Hillary Clinton) and a black man (Barack Obama), two demographic groups that historically had been excluded from the presidency. But the opinions of party leaders no longer mattered very much. What counted were the voters, and their excitement was palpable. Nearly 37 million Democrats voted in the 2008 primaries, an all-time record.
What follows is a year-by-year listing of the Modern Era’s major-party nominees. (Take a brief trip back to Chapter 2 if you’re seeking a guide to this chart or any of the others in this chapter.)
The two major parties have split the Modern Era’s 14 presidential elections—winning seven apiece—though Republican nominees have piled up a decisive edge in electoral votes, 4,035 to 3,430. Five presidents won second terms during the 1960–2012 span, including the last three to hold the office. Bill Clinton, George W. Bush, and Obama constitute the first reelected triumvirate since Thomas Jefferson, James Madison, and James Monroe.
Perhaps the most striking characteristic of the Modern Era has been the relative success of candidates from small states, defined as any state allocated fewer than 2 percent of all Electoral College votes in a given year. Just 17 of the 113 major-party nominees have hailed from small states, yet nearly half (eight) of these exceptions have surfaced since 1960:
| Era | 6.0% or more | 2.0% to 5.9% | 1.9% or less |
| Elite Era (1789-1836) | 15 | 9 | 0 |
| Volatile Era (1840-1908) | 14 | 16 | 7 |
| Progressive Era (1912-1956) | 11 | 11 | 2 |
| Modern Era (1960-2012) | 5 | 15 | 8 |
The obvious explanation, once again, is the decline of the big-city bosses. Primary voters are much more likely to nominate a McGovern from South Dakota (0.74% of the nation’s electoral votes in 1972) or a Goldwater from Arizona (0.93% in 1964). This trend reached its pinnacle in 1996, when the two major-party candidates, Bill Clinton and Bob Dole, came from states with six electoral votes (1.12%) apiece. It marked the only time in history that the home states of both nominees cast fewer than 2 percent of the votes in the Electoral College.
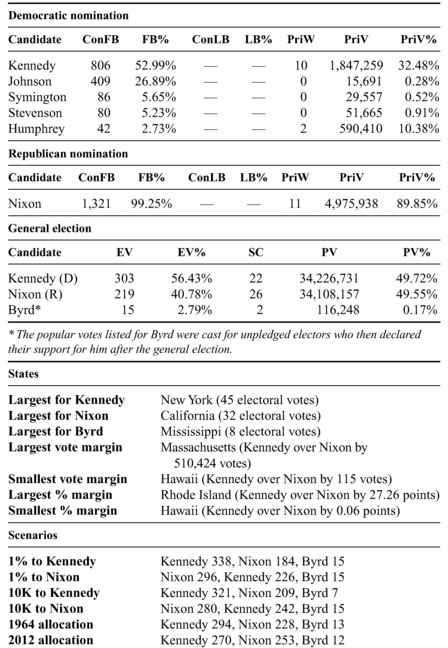
ELECTION NO. 44: 1960
What impresses us today, looking back half a century, is how youthful the candidates were in 1960. This was the only presidential election in which both nominees were younger than 50: Richard Nixon was 47, John Kennedy 43.
But the press corps was far from impressed at the time. CBS commentator Eric Sevareid dismissed the two contenders as “packaged products” who lacked experience, passion, and heart. “I always sensed that they would end up running the big companies in town,” he grumped, “but I’m damned if I ever thought one of them would end up running the country.”7 Noted journalist Richard Rovere complained in Harper’s that Nixon and Kennedy were drudges who “tend more and more to borrow from one another’s platforms and to assume one another’s commitments.”8 Mort Sahl, billed as the hippest comedian in America, couldn’t help making a joke. “It’s all over but the doubting,” he laughed. “My considered opinion of Nixon versus Kennedy is that neither can win.”9
These were not the cynical outpourings of old men. Sevareid had turned 47 just a month and a half before Nixon did. Rovere was 45, and Sahl was 33. Our current mythology may equate the Kennedy years with Camelot, but few Americans were eagerly searching for a young King Arthur in 1960. The 70-year-old Republican incumbent, Dwight Eisenhower, remained extremely popular. If he hadn’t been term-limited by the Twenty-second Amendment, Ike would have defeated Kennedy easily.
Vice President Nixon portrayed himself as Eisenhower’s natural heir, a seasoned diplomat in his own right. Kennedy talked endlessly about passing the torch to a new generation, but Nixon stressed stability and continuity. He boasted that he had visited 54 countries and conferred with 47 foreign leaders, including 35 presidents, 9 prime ministers, 2 emperors, and the shah of Iran.10 His campaign slogan—atypical for somebody so young—was “It’s Experience That Counts.”
The voters, sadly for Nixon, weren’t particularly interested. Eisenhower didn’t help by snappishly denying that his vice president had participated in any major decisions—“if you give me a week, I might think of one”— but it’s a cold, hard fact that Americans rarely find experience to be a compelling attribute.11
The Modern Era has featured five presidential elections without an incumbent on the ballot. Four of these transitional races were won by the candidate with less experience. (I’m including 1960 in that count. It’s true that both nominees were first elected to Congress in 1946, but Nixon deserves a slight edge because he was older and held a higher position.)
Here’s a breakdown of these five races. Each candidate is followed by the number of years he had spent (up to that point) as a representative, senator, governor, and/or vice president:
| Election | Winner | Experience | Loser | Experience |
| 1960 | John Kennedy | 14 years | Richard Nixon | 14 years |
| 1968 | Richard Nixon | 14 years | Hubert Humphrey | 20 years |
| 1988 | George H. W. Bush | 12 years | Michael Dukakis | 10 years |
| 2000 | George W. Bush | 6 years | Al Gore | 24 years |
| 2008 | Barack Obama | 4 years | John McCain | 26 years |
The victors possessed a total of 50 years of experience in high elective office, compared to 94 years for the losers. George H. W. Bush was the only winner to boast a lengthier resumé than his opponent, and it was a near thing in his case. Bush had served four years in the House and eight as vice president, while Michael Dukakis had been governor of Massachusetts for a decade.
Elections that lack incumbents are oftene xtremely tight—1960, 1968, and 2000 all rank among the five closest races in popular-vote percentage— yet they’re usually won by the party that’s out of power. Five presidents since 1900 have served two full terms in the White House: Woodrow Wilson, Eisenhower, Ronald Reagan, Bill Clinton, and George W. Bush. (I’m not counting Franklin Roosevelt, who went on to win four terms, or Barack Obama, who is still playing out the string.) Four of the five—all but Reagan— were succeeded by a member of the other party.
The electorate’ s desire for a fresh start, it seems, is a bit more powerful than its respect for experience.
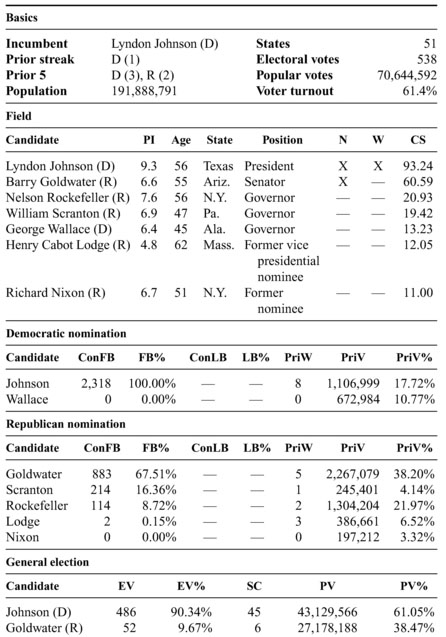
ELECTION NO. 45: 1964
The two longest single-party streaks in American history came screeching to a halt in 1964.
Vermont cast its electoral votes for every Republican nominee from the party’s debut in 1856 through 1960—27 elections in all. Georgia was equally rabid about the Democrats, though its streak was a tad shorter. A disagreement over political philosophy (i.e., the Civil War) forced Georgia to the sidelines in 1864, but it supported Democratic candidates in 24 straight elections from 1868 to 1960.
Each state was as close to a lock as you can get, consistently giving two-thirds of its popular votes to its favorite party:
| State | D PV | R PV | D PV% | R PV% |
| Vermont (1856-1960) | 745,498 | 1,594,242 | 31.13% | 66.57% |
| Georgia (1868-1960) | 4,284,106 | 1,646,338 | 69.20% | 26.59% |
Then came 1964. The Republican Party nominated Barry Goldwater, whose commitment to conservative principles (“extremism in the defense of liberty is no vice”) was too intense for Vermont’s mild-mannered Republicans.12 The Democratic Party countered with President Lyndon Johnson, whose newfound passion for civil rights was repugnant to Georgia’s white Democrats.
The results would have been unimaginable a few years earlier. Two-thirds of Vermont’s voters pulled the Democratic lever, while a comfortable majority of Georgians went with the Republicans:
| State | D PV | R PV | D PV% | R PV% |
| Vermont (1964) | 108,127 | 54,942 | 66.30% | 33.69% |
| Georgia (1964) | 522,556 | 616,584 | 45.87% | 54.12% |
Most analysts dismissed the election of 1964 as an aberration. They reasoned that the Republicans (chastened by Goldwater’s landslide defeat) would veer back toward the middle of the road, while the Democrats (worried about alienating their Southern base) would slow the pace of social reform. But Johnson knew better. New forces had been unleashed, forces that could not be restrained. “We have lost the South for a generation,” he told an aide after signing the Civil Rights Act in July 1964.13
That was certainly true of Georgia, once the most reliable state in the Democratic column. It supported just three Democrats in the next 12 presidential elections: native son Jimmy Carter in 1976 and 1980 and fellow Southerner Bill Clinton in 1992. The latter year also confirmed Vermont’s estrangement from the Republican Party. It voted for Clinton in the Electoral College and stayed with the Democrats in the five elections that followed. Here are the post-1964 results for both states:
| State | D PV | R PV | D PV% | R PV% |
| Vermont (1968-2012) | 1,535,916 | 1,260,301 | 51.09% | 41.92% |
| Georgia (1968-2012) | 12,078,675 | 14,087,087 | 44.05% | 51.38% |
Both states extended their new streaks from the 1990s through 2012— six straight Democratic victories in Vermont, five consecutive Republican wins in Georgia—and no deviation is anticipated in 2016. Vermont is now considered a virtual lock to support any presidential candidate the Democrats might put up. Georgia, predictably enough, is 100 percent for the Republicans. They’ve both come a long way since 1964.
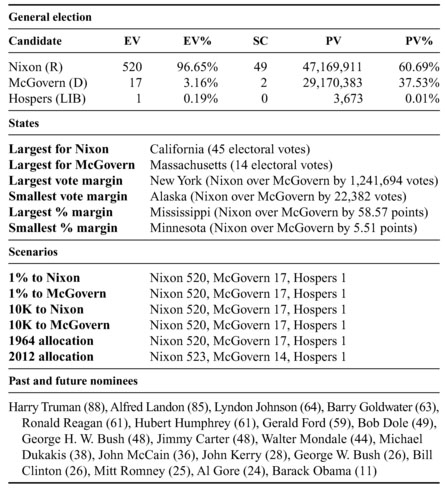
ELECTION NO. 46: 1968
George Wallace had no hope of winning the presidency in 1968, and he knew it. Yet that didn’t stop him from campaigning.
Wallace had made a name for himself as a proponent of lost causes. He was best known for his defiant inaugural address as governor of Alabama— “segregation now, segregation tomorrow, segregation forever”—and his futile attempt to block the admission of black students to the state’s flagship university.14 He was ostensibly a Democrat, yet he was seriously out of step with the party’s liberal leadership. The Republicans coveted his conservative base, though his overt racism was anathema to the party’s rank and file.
No matter. There wasn’t “a dime’s worth of difference” between the Democrats and Republicans, Wallace said, so he created the American Independent Party.15 The AIP qualified for the ballots of 50 states in 1968. The only place it failed was the District of Columbia, whose black majority wouldn’t have supported the new party under any circumstances.
Wallace’s goal wasn’t to win, but to drain enough electoral votes to prevent Richard Nixon and Hubert Humphrey from securing a majority in the Electoral College, thereby throwing the election into the House of Representatives for the third time. Chaos had ensued in 1800 and 1824. Who knew what might happen in 1968? Wallace dreamed of striking a deal— most likely with the Republicans—that would enhance his personal power and protect Southern whites.
It seems at first glance that he fell far short of his goal. Wallace carried only five states, all in the Deep South. Nixon defeated Humphrey by a comfortable margin of 110 votes in the Electoral College. There was no reason for the House to get involved.
But Wallace actually fared quite well. His total of 9.9 million popular votes was the most that any minor-party candidate had drawn up to that time (and remains second-best to Ross Perot today). His 46 electoral votes are still the most for any third-party contender since Theodore Roosevelt in 1912. And his objective wasn’t as far from his grasp as you might think.
Wallace finished second to Nixon in three Southern states. A flip of 108,721 popular votes in those states would have sliced Nixon’s total in the Electoral College to 270, the bare minimum for victory. Just imagine the pandemonium as the Democrats and Wallaceites tried to pry loose one more electoral vote anywhere in the country:
| State | Nixon EV | Flip from Nixon to Wallace |
| North Carolina* | 12 | 65,503 |
| Tennessee | 11 | 23,901 |
| South Carolina | 8 | 19,317 |
* North Carolina had 13 electoral votes. One Nixon elector actually voted for Wallace in the Electoral College. This example would flip the other 12 votes.
If Humphrey’s performance had been just a bit stronger, he could have helped to alter the outcome. The Democrat lost eight states to Nixon by fewer than five percentage points. All would have been prime targets for flipping:
| State | Nixon EV | Flip from Nixon to Humphrey |
| California | 40 | 111,674 |
| Illinois | 26 | 67,481 |
| Ohio | 26 | 45,215 |
| New Jersey | 17 | 30,631 |
| Wisconsin | 12 | 30,597 |
| Missouri | 12 | 10,245 |
| Delaware | 3 | 3,761 |
| Alaska | 3 | 1,095 |
We can play with dozens of possible combinations. If 55,460 voters had switched from the Republicans to the Democrats in Ohio and Missouri, for instance, Nixon would have dropped from 301 to 263 electoral votes, seven short of a majority. A flip of 64,532 in Ohio and South Carolina would have pushed him down to 267. And so on.
If the election had been tossed into the House, where the Democrats controlled 26 of the 50 state delegations, Humphrey conceivably could have emerged as the next president. But don’t forget that five of those Democratic states had backed Wallace in the presidential election. The wheeling and dealing in the House would have been intense, making 1824’s “corrupt bargain” seem tame by comparison.
A second aspect of Wallace’s candidacy deserves a few words. The AIP’s presence on the ballot probably kept Nixon from a landslide victory. The nation was in a sour mood in 1968, eager to repudiate Lyndon Johnson and his vice president. Yet Humphrey lost to Nixon by just 510,314 popular votes, which remains the second-tightest margin since 1900. (Nixon, of course, had also been involved in the closest election of the century, 1960.)
The results would have been much different if it had been a two-man race. Veteran political analysts Richard Scammon and Ben Wattenberg concluded that 80 percent of the Wallace voters in the South would have gravitated to Nixon in a straight Republican-Democratic matchup, as would 60 percent of the Wallace supporters in the rest of the nation.16 If we apply those percentages, here’s what we get:
| Candidate | PV | PV% | SC | EV |
| Richard Nixon (R) | 38,822,395 | 53.03% | 39 | 382 |
| Hubert Humphrey (D) | 34,144,724 | 46.64% | 12 | 156 |
Many of the excesses of Watergate stemmed from Nixon’s paranoid reaction to the closeness of his two presidential elections. It’s interesting to speculate if a landslide in 1968 might have changed him. Would he have been a more confident and charitable man after such a victory, or would he have been driven to score an even bigger rout in 1972?
ELECTION NO. 47: 1972
Richard Nixon and Franklin Roosevelt are rarely mentioned in the same breath, but Nixon’s 1972 victory elevated him to FDR’s league. Consider these six points:
There are plenty of other parallels, but these are sufficient to make the case. It admittedly isn’t popular to equate the charming, smiling Roosevelt with the awkward, scowling Nixon. Americans may not care to admit it, but we have always preferred naturally talented performers to those who succeed through hard work. Politics came easily to FDR, but everything was difficult for Nixon. His experience at Duke University’s law school was typical. Nixon was intimidated by his classmates, especially the 32 who held Phi Beta Kappa keys. Yet he graduated third in his class, “not because I was smarter,” he later said, “but because I worked longer and harder than some of my more gifted colleagues.”17 His classmates nicknamed him “Iron Butt,” testimony to his durability.18
But what about Watergate? Didn’t the crimes committed by Nixon and his aides pave the way for his lopsided victory in 1972?
Their dirty tricks and subsequent cover-up were stupid and reprehensible, to be sure, but the impact seems to have been minimal. Burglars recruited by the Nixon campaign were arrested in the Watergate offices of Democratic chairman Larry O’Brien in June 1972. A Gallup Poll conducted the very same month showed Nixon with a massive lead of 16 percentage points over McGovern, thanks to the president’s recent and highly successful trips to China and the Soviet Union.19 O’Brien himself had no doubt that a landslide was inevitable. “In my judgment,” he later wrote, “no Democrat could have won in 1972.”20
ELECTION NO. 48: 1976

The year 1974 was drawing to a close, and so was Jimmy Carter’s term as governor of Georgia. What job should he tackle next? He and his aides had been batting that question around, and they had reached a startling conclusion. Carter decided to let his mother in on the secret. He sat her down and proudly revealed that he was going to run for president.
Lillian Car ter was baffled. “President of what?” she asked.21
Most of the nation reacted the same way. Carter was virtually unknown outside of Georgia. He had served just four years in the state legislature and four more as governor. His public profile was so vague and his resumé was so thin that it was impossible to imagine him winning the presidency. Carter himself was sometimes taken aback by his own audacity. “It was hard for us to talk about the prospect at first,” he said of those early planning sessions. “It was all very tentative and somewhat embarrassing.”22
But, of course, it paid off. Carter shocked the political world by blitzing through the Democratic primaries, then skirting past Gerald Ford in one of the century’s tightest general elections. Carter’s fresh face was precisely what a Watergate-weary country was seeking. What initially seemed to be his biggest weaknesses—his low name recognition and his lack of national experience—turned out to be his biggest strengths.
There is no single recipe for a successful presidential campaign, as Carter so deftly proved in 1976. Nor is there a foolproof way to determine in advance whether a candidate will be a winner or an also-ran. Jimmy Carter had never seemed to be a man of destiny. He won a legislative seat by the narrowest of margins in 1962, then mounted a long-shot campaign for the governorship in 1966. He finished third in the Democratic primary. If any political analyst had predicted that Carter would win the presidency 10 years later, he would have been considered insane.
Carter is remembered as the ultimate outsider—a man without any Washington experience—yet his story really isn’t that unusual. Most presidents didn’t seem particularly presidential a decade before they were elected. Take a look at the following chart, which includes every occupant of the White House in the past 100 years. Each is listed with the job he held 10 years before being elected (or elevated, in the cases of vice presidents who were suddenly promoted):
| President | Ten years before |
| Woodrow Wilson | College president |
| Warren Harding | Newspaper publisher and former lieutenant governor |
| Calvin Coolidge | State legislator |
| Herbert Hoover | U.S. food administrator |
| Franklin Roosevelt | Lawyer and former vice presidential nominee |
| Harry Truman | U.S. senator |
| Dwight Eisenhower | General |
| John Kennedy | Representative |
| Lyndon Johnson | U.S. senator |
| Richard Nixon | Vice president |
| Gerald Ford | Representative |
| Jimmy Carter | State legislator |
| Ronald Reagan | Governor |
| George H. W. Bush | Bank executive and former ambassador |
| Bill Clinton | Lawyer and former governor |
| George W. Bush | Baseball team owner |
| Barack Obama | State legislator |
How many of these 17 future presidents held politically powerful jobs 10 years before securing the most powerful position of all? Just five: Richard Nixon as vice president, Harry Truman and Lyndon Johnson as senators, and Ronald Reagan and Bill Clinton as current or former governors.
You might logically assume that these five hotshots had an easier time than the century’s other presidents, yet none proceeded smoothly to the White House. Johnson would lose two presidential races before ascending upon John Kennedy’s death. Reagan wouldn’t win until his third try, Nixon until his second. Clinton would have to reclaim the governorship of Arkansas before indulging his national aspirations. And Truman never would have reached the Oval Office if not for Franklin Roosevelt’s somewhat whimsical decision to switch running mates in 1944.
Among the other 12 men on the previous list are a college president, a food administrator, a baseball team owner, and three state legislators—not exactly prime training grounds for the presidency. The same could be said of the position of lieutenant governor, which was held by Ohio’s Warren Harding from 1904 to 1906. Harding stepped up to the Senate in 1914— six years before being elected president—yet he never thought of himself as White House material. “I should really be ashamed to presume myself fitted to reach out for a place of such responsibility,” he said.23
Few politicians are so humble. Most, like Jimmy Carter, are intensely driven. Carter picked himself up after his 1966 defeat, hit the campaign trail again in 1970, and won the governorship on his second try. He and his staffers began to move in higher circles, meeting other governors, senators, and even President Nixon. They were unimpressed by many of the people they encountered. “Carter’s smarter than most of these guys,” one of his aides, Hamilton Jordan, told his colleagues, “and we can all be smarter than most of these guys around them.”24
That’s precisely the attitude that can take a person from the state legislature to the White House in 10 short years.
ELECTION NO. 49: 1980

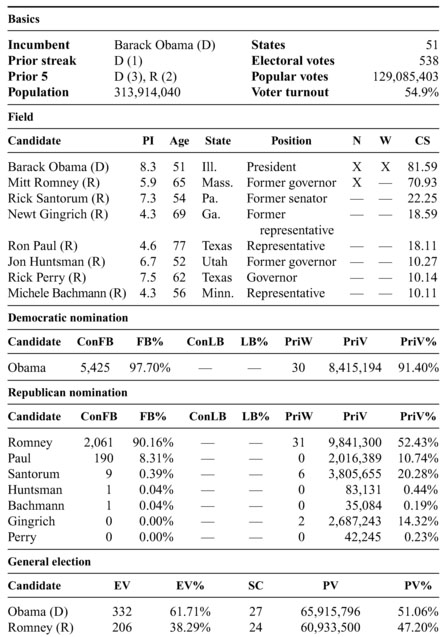
Ronald Reagan failed to win the presidency in 1968 and again in 1976, yet he decided to reach for the brass ring a third time in 1980. His chances did not seem to be good.
Americans have no real fondness for perpetual candidates. Take a look at the 44 elections between 1804 (the first race after the demise of the double-ballot system) and 1976 (the year of Reagan’s second defeat). Twenty-one men who failed in two of those elections stuck around to mount a third qualified candidacy. James Buchanan in 1856 and Richard Nixon in 1968 were the only three-timers to reach the White House. (And Nixon deserves an asterisk since he won in his second official campaign. The first was 1960. He didn’t enter the race in 1964, though he drew enough unsolicited primary votes to reach qualification levels. That technically made 1968 his third qualified candidacy.)
Then there was the question of age. Dwight Eisenhower, the oldest president to that point, had turned 70 just three months before leaving office. But Reagan, if elected, would celebrate his 70th birthday less than a month after being sworn in. “William Henry Harrison, old Tippecanoe, was the only president to be inaugurated at that age,” Marquis Childs snickered, “and he died of pneumonia six weeks later.” The columnist had the basic facts wrong—the 68-year-old Harrison lasted only 30 days—but he nicely captured the nation’s skepticism. Even Reagan’s loyal supporters were worried. “All of us would like to see him 10 years younger,” admitted Clarence Warner, who was coordinating his hero’s operations in Oklahoma.25
The only way to quiet the doubters was to wage a vigorous campaign, which is what Reagan did. He swept through the Republican primaries with greater ease than the experts had anticipated, becoming the first person over the age of 67 to win a major-party nomination.
The general election, though, looked to be a different matter. Reagan was 13 years older than Jimmy Carter, the Democratic incumbent. Age is a key factor in calculating a candidate’s potential index (PI), which helps to explain Carter’s massive PI lead over Reagan, 9.0 to 5.7.
The nominee with the bigger PI is likely to win two of every three elections, with the odds getting better as the gap grows wider. Here’s a breakdown of all 52 presidential races that featured a pair of major-party nominees (excluding the one-man elections of 1789, 1792, and 1820, as well as the three-nominee contests of 1836 and 1860):
| PI gap | Elections | Bigger PI wins | Smaller PI wins |
| 0.1 to 0.9 points | 16 | 10 | 6 |
| 1.0 to 1.9 points | 16 | 8 | 8 |
| 2.0 to 2.9 points | 8 | 6 | 2 |
| 3.0 to 3.9 points | 5 | 4 | 1 |
| 4.0 to 4.9 points | 5 | 5 | 0 |
| 5.0 or more points | 2 | 2 | 0 |
| Total | 52 | 35 | 17 |
A difference of less than two points, as you can see, means very little. Thirty-two races fit within that range. The candidates blessed with bigger PIs won 18 of those matchups and lost 14, fairly close to an even split.
If you go beyond two points, it’s a much different story. Victory came to 17 of the 20 nominees who held PI leads of 2.0 or more. The exceptions were Lewis Cass, who was edged out by Zachary Taylor in 1848; Alfred Smith, who was trounced by Herbert Hoover in 1928; and Carter, who was buried by Reagan in 1980.
The latter was the greatest accomplishment. Taylor and Hoover overcame respective PI deficits of 2.8 and 2.9 points. But Reagan won by a landslide in the Electoral College, even though he trailed the incumbent by 3.3 PI points. He benefited greatly from the nation’s angry, restless mood in 1980. Americans were troubled by high unemployment, soaring inflation, gasoline shortages, and a lingering crisis in Iran—and many of them blamed Carter. Reagan famously asked, “Are you better off than you were four years ago?” Millions of voters decided they weren’t.26
ELECTION NO. 50: 1984

One of the great absurdities of the Electoral College is its power to magnify the results of any presidential election. A winner’s EV% is always larger than his PV%—about 19 percentage points larger on average—and a loser always suffers a corresponding drop-off.
This incongruous rule of thumb occasionally transforms a neck-and-neck finish into a decisive outcome. James Garfield squeaked past Winfield Hancock in 1880 by 0.09 percentage points, the tightest PV% margin in history. Yet the Electoral College had no doubts: Garfield 214, Hancock 155. The election of 1960 was the second-closest in popular-vote percentage, with 0.17 points separating John Kennedy and Richard Nixon. But Kennedy easily won the electoral-vote tally, 303 to 219.
What if the popular-vote margin itself is lopsided? That’s when the Electoral College shows a truly impressive ability to skew the results. Just look at 1984.
Walter Mondale performed badly as the Democratic nominee against Ronald Reagan that year. He issued an unconventional (and self-destructive) pledge that he would ask taxpayers to dig deeper into their pockets during his administration. “Mr. Reagan will raise taxes, and so will I,” Mondale declared. “He won’t tell you. I just did.”27 Voters reacted with a predictable lack of enthusiasm. Mondale’s campaign score (58.83) was the seventhworst for any major-party nominee in history.
But it remains a fact that Mondale drew roughly 40 percent of the nearly 93 million votes cast in 1984. If you had collected a representative sample of 100 voters in a room that year, a sizable bloc of 40 or so would have been Mondale supporters.
Tell that to the Electoral College. Reagan ran up popular-vote majorities in 49 states, thereby securing all 525 of their electoral votes. Mondale was left with only his native Minnesota and the District of Columbia. If just 1,881 Minnesota voters had flipped from the Democratic ticket to the Republicans, Reagan would have won that state, too. The final count in the Electoral College would have been 535 to 3, the biggest landslide in history.
Mondale received only 13 electoral votes as it was. The difference between his PV% (40.56%) and his EV% (2.42%) was 38.14 percentage points, the widest disparity for a losing candidate in any presidential election. Three of the five biggest gaps, strangely enough, occurred in the brief span from 1972 to 1984:
| Candidate | EV% | PV% | EV-PV gap |
| 1. Walter Mondale (D-1984) | 2.42% | 40.56% | -38.14 |
| 2. George McClellan (D-1864) | 9.01% | 44.89% | -35.88 |
| 3. Alfred Landon (R-1936) | 1.51% | 36.54% | -35.03 |
| 4. George McGovern (D-1972) | 3.16% | 37.53% | -34.37 |
| 5. Jimmy Carter (D-1980) | 9.11% | 41.02% | -31.91 |
The Electoral College has many shortcomings, but its distortion of the popular will is one of the worst. It implies that the winner enjoys a greater mandate than he has actually been given, and it suggests that the loser has been repudiated more soundly than is truly the case.
Why didn’t the Founding Fathers envision this problem? That’s easy. They never intended to allow popular voting, as we discussed in Chapter 1. “The people are uninformed and would be misled by a few designing men,” warned Elbridge Gerry, a future vice president who took part in the Constitutional Convention.28 One of his colleagues, George Mason, confided that the Electoral College was “a mere deception” to fool the common man into believing he had a voice. “The people will, in reality,” Mason said, “have no hand in the election.”29
Many Americans believe that’s still the case. The Gallup Poll found in 2013 that 63 percent of adults wanted to do away with the Electoral College and its bizarre “winner take all” system of vote allocation.30 Surveys have detected similar levels of disgust ever since the 1960s, yet George Mason’s prized creation is still alive and well.
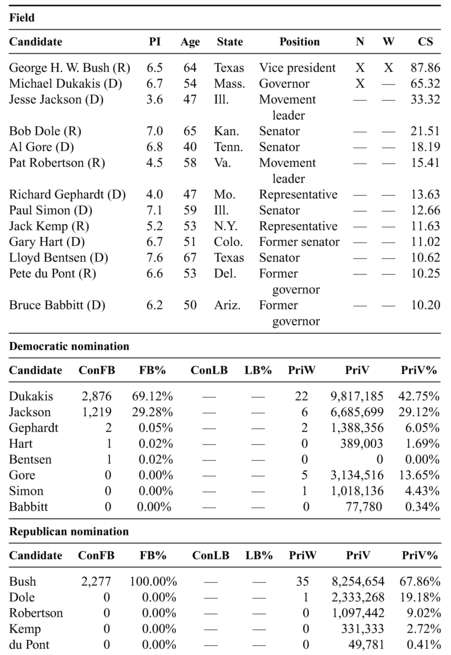
ELECTION NO. 51: 1988

Vice presidents rarely say anything positive about the job. Thomas Marshall (the veep from 1913 to 1921) spun a tale about two sons who left home to seek their fortunes. One was lost at sea, and the other became vice president. “Nothing,” he joked, “has been heard from either of them.”31 John Nance Garner (1933–1941) famously insisted that the nation’s second-highest job “is not worth a bucket of warm spit.”32 (That’s the phraseology in most history books. Garner actually said something other than “spit.”) “In the end, it is nothing,” Lyndon Johnson (1961–1963) snapped. “I detested every minute of it.”33
The vice president’s only real duty is to await an emergency. Nine have ascended to the White House upon the death or resignation of the commander in chief. “I am vice president,” said John Adams, the first man to hold the office. “In this I am nothing, but I may be everything.”34
That, of course, is the problem. The vice presidency offers little but inactivity and uncertainty. It’s occasionally a portal to greatness, but typically serves as a way station to oblivion. The roll call of vice presidents is a litany of obscurity: Daniel Tompkins, George Dallas, Hannibal Hamlin, Schuyler Colfax, Levi Morton, Garret Hobart, Charles Curtis, Spiro Agnew, Dan Quayle, and on and on.
But it didn’t start that way. The first two vice presidents, Adams and Thomas Jefferson, used the position as a springboard. They were elected directly to the presidency in 1796 and 1800, respectively. The number-two job briefly appeared to be the best possible staging ground for a presidential campaign.
Yet it was quickly eclipsed. The next three presidents emerged from the cabinet, not the vice presidency. Governors, senators, and generals were added to the presidential mix as popular voting gained a foothold. Vice presidents were rarely considered. Only two more would be elected directly to the top job: Martin Van Buren in 1836 and George H. W. Bush in 1988.
The following is a list of vice presidents who have run for the presidency. It does not include the 1792 candidacy of John Adams, who received electoral votes (under the double-ballot system) as George Washington’s running mate. Nor does it include former vice presidents who subsequently achieved other distinctions, such as Richard Nixon in 1968 and Hubert Humphrey in 1972. (Both were better known in those years as former presidential nominees.) What remains are the qualified candidates who placed the vice presidency at the very top of their political resumés:
| Candidate | Nominee | Winner | CS | |
| John Adams (F-1796) | X | X | 77.27 | |
| Thomas Jefferson (DR-1800) | X | X | 77.84 | |
| George Clinton (DR-1808) | — | — | 28.01 | |
| Martin Van Buren (D-1836) | X | X | 80.26 | |
| Richard Johnson (D-1844)* | — | — | 17.19 | |
| Charles Fairbanks (R-1908) | — | — | 13.27 | |
| Charles Fairbanks (R-1916)* | — | — | 16.32 | |
| John Nance Garner (D-1940) | — | — | 15.20 | |
| Henry Wallace (D/P-1948)* | — | — | 17.65 | |
| Alben Barkley (D-1952) | — | — | 12.74 | |
| Richard Nixon (R-1960) | X | — | 72.12 | |
| Hubert Humphrey (D-1968) | X | — | 69.19 | |
| Walter Mondale (D-1984)* | X | — | 58.83 | |
| George H. W. Bush (R-1988) | X | X | 87.86 | |
| Al Gore (D-2000) | X | — | 74.51 | |
* Former vice presidents. The others were sitting vice presidents when they ran for president.
Not exactly a distinguished record. The vice presidency has produced just nine presidential nominees and four winners in more than two centuries. Only two of those candidates posted campaign scores higher than 80 points, with Bush topping the list at 87.86.
The most striking thing about this chart is the lengthy drought from 1864 through 1956: no winners, no nominees, no CSs above 18 points. It wasn’t until Nixon launched his energetic (albeit losing) effort in 1960 that the position began to receive serious consideration again. Five of 10 post-Nixon vice presidents would run for the presidency, while two others would ascend in mid-term. Here’s their track record:
| Vice president (election) | Ran | Qualified | Nominee | Winner |
| Lyndon Johnson | [ascended upon the death of John Kennedy] | |||
| Hubert Humphrey (1968) | X | X | X | — |
| Spiro Agnew | — | — | — | — |
| Gerald Ford | [ascended upon the resignation of Richard Nixon] | |||
| Nelson Rockefeller | — | — | — | — |
| Walter Mondale (1984)* | X | X | X | — |
| George H. W. Bush (1988) | X | X | X | X |
| Dan Quayle (2000)* | X | — | — | — |
| Al Gore (2000) | X | X | X | — |
| Dick Cheney | — | — | — | — |
* Former vice presidents. The others were sitting vice presidents when they ran for president.
The only noncombatants were Agnew (who resigned in disgrace), Rockefeller (who twice ran unsuccessfully for the Republican nomination before being named vice president), and Cheney (who never seems to have considered aiming for the Oval Office). The incumbent, Joe Biden, isn’t on the list because his term has not yet expired, but he certainly isn’t immune to presidential fever. He mounted national campaigns in 1988 and 2008, falling short of qualification levels both times.
All of this makes George H. W. Bush’s victory even more impressive. How did he buck the odds and become the first sitting vice president to win the presidency in a century and a half? He learned a pair of important lessons from two of his unfortunate predecessors:
ELECTION NO. 52: 1992
The Democrats were blessed with a deep pool of prospective candidates for the presidency in 1992, led by three senators with PIs of 8.0 or better:
| Name | PI | Age | State | Position |
| Lloyd Bentsen | 8.2 | 71 | Texas | Senator |
| Bob Graham | 8.2 | 55 | Florida | Senator |
| Sam Nunn | 8.0 | 54 | Georgia | Senator |
| Donald Riegle | 7.4 | 54 | Michigan | Senator |
| Al Gore | 7.2 | 44 | Tennessee | Senator |
| Bill Bradley | 7.0 | 49 | New Jersey | Senator |
| John Kerry | 6.8 | 48 | Massachusetts | Senator |
| Mario Cuomo | 6.6 | 60 | New York | Governor |
| Edward Kennedy | 6.6 | 60 | Massachusetts | Senator |
| Jay Rockefeller | 6.6 | 55 | West Virginia | Senator |
These were prominent names. Bentsen had been the party’s vice presidential nominee four years earlier, best remembered for his verbal destruction of Republican counterpart Dan Quayle in their televised debate. Graham had served two terms as the popular governor of Florida before moving up to the Senate in 1986. Nunn chaired the powerful Senate Armed Services Committee. The others, especially Cuomo and Kennedy, were proven successes as campaigners. Cuomo, the erudite governor of New York, was an electrifying public speaker. Kennedy, marking his 30th year in the Senate, was the liberal conscience of the Democratic Party.
Yet not one of these men entered the race. They all had their reasons— Bentsen was feeling his age, Gore’s son had been seriously injured in an automobile accident, many of the others didn’t think they were ready—but they also shared the unspoken belief that President George H. W. Bush was invincible. Bush’s approval rating had skyrocketed to 89 percent after America’s triumph in the 1991 Gulf War. It was the highest score for any president in the Gallup Poll’s 55-year history.37 Why would anybody waste two years and millions of dollars to take on such a powerful foe?
Democratic strategists retained hope that Cuomo would run, but he waffled for months. Weary pundits dubbed him the “Hamlet on the Hudson.”38 He eventually decided to forgo the race because of pressing business in Albany. “The nomination should go to someone willing and able to campaign for it,” Cuomo said. “I am willing, but because New York’s budget has not been settled, I am not able to campaign for it.”39
Bill Clinton, the governor of Arkansas, had no such qualms. He happily allowed subordinates to run the state while his energies were devoted to his presidential campaign. Clinton was among a handful of second-tier candidates who scrambled to fill the Democratic void in 1992, including a former California governor who had lost two previous presidential races (Jerry Brown), a former one-term senator from Massachusetts (Paul Tsongas), and a pair of current senators with unimpressive national profiles (Bob Kerrey and Tom Harkin).
It was a weak field, but was it the weakest for any major-party nomination in the Modern Era? Let’s run a series of quick tests to winnow down the 28 contests since 1960 (14 for the Democrats, 14 for the Republicans):
Three factors come to mind: (1) It’s easier to win a nomination when you face a limited number of opponents, so we’ll give extra credit to those years that had the fewest qualified candidates. (2) It’s also nice when you aren’t confronted by a dominant rival, so we’ll award better scores to those years in which the highest PI was unimpressively low. (3) And it’s always beneficial when your opponents turn out to be poor campaigners, so we’ll give the most points to those years where the average return on potential (ROP) for all losing candidates was especially bad.
Here are the results, based on a sliding scale of four points for the smallest number in each category, down to one point for the biggest:
| Contest | Candidates | Highest PI | ROP for losers | Points |
| 1992-D | 5 | 7.0 | 25 | 12 |
| 1988-R | 5 | 7.0 | 26 | 10 |
| 1976-D | 10 | 7.4 | 25 | 6 |
| 1972-D | 8 | 7.2 | 29 | 5 |
We may be splitting hairs—the four contests are remarkably similar— but the 1992 Democratic race is our winner. We can therefore say that Bill Clinton emerged from the weakest field of competitors for any major-party nomination in more than half a century. What’s truly amazing is that he proceeded to do what his Democratic Party elders had believed to be impossible. Clinton capitalized on a serious decline in the nation’s economic fortunes, enabling him to defeat the supposedly unbeatable incumbent, George Bush, that November.
ELECTION NO. 53: 1996
Two small-town boys faced off for the presidency of a predominantly urban nation in 1996. Bill Clinton hailed from Hope, Arkansas, where the most recent federal census had counted 9,643 residents. Bob Dole was born and raised in Russell, Kansas (population: 4,781).40
Arkansas and Kansas were allocated six electoral votes apiece in 1996. Their sum of 12 electors was the lowest home-state total for any pair of major-party nominees in almost a century and a half, and it was tied for second-lowest of all time:
| Year | Total EVs | Nominees (states and EVs) |
| 1848 | 11 | Zachary Taylor (La., 6) vs. Lewis Cass (Mich., 5) |
| 1852 | 12 | Franklin Pierce (N.H., 5) vs. Winfield Scott (N.J., 7) |
| 1996 | 12 | Bill Clinton (Ark., 6) vs. Bob Dole (Kan., 6) |
| 1864 | 23 | Abraham Lincoln (Ill., 16) vs. George McClellan (N.J., 7) |
| 1844 | 25 | James Polk (Tenn., 13) vs. Henry Clay (Ky., 12) |
This chart does not include elections with a single nominee (1789, 1792, 1820) or three nominees (1836, 1860). This note also applies to the next chart.
But raw numbers don’t tell the whole story. There were only 290 electors in 1848, compared to 538 in 1996. Louisiana’s six votes accounted for 2.07 percent of the Electoral College in Zachary Taylor’s time, making them nearly twice as valuable as the same six votes cast by Arkansas or Kansas (1.12% each) in the Clinton-Dole contest. If we add the relevant percentages and do the necessary rounding, it becomes clear that the 1996 election featured the major-party nominees who truly came from the smallest states:
| Year | Share of EVs | Nominees (states and EVs) |
| 1996 | 2.23% | Bill Clinton (Ark., 6) vs. Bob Dole (Kan., 6) |
| 1848 | 3.79% | Zachary Taylor (La., 6) vs. Lewis Cass (Mich., 5) |
| 1852 | 4.05% | Franklin Pierce (N.H., 5) vs. Winfield Scott (N.J., 7) |
| 1924 | 4.90% | Calvin Coolidge (Mass., 18) vs. John Davis (W.Va., 8) |
| 1964 | 5.58% | Lyndon Johnson (Texas, 25) vs. Barry Goldwater (Ariz., 5) |
Seven elections are listed in one or both of the two charts: 1844, 1848, 1852, 1864, 1924, 1964, and 1996. The voter turnout percentage for each of these races was lower than the corresponding rate four years earlier. The decline was particularly steep in 1996, when only 49 percent of voting-age adults went to the polls (the third-worst rate in American history), down from 55.2 percent in 1992. Candidates from small states don’t stir the electorate.
Nor do they inspire much support. Only seven nominees in the past 100 years have come from states with fewer than 10 electoral votes. Five were buried in general-election landslides: John Davis in 1924, Alfred Landon in 1936, Barry Goldwater in 1964, George McGovern in 1972, and Dole. Clinton was responsible for both exceptions, scoring victories in 1992 and 1996.
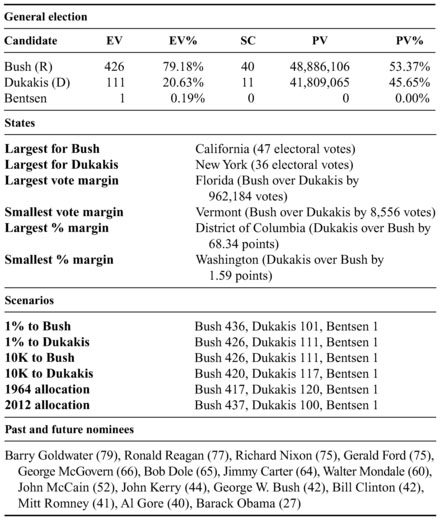
ELECTION NO. 54: 2000
Who really won the election of 2000?
The final returns show George W. Bush eking out a five-vote margin in the Electoral College, despite trailing Al Gore by nearly 544,000 popular votes. But the true answer is more complicated and much messier than that.
The outcome pivoted on Florida, where the officials who supervised the voting process were guilty of inefficiency, ineptitude, and/or injustice (take your pick). They functioned as ringmasters for a five-week postelection circus that amazed and appalled the nation. Canvassing boards counted and recounted the votes cast by 6 million Floridians. Statewide totals were revised on a daily basis, often more frequently than that. Bush always retained the lead, but his razor-thin margin fluctuated dangerously. Lawyers for both parties ran to any court that would listen, seeking either to extend the recount or to stop it altogether.
The Republicans finally prevailed in the Supreme Court, which ruled 5–4 in mid-December that the window for counting had closed. Bush was certified as the winner by a statewide margin of 537 votes. Florida’s 25 electoral votes were enough—just barely—to give him the presidency.
Democrats were predictably outraged, accusing Bush of blatant thievery. Yet neither party had an airtight case. A consortium of newspapers, including USA Today, the Miami Herald, and the Tampa Tribune, reviewed the 171,900 disputed ballots at the heart of the Florida controversy. The researchers came up with four possible results, based on various interpretations of the state’s election laws. Bush would have squeaked through to victory in two of those scenarios. Gore would have edged past him in the other two.41
So who really won the election of 2000? Nobody can say with certainty.
But one point is beyond argument: The Gore campaign never should have been forced to put all of its chips on Florida. There were 12 states where a flip of less than 50,000 popular votes would have shifted electoral votes from Bush’s column to Gore’s. Eight of the 12 had supported the Democratic ticket four years earlier, making them prime targets in 2000. Gore was just three electoral votes shy of the presidential threshold of 270. (One of his supporters would subsequently decline to participate in the Electoral College, reducing his final total to 266.)42 He needed to win one of these states— only one out of 12— to reach the White House:
| States won by Bush | EV | Flip for Gore win | Democrats in 1996? |
| Florida | 25 | 269 | Yes |
| New Hampshire | 4 | 3,606 | Yes |
| Nevada | 4 | 10,799 | Yes |
| West Virginia | 5 | 20,490 | Yes |
| Arkansas | 6 | 25,087 | Yes |
| South Dakota | 3 | 35,949 | No |
| Missouri | 11 | 39,394 | Yes |
| North Dakota | 3 | 39,785 | No |
| Tennessee | 11 | 40,115 | Yes |
| Wyoming | 3 | 43,734 | No |
| Alaska | 3 | 44,198 | No |
| Arizona | 8 | 48,156 | Yes |
Florida admittedly would have been the easiest flip, but the real key is ninth on the list. Gore needed to convert 40,115 Bush voters ( just 18 per precinct) to carry his home state of Tennessee. It should have been a simple task. He had appeared on Tennessee’s ballots in six previous elections—four for the House of Representatives, two for the Senate— always drawing at least 60 percent of the vote. He had helped deliver the state in 1992 and 1996 as Bill Clinton’s running mate. And he was returning in 2000 as the first Tennessean to win a major-party nomination in more than a century and a half. How could he possibly lose?
But he did.
Tennessee, like much of the South, had grown more comfortable with Republican nominees since Gore first ran for the House in 1976. Ronald Reagan and George H. W. Bush swept the state in three straight elections in the 1980s. Clinton’s Southern charm and Gore’s home-state appeal prevailed for the Democrats in the 1990s, but the election of 2000 was a different story. George W. Bush offered a tempting conservative alternative to Gore, whose relations with Tennessee had atrophied during his years as vice president. “After the announcement [of his candidacy in his hometown of] Carthage, he rarely came back again until it was too late,” wrote biographers David Maraniss and Ellen Nakashima, “and Tennessee, with the 11 electoral votes that would have made him president, was instead gone to the Texan.”43
Only three men have been elected president without carrying their home states. Richard Nixon, who lived in New York in 1968, was the most recent to accomplish this feat. He was preceded by New Jersey’s Woodrow Wilson in 1916 and by a man buried less than two miles from the Nashville hotel where Gore awaited the returns on that long November night in 2000. James Polk may have lost Tennessee in 1844, but he still managed to win the ultimate prize.
History will always depict Florida as the only state that truly mattered in the cliffhanger of 2000—nothing could ever change that storyline— but it was the loss of Tennessee that sounded the death knell for the oncepromising political career of Al Gore.
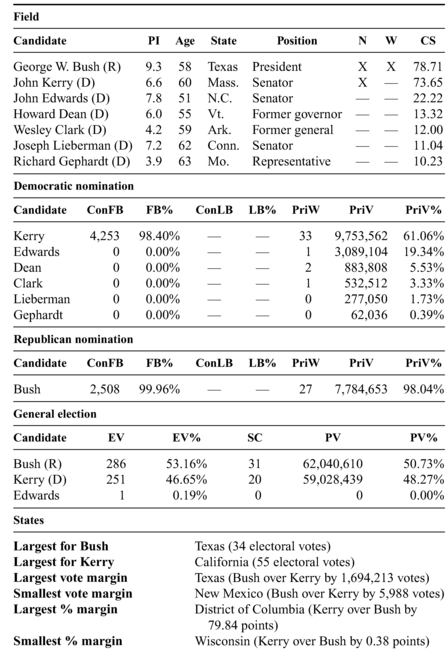
ELECTION NO. 55: 2004
Bill Mazeroski belted one of the most dramatic home r uns in baseball history, a ninth-inning shot that clinched the seventh and final game of the 1960 World Series for the Pittsburgh Pirates. The glory of that moment was captured in a classic photograph. Maz was rounding third base, his right arm high in triumph, his left hand clutching his cap, as he frantically scrambled to reach home plate ahead of an onrushing mob of fans.
It was an unfamiliar role for Mazeroski, who was never much of a threat at the plate. He hit only 138 home runs during his 17-year career, and his lifetime batting average was a pedestrian .260.44 But he had no peer in the field. No less an expert than Bill James dubbed him “the most effective defensive second baseman ever.”45 His dexterity with the glove—and perhaps the afterglow of that historic home run—eventually earned Maz a place in the National Baseball Hall of Fame.
His election came as a bit of a shock. Most of the non-pitchers enshrined in the hall were heavy hitters. Eighty-five of them batted .300 or better for their careers; 42 launched at least 300 homers.46 The thought of joining such powerful sluggers left Mazeroski momentarily speechless. “I don’t really know what to say,” he stammered. “I never, ever expected to be here.”47
George W. Bush should be able to relate. (You knew I’d get to the point eventually, didn’t you?) Bush, like Mazeroski, performed at a very high level in his chosen field—and yet, also like Maz, he never seemed all that impressive statistically.
Only 17 men have won a pair of presidential elections, a rarefied group that includes Bush. But neither of his victories was a resounding triumph; both came by the skin of his teeth. A flip of just 269 votes in Florida would have kept him out of the White House in 2000. A reversal in Ohio would have prevented his reelection in 2004. It’s no surprise that Bush ranks dead last among multiterm presidents in both equalized electoral votes and cumulative campaign scores:
| Candidate | Wins | Total EV*EQ | Total CS |
| Franklin Roosevelt | 4 | 1,901 | 366.37 |
| George Washington | 2 | 1,076 | 192.36 |
| Ronald Reagan | 2 | 1,014 | 186.29 |
| James Monroe | 2 | 990 | 186.14 |
| Dwight Eisenhower | 2 | 911 | 180.59 |
| Ulysses Grant | 2 | 833 | 174.91 |
| Richard Nixon | 2 | 821 | 173.26 |
| Andrew Jackson | 2 | 779 | 172.02 |
| Thomas Jefferson | 2 | 780 | 170.89 |
| Abraham Lincoln | 2 | 810 | 170.55 |
| Bill Clinton | 2 | 749 | 166.23 |
| Barack Obama | 2 | 697 | 165.62 |
| James Madison | 2 | 692 | 164.53 |
| Woodrow Wilson | 2 | 722 | 164.33 |
| William McKinley | 2 | 677 | 164.13 |
| Grover Cleveland | 2 | 630 | 159.51 |
| George W. Bush | 2 | 558 | 155.92 |
This chart is restricted to EV*EQ and CS totals for each candidate’s winning years. It does not include any statistics from losing years.
Both of Bush’s single-year campaign scores rank among the 10 worst for any general-election winner. His CS of 77.21 in 2000 is the third-lowest in the group of 57 victorious candidates. He improved marginally in 2004 to 78.71, which is ninth-worst on the same list.
The latter was actually the less impressive of his two races. Bush defeated John Kerry by 35 electoral votes—a virtual landslide in comparison to his five-vote margin over Al Gore—yet much more had been expected of him. “Given how Bush’s term started, the election should never have been close,” columnist Charles Krauthammer wrote. “After 9/11 and America’s swift crushing of the Taliban, President Bush had the political world at his feet.”48 It was true. The first Gallup Poll of 2004 showed Bush with a healthy approval rating of 60 percent, and he held a massive PI advantage over Kerry (9.3 to 6.6).49 But he still came close to losing.
The growing unpopularity of the Iraq War had something to do with Bush’s swoon in 2004, as did residual Democratic outrage over the Florida debacle four years earlier. But the key factor was Bush’s inability to seal the deal, to convince voters that he was the logical choice to lead the nation for another four years. His return on potential in 2004 was just 85 points, the mark of an ineffective campaign. Bush’s ROP was 28 percent below the average for a victorious candidate (118). It was, in fact, the lowest ROP for the winner of any presidential election in American history.
ELECTION NO. 56: 2008

The drive for equality was gathering momentum in 1963.
Congress passed the Equal Pay Act in June, making it illegal for employers to pay lower wages to women than to men who held identical jobs. The first black students entered the University of Alabama that same month, despite Governor George Wallace’s vow to block their admission. Martin Luther King delivered his famous “I have a dream” speech from the steps of the Lincoln Memorial in August, envisioning a time when “all of God’s children” would enjoy the full range of their constitutional rights. “Free at last, free at last,” he exulted. “Thank God Almighty, we are free at last.”50
Forty-four presidential elections had been held up to that point, and all had been won by white men. Would the streak eventually be broken by the new spirit sweeping the nation? The Gallup Poll asked voters in 1963 whether they might support a “well-qualified” female candidate for the White House. Just 58 percent of men could imagine doing so. Women were even more skeptical, with only 51 percent willing to support somebody of their own gender. The concept of a black president was so outlandish that Gallup didn’t even pose the question.51
The uninterrupted line of white males would roll on through 55 elections. It finally ended in 2008, when a white woman and a black man squared off for the Democratic nomination. Most pundits expected Hillary Clinton to win. She was considerably more famous than Barack Obama, and female voters outnumbered black voters by a ratio of 4–1.
Yet Obama was elected president.
His victory made sense in retrospect. Blacks had shown far greater determination in the pursuit of equality since the 1960s. They had secured congressional approval of the Civil Rights Act and Voting Rights Act— with prodigious assistance from white allies—while feminists had been unable to embed the Equal Rights Amendment in the Constitution.
Blacks had also been more tenacious in seeking the presidency. Three African Americans (Shirley Chisholm, Jesse Jackson, and Alan Keyes) mounted a total of five qualified candidacies prior to 2008. Other prominent African Americans launched campaigns—briefly in some instances— without reaching qualification levels. Among them were Douglas Wilder, the governor of Virginia, in 1992; Carol Moseley Braun, a former senator from Illinois, in 2004; and Al Sharpton, a Baptist minister from New York, also in 2004.
Fewer women made the effort. The first to seek a major-party nomination was a senator from Maine, Margaret Chase Smith, in 1964. She had served 24 years in Congress, yet many of her senatorial colleagues considered her candidacy presumptuous. “When people keep telling you [that] you can’t do a thing,” she responded, “you kind of like to try.”52 She drew 27 votes at the Republican convention, yet fell short of qualification levels.
Chisholm, who ran in 1972, was the first woman to emerge as a qualified candidate. “Other kinds of people can steer the ship of state besides white men,” the Brooklyn congresswoman told reporters.53 She attracted few white voters—male or female—and found many fellow blacks to be strangely resistant. “If anyone thinks white men are sexists,” she grumbled, “let them check out black men sometime.”54 Chisholm finished a distant fourth at the Democratic convention. Another 36 years would pass before Clinton became the second woman to be a qualified candidate.
Obama broke through the White House’s racial barrier in 2008, but several others remain in place. The next to fall will almost certainly be the gender restriction. “The American people are very, very ready for a woman president,” insists Nancy Pelosi, the former speaker of the House. “They’re far ahead of the politicians.”55 Her opinion is reinforced by the Gallup Poll, which reported in 2012 that 95 percent of its respondents were willing to support a female presidential candidate.56
But what about the other groups that have been excluded? Almost all Americans could imagine voting for a “generally well-qualified” presidential contender who is Hispanic (92%) or Jewish (91%), according to the Gallup Poll. But support is lower for any contender who is Mormon (80%), gay (68%), Muslim (58%), or an atheist (54%).
The only Mormon to receive a major-party nomination was Mitt Romney, who lost the 2012 general election to Obama. None of the other groups in the previous paragraph has enjoyed any real success at all. Two have produced a single qualified candidate with a CS of less than 12 points: Jews (Joseph Lieberman in 2004) and Hispanics (Bill Richardson in 2008). The others have been shut out.
It should be noted, however, that some historians disagree with that last sentence. They contend that America’s first gay president was elected 160 years ago. James Buchanan, a lifelong bachelor, shared a home with William Rufus King, a senator from Alabama, between 1834 and 1844. Andrew Jackson and other political contemporaries referred to the housemates as “Aunt Nancy” and “Aunt Fancy,” or as husband and wife.57 The gossip did not bar either man from political advancement. King was elected vice president in 1852. Buchanan won the presidency four years later.
Most of the letters between Buchanan and King were destroyed—their relatives saw to that—so nobody can offer definitive proof of their supposedly prurient feelings for each other. The speculation, of course, will never end.
ELECTION NO. 57: 2012
We Americans are a dissatisfied bunch.
The NBC News/Wall Street Journal Poll has been asking the same question several times a year for the past couple of decades: “All in all, do you think things in the nation are generally headed in the right direction, or do you feel that things are off on the wrong track?”58 These were the responses the first time the question was posed each year:
| Year | Right direction | Wrong track | Mixed or no opinion |
| 1995 | 30% | 50% | 20% |
| 1996 | 25% | 54% | 21% |
| 1997 | 44% | 40% | 16% |
| 1998 | 47% | 34% | 19% |
| 1999 | 49% | 38% | 13% |
| 2000 | 55% | 28% | 17% |
| 2001 | 45% | 36% | 19% |
| 2002 | 62% | 20% | 18% |
| 2003 | 36% | 47% | 17% |
| 2004 | 47% | 43% | 10% |
| 2005 | 40% | 47% | 13% |
| 2006 | 31% | 57% | 12% |
| 2007 | 28% | 57% | 15% |
| 2008 | 19% | 68% | 13% |
| 2009 | 26% | 59% | 15% |
| 2010 | 34% | 54% | 12% |
| 2011 | 35% | 56% | 9% |
| 2012 | 30% | 61% | 9% |
| 2013 | 35% | 57% | 8% |
| 2014 | 28% | 63% | 9% |
Pessimists outnumbered optimists 13 times over the 20-year span, including every poll since 2005. The median score for the entire period was 35 percent for the right direction, 52 percent for the wrong track.
That had to be bad news for incumbents, right? Voters appear to have been in an angry mood since the mid-1990s, especially when sitting presidents seek second terms. Wrong-trackers held leads of 29 percentage points over right-directionists at the beginning of 1996 (Bill Clinton’s reelection year) and 31 points at the start of 2012 (Barack Obama’s second turn). George W. Bush was in better shape in 2004, when the right-direction camp held a narrow advantage of four points, though a sizable 43 percent of Americans still believed he was leading the nation the wrong way.
But we all know what happened. Voters roared like enraged lions to the pollsters, but millions evolved into docile lambs when casting their ballots. Clinton, Bush, and Obama were all reelected, the first consecutive trio of presidents to accomplish that feat since the Jefferson-Madison-Monroe heyday of the Virginia Dynasty.
The current love for incumbents is reminiscent of the Elite Era, when members of the Electoral College happily handed the presidency to a series of rich and powerful men. The typical president who sought reelection between 1789 and 1836 enjoyed an upswing in his CS, posting an average increase of 2.31 points between his first win and his subsequent race.
The two following eras proved to be much tougher. Twelve elected presidents sought second terms between 1840 and 1956. Half of them failed. Franklin Pierce wasn’t renominated, and five others were defeated in November. These misfortunes are reflected in average CS declines of nearly 8.6 points in the Volatile Era and a whopping 12 points in the Progressive Era.
But conditions have grown much more favorable for incumbents since the onset of the Modern Era. Yes, Jimmy Carter and George H. W. Bush were defeated, but the other five elected presidents who sought second terms were able to secure them, usually quite easily. Campaign scores for the seven who pursued reelection slipped by an average of just 2.4 points, a pittance compared to previous eras:
| Era | Seeking 2nd term | Nominees | Winners | CS change |
| Elite Era (1789-1836) | 7 | 7 | 5 | 2.31 |
| Volatile Era (1840-1908) | 7 | 6 | 3 | -8.57 |
| Progressive Era (1912-1956) | 5 | 5 | 3 | -12.03 |
| Modern Era (1960-2012) | 7 | 7 | 5 | -2.44 |
| Total | 26 | 25 | 16 | -4.66 |
This chart is restricted to presidents who were elected to a first term and sought reelection four years later. It does not include vice presidents who were elevated upon the death or resignation of a predecessor. Nor does it include Franklin Roosevelt’s third and fourth terms.
The electorate has been seething with rage and fury during the past couple of decades, or so the media would have us believe. Superficial evidence seems to support this contention. Avid liberals still troop onto MSNBC to call George W. Bush a nitwit. Tea Party conservatives congregate on Fox News to blast Barack Obama as a socialist.
But the previous chart tells a different story. Extremists in both parties may expel their venom, but everyday voters accept the status quo more willingly now than in previous eras. They often wish things were better— hence the frustration expressed in the NBC/Wall Street Journal survey— but most of them are not consistently angry.
“Voter anger was the Vietnam era, the civil rights era,” said Democratic pollster John Anzalone as the 2012 campaign began. “Even the gas lines of the 1970s and hyperinflation during [the] Carter [administration]; that was anger.”59 He might also have gone back in time to add the fiery dispute over slavery, the bloody battles of the Civil War, the rhetorical conflict between populists and Eastern financiers, and the verbal sparring between isolationists and interventionists prior to both world wars.
Nobody is denying that America has passed through periods of great anger. This just doesn’t happen to be one of them.