
Notes
| Bike Lanes | CONVENTIONAL BIKE LANES BUFFERED BIKE LANES CONTRA-FLOW BIKE LANES LEFT-SIDE BIKE LANES |
| Cycle Tracks | ONE-WAY PROTECTED CYCLE TRACKS RAISED CYCLE TRACKS TWO-WAY CYCLE TRACKS |
| Intersections | BIKE BOXES INTERSECTION CROSSING MARKINGS TWO-STAGE TURN QUEUE BOXES MEDIAN REFUGE ISLAND CYCLE TRACK INTERSECTION APPROACH |
| Signals | BICYCLE SIGNAL HEADS HYBRID BEACON FOR BIKE ROUTE CROSSING |
| Signing and Marking | COLORED BIKE FACILITIES SHARED LANE MARKINGS BIKE ROUTE WAYFINDING |
| Bicycle Boulevards | ROUTE PLANNING SIGNS AND PAVEMENT MARKINGS SPEED MANAGEMENT VOLUME MANAGEMENT MINOR STREET CROSSINGS MAJOR STREET CROSSINGS OFFSET INTERSECTIONS GREEN INFRASTRUCTURE |
Introduction
1 http://www.fhwa.dot.gov/environment/bikeped/mutcd_bike.htm
Bike Lanes
CONVENTIONAL BIKE LANES
2 “The recommended width of a bike lane is 1.5m(5 feet) from the face of a curb or guardrail to the bike lane stripe.”
“If the [longitudinal] joint is not smooth, 1.2m (4 feet) of ridable surface should be provided.”
AASHTO. (1999). GUIDE FOR THE DEVELOPMENT OF BICYCLE FACILITIES.
3 “If parking is permitted, … the bike lane should be placed between the parking area and the travel lane and have a minimum width of 1.5 m (5 feet).”
“Where parking is permitted but a parking stripe or stalls are not utilized, the shared area should be a minimum 3.6 m (12 feet) adjacent to a curb face … If the parking volume is substantial or turnover is high, an additional 0.3 to 0.6 m (1 to 2 feet) of width is desirable.”
AASHTO. (1999). GUIDE FOR THE DEVELOPMENT OF BICYCLE FACILITIES.
4 “On new structures [with railings], the minimum clear width should be the same as the approach paved shared use path, plus the minimum 0.6-m (2-foot) wide clear areas.”
AASHTO. (1999). GUIDE FOR THE DEVELOPMENT OF BICYCLE FACILITIES.
5 Markings shall be placed:
• At the beginning of bike lane
• At the far side of all bike path crossings
• At approaches and at far side of all arterial crossings
• At major changes in direction
• At intervals not to exceed 1/2 mile
• At beginning and end of bike lane pockets at approach to intersection
LOS ANGELES BICYCLE PLAN UPDATE (2010).
CHAPTER 5 — TECHNICAL DESIGN HANDBOOK-DRAFT.
6 “A bike lane should be delineated from the motor vehicle travel lanes with a 150-mm (6-inch) solid white line. Some jurisdictions have used a 200-mm (8-inch) line for added distinction.”
AASHTO. (1999). GUIDE FOR THE DEVELOPMENT OF BICYCLE FACILITIES.
7 “An additional 100-mm (4-inch) solid white line can be placed between the parking lane and the bike lane. This second line will encourage parking closer to the curb, providing added separation from motor vehicles, and where parking is light it can discourage motorists from using the bike lane as a through travel lane.”
AASHTO. (1999). GUIDE FOR THE DEVELOPMENT OF BICYCLE FACILITIES.
8 “Since bicyclists usually tend to ride a distance of 0.8-1.0 m (32-40 inches) from a curb face, it is very important that the pavement surface in this zone be smooth and free of structures. Drain inlets and utility covers that extend into this area may cause bicyclists to swerve, and have the effect of reducing the usable width of the lane. Where these structures exist, the bike lane width may need to be adjusted accordingly.”
AASHTO. (1999). GUIDE FOR THE DEVELOPMENT OF BICYCLE FACILITIES.
BUFFERED BIKE LANES
9 “Bicycle lane — the preferential lane-use marking for a bicycle lane shall consist of a bicycle symbol or the word marking BIKE LANE.”
FEDERAL HIGHWAY ADMINISTRATION. (2009). MANUAL ON UNIFORM TRAFFIC CONTROL DEVICES. SECTION 3D.01.
10 Standard guidance for Buffer-separated right-hand side preferential lane buffer configurations (MUTCD 3D.02 03-D):
1. A wide solid double white line along both edges of the buffer space where crossing the buffer space is prohibited.
2. A wide solid single white line along both edges of the buffer space where crossing of the buffer space is discouraged.
FEDERAL HIGHWAY ADMINISTRATION. (2009). MANUAL ON UNIFORM TRAFFIC CONTROL DEVICES. SECTION 3D.02.
11 “When crosshatch markings are used in paved areas that separate traffic flows in the same general direction, they shall be white and they shall be shaped as chevron markings, with the point of each chevron facing toward approaching traffic…”
FEDERAL HIGHWAY ADMINISTRATION. (2009). MANUAL ON UNIFORM TRAFFIC CONTROL DEVICES. SECTION 3B.24.
12 “The longitudinal spacing of the chevrons or diagonal lines should be determined by engineering judgment considering factors such as speeds and desired visual impacts. The chevrons and diagonal lines should form an angle of approximately 30 to 45 degrees with the longitudinal lines that they intersect.”
FEDERAL HIGHWAY ADMINISTRATION. (2009). MANUAL ON UNIFORM TRAFFIC CONTROL DEVICES. SECTION 3B.24.
CONTRA-FLOW BIKE LANES
13 Center line pavement markings, when used, shall be the pavement markings used to delineate the separation of traffic lanes that have opposite directions of travel on a roadway and shall be yellow (3B.01 01).
Two-direction no-passing zone markings consisting of two normal solid yellow lines where crossing the center line markings for passing is prohibited for traffic traveling in either direction (3B.01 04.C).
FEDERAL HIGHWAY ADMINISTRATION. (2009). MANUAL ON UNIFORM TRAFFIC CONTROL DEVICES.
14 “Where there is room for bike lanes on both sides of the street, they should be included to clarify where bicyclists should travel. If there is no room for a full bike lane, other pavement markings or signs should be considered to clarify direction.”
PEDESTRIAN AND BICYCLE INFORMATION CENTER. (2006).
BIKESAFE: BICYCLE COUNTERMEASURE SELECTION SYSTEM.
PUBLICATION NO. FHWA-SA-05-006,
FEDERAL HIGHWAY ADMINISTRATION, WASHINGTON, DC.
LEFT-SIDE BIKE LANES
15 Variant of MUTCD R10-15 to include helmeted bicycle rider symbol (MUTCD figure 9C-3B). Alternate sign in common use, similar to MUTCD R1-5, 1-5a.
Cycle Tracks
ONE-WAY PROTECTED CYCLE TRACKS
16 “Cyclists feel most secure on roads with cycle tracks and most at risk on roads with mixed traffic.”
JENSEN, S. U., ROSENKILDE, C., AND JENSEN, N. (2007). ROAD SAFETY AND PERCEIVED RISK OF CYCLE FACILITIES IN COPENHAGEN. COPENHAGEN: TRAFITEC RESEARCH CENTER.
17 “The construction of [raised] cycle tracks has resulted in a slight drop in the total number of accidents and injuries on the road sections between junctions of 10% and 4% respectively.”
JENSEN, S. U., ROSENKILDE, C., AND JENSEN, N. (2007). ROAD SAFETY AND PERCEIVED RISK OF CYCLE FACILITIES IN COPENHAGEN. COPENHAGEN: TRAFITEC RESEARCH CENTER.
18 Overall, 2.5 times as many cyclists used the cycle tracks compared with the reference streets.”
LUSK, A., FURTH, P., MORENCY, P., MIRANDA-MORENO, L., WILLETT, W., DENNERLEIN, J. (2010). RISK OF INJURY FOR BICYCLING ON CYCLE TRACKS VERSUS IN THE STREET. INJURY PREVENTION.
19 “ Preferential lanes are lanes designated for special traffic uses such as high-occupancy vehicles (HOVs), light rail, buses, taxis, or bicycles.”
FEDERAL HIGHWAY ADMINISTRATION. (2009). MANUAL ON UNIFORM TRAFFIC CONTROL DEVICES. SECTION 2G.01.
20 Cycle Track Width Guidelines in the Netherlands
CROW. (2006). RECORD 25: DESIGN MANUAL FOR BICYCLE TRAFFIC.
CROW, THE NETHERLANDS.
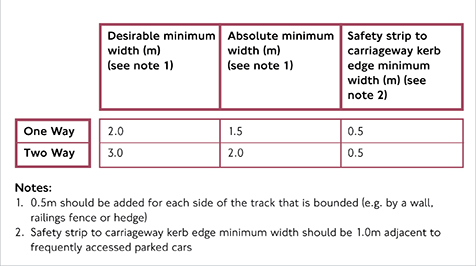
TRANSPORT FOR LONDON. (2005). LONDON CYCLING DESIGN STANDARDS. APPENDIX C. DRAWING NO. CCE\C1
21 “Safety strip to carriageway kerb edge minimum width should be 1.0m adjacent to frequently accessed parked cars.”
TRANSPORT FOR LONDON. (2005). LONDON CYCLING DESIGN STANDARDS.
“Width of critical reaction strip is .50 to .75 m.”
CROW. (2007). DESIGN MANUAL FOR BICYCLE TRAFFIC.
22 see note 17
23 “Parking must be banned along the street with the bike path for a distance long enough to ensure adequate stopping sign distances for motorists crossing the path.”
VELO QUEBEC. (2003). TECHNICAL HANDBOOK OF BIKEWAY DESIGN. 2ND ED. QUEBEC: MINISTERE DES TRANSPORT DU QUEBEC AND THE SECRETARIAT AU LOISIR ET AU SPORT.
24 Variant of MUTCD R10-15 to include helmeted bicycle rider symbol (MUTCD figure 9C-3 B).
ALTERNATE SIGN IN COMMON USE, SIMILAR TO MUTCD R1-5, 1-5A.
25 In these situations, recommended minimum widths should be increased using the following calculation: [Distance from curb to edge of gutter seam] – 18 inches (if the value is positive). For example, if the gutter seam is 24 inches from the curb, add 6 inches to the recommended dimension for a one-way cycle track that serves single-file cycling.
26 “01 Channelizing devices may also be used along a center line to preclude turns or along lane lines to preclude lane changing, as determined by engineering judgment.
03 The color of channelizing devices used outside of temporary traffic control zones shall be either orange or the same color as the pavement marking that they supplement, or for which they are substituted.”
FHWA. (2009). MANUAL ON UNIFORM TRAFFIC CONTROL DEVICES. 3H.01 CHANNELIZING DEVICES.
“Tubular markers may be used effectively to divide opposing lanes of road users, divide vehicular traffic lanes when two or more lanes of moving vehicular traffic are kept open in the same direction, and to delineate the edge of a pavement drop off where space limitations do not allow the use of larger devices.”
FHWA. (2009). MANUAL ON UNIFORM TRAFFIC CONTROL DEVICES. 6F.65 TUBULAR MARKERS.
27 “It is recommended that on roads within built-up areas … cycle tracks are bent in 20-30 meters before and intersecting road (bending-in is defined as bending a separate cycle track toward the carriageway, with the distance between the cycle track and the side of the main carriageway measuring between 0 and 2 m).”
“Function of Bending Cycle Track In:
• Improving conspicuity of cyclists
• improving visibility of cyclists
• clarifying right of way situations”
CROW. (2007). DESIGN MANUAL FOR BICYCLE TRAFFIC.
28 “The ONLY word marking (see MUTCD Figure 3B-23) may be used… to supplement a preferential lane word or symbol marking.”
FEDERAL HIGHWAY ADMINISTRATION. (2009). MANUAL ON UNIFORM TRAFFIC CONTROL DEVICES. SECTION 3B.20.
RAISED CYCLE TRACKS
29 “Compared with bicycling on a reference street… these cycle tracks had a 28% lower injury rate.”
LUSK, A., FURTH, P., MORENCY, P., MIRANDA-MORENO, L., WILLETT, W., DENNERLEIN, J. (2010). RISK OF INJURY FOR BICYCLING ON CYCLE TRACKS VERSUS IN THE STREET. INJURY PREVENTION.
“Cyclists feel most secure on roads with cycle tracks and most at risk on roads with mixed traffic.”
JENSEN, S. U., ROSENKILDE, C., AND JENSEN, N. (2007). ROAD SAFETY AND PERCEIVED RISK OF CYCLE FACILITIES IN COPENHAGEN. COPENHAGEN: TRAFITEC RESEARCH CENTER.
30 “Since the raised bicycle lane is constructed of concrete and has a left edge that is beveled up to a height of half the normal curb height, it adds a very visible edge to the travel lane that a normal, striped bike lane does not provide. The 4:1 slope of the left edge is very forgiving for both bicyclists and motorists who get too close to the edge, but is visually nearly as powerful as a vertical curb.”
PEDESTRIAN AND BICYCLE INFORMATION CENTER. (2006.) BIKESAFE: BICYCLE COUNTERMEASURE SELECTION SYSTEM. PUBLICATION NO. FHWA-SA-05-006, FEDERAL HIGHWAY ADMINISTRATION, WASHINGTON, DC.
31 “Mountable Curb Design: Mountable curb should have a 4:1 or flatter slope and have no lip that could catch bicycle tires.”
LOS ANGELES BICYCLE PLAN UPDATE. (2010). CHAPTER 5—TECHNICAL DESIGN HANDBOOK-DRAFT, 122.
32 see note 17
33 “Safety strip to carriageway kerb edge minimum width should be 1.0m adjacent to frequently accessed parked cars.”
TRANSPORT FOR LONDON. (2005). LONDON CYCLING DESIGN STANDARDS.
“Width of critical reaction strip is .50 to .75 m.”
CROW. (2007). DESIGN MANUAL FOR BICYCLE TRAFFIC.
34 see note 17
35 see note 17
36 “Parking must be banned along the street with the bike path for a distance long enough to ensure adequate stopping sign distances for motorists crossing the path.”
VELO QUEBEC. (2003). TECHNICAL HANDBOOK OF BIKEWAY DESIGN. 2ND ED. QUEBEC: MINISTERE DES TRANSPORT DU QUEBEC AND THE SECRETARIAT AU LOISIR ET AU SPORT.
37 Variant of MUTCD R10-15 to include helmeted bicycle rider symbol (MUTCD figure 9C-3 B). Alternate sign in common use, similar to MUTCD R1-5, 1-5a.
38 “The results show that the paths with raised crossings attracted more than 50 percent more bicyclists and that the safety per bicyclist was improved by approximately 20 percent due to the increase in bicycle flow, and with an additional 10 to 50 percent due to the improved layout.”
GARDER, P., LEDEN, L., PULKKINEN, U. (1998). MEASURING THE SAFETY EFFECT OF RAISED BICYCLE CROSSINGS USING A NEW RESEARCH METHODOLOGY. TRANSPORTATION RESEARCH RECORD, 1636.
39 “It is recommended that on roads within built-up areas … cycle tracks are bent in 20-30 meters before and intersecting road (bending-in is defined as bending a separate cycle track toward the carriageway, with the distance between the cycle track and the side of the main carriageway measuring between 0 and 2 m).”
“Function of Bending Cycle Track In:
• Improving conspicuity of cyclists
• improving visibility of cyclists
• clarifying right of way situations”
CROW. (2007). DESIGN MANUAL FOR BICYCLE TRAFFIC.
TWO-WAY CYCLE TRACKS
40 “Compared with bicycling on a reference street…these cycle tracks had a 28% lower injury rate.”
LUSK, A., FURTH, P., MORENCY, P., MIRANDA-MORENO, L., WILLETT, W., DENNERLEIN, J. (2010). RISK OF INJURY FOR BICYCLING ON CYCLE TRACKS VERSUS IN THE STREET. INJURY PREVENTION.
“Cyclists feel most secure on roads with cycle tracks and most at risk on roads with mixed traffic.”
JENSEN, S. U., ROSENKILDE, C., AND JENSEN, N. (2007). ROAD SAFETY AND PERCEIVED RISK OF CYCLE FACILITIES IN COPENHAGEN. COPENHAGEN: TRAFITEC RESEARCH CENTER
41 “Overall, 2.5 times as many cyclists used the cycle tracks compared with the reference streets.”
LUSK, A., FURTH, P., MORENCY, P., MIRANDA-MORENO, L., WILLETT, W., DENNERLEIN, J. (2010). RISK OF INJURY FOR BICYCLING ON CYCLE TRACKS VERSUS IN THE STREET. INJURY PREVENTION.
42 see note 17
43 “Safety strip to carriageway kerb edge minimum width should be 1.0m adjacent to frequently accessed parked cars.”
TRANSPORT FOR LONDON. (2005). LONDON CYCLING DESIGN STANDARDS.
44 “Parking must be banned along the street with the bike path for a distance long enough to ensure adequate stopping sign distances for motorists crossing the path.”
VELO QUEBEC. (2003). TECHNICAL HANDBOOK OF BIKEWAY DESIGN. 2ND ED. QUEBEC: MINISTERE DES TRANSPORT DU QUEBEC AND THE SECRETARIAT AU LOISIR ET AU SPORT.
45 Variant of MUTCD R10-15 to include helmeted bicycle rider symbol (MUTCD figure 9C-3 B). Alternate sign in common use, similar to MUTCD R1-5, 1-5a.
46 The results show that the paths with raised crossings attracted more than 50 percent more bicyclists and that the safety per bicyclist was improved by approximately 20 percent due to the increase in bicycle flow, and with an additional 10 to 50 percent due to the improved layout.
GARDER, P., LEDEN, L., PULKKINEN, U. (1998). MEASURING THE SAFETY EFFECT OF RAISED BICYCLE CROSSINGS USING A NEW RESEARCH METHODOLOGY. TRANSPORTATION RESEARCH RECORD, 1636.
47 “01 Channelizing devices may also be used along a center line to preclude turns or along lane lines to preclude lane changing, as determined by engineering judgment.
03 The color of channelizing devices used outside of temporary traffic control zones shall be either orange or the same color as the pavement marking that they supplement, or for which they are substituted.”
FHWA. (2009). MANUAL ON UNIFORM TRAFFIC CONTROL DEVICES. 3H.01 CHANNELIZING DEVICES.
“Tubular markers may be used effectively to divide opposing lanes of road users, divide vehicular traffic lanes when two ormore lanes of moving vehicular traffic are kept open in the same direction, and to delineate the edge of a pavement drop off where space limitations do not allow the use of larger devices.”
FHWA. (2009). MANUAL ON UNIFORM TRAFFIC CONTROL DEVICES. 6F.65 TUBULAR MARKERS.
48 “It is recommended that on roads within built-up areas … cycle tracks are bent in 20-30 meters before and intersecting road (bending-in is defined as bending a separate cycle track toward the carriageway, with the distance between the cycle track and the side of the main carriageway measuring between 0 and 2 m).”
“Function of Bending Cycle Track In:
• Improving conspicuity of cyclists
• improving visibility of cyclists
• clarifying right of way situations”
CROW. (2007). DESIGN MANUAL FOR BICYCLE TRAFFIC.
Intersections
BIKE BOXES
49 This is especially important in areas with high volumes of right-turning vehicles and/or trucks, whose high cabs make it difficult to see a bicyclist on the right, and who begin their turning maneuvers by going straight, which can deceive a bicyclist into thinking the truck is not turning.
“Cyclists travelling straight ahead were found to be able to position themselves in front of the traffic thus reducing the risk of conflict with … turning vehicles.”
A LLEN, D., S. BYGRAVE, AND H. HARPER. (2005). BEHAVIOUR AT CYCLE ADVANCED STOP LINES (REPORT NO. PPR240). TRANSPORT FOR LONDON, LONDON ROAD SAFETY UNIT.
50 “Feedback from the public indicates that eight feet is not large enough to comfortably maneuver into the box.”
BRADY, J., MILLS, A., LOSKORN, J., DUTHIE, J., MACHEMEHL, R., CENTER FOR TRANSPORTATION RESEARCH. (2010). EFFECTS OF BICYCLE BOXES ON BICYCLIST AND MOTORIST BEHAVIOR AT INTERSECTIONS. THE CITY OF AUSTIN.
“The two stop lines must be between 4 and 5m apart; the area between them across the full width of the approach is available for cyclists who wait at the rest light.”
A LLEN, D., S. BYGRAVE, AND H. HARPER. (2005). BEHAVIOUR AT CYCLE ADVANCED STOP LINES. REPORT NO. PPR240. TRANSPORT FOR LONDON, LONDON ROAD SAFETY UNIT.
51 “The video data showed that motorist encroachment into the pedestrian crosswalk fell significantly compared to the control intersection. … This reduction of motor vehicles entering the crosswalk area has the potential to improve pedestrian safety”
MONSERE, C., & DILL, J. (2010). EVALUATION OF BIKE BOXES AT SIGNALIZED INTERSECTIONS. FINAL DRAFT. OREGON TRANSPORTATION RESEARCH AND EDUCATION CONSORTIUM.
52 “Use of bold demarcation of the box is vital. This could involve wider striping than the norm or perhaps painting the box a bright color.”
HUNTER, W. W. (2000). EVALUATION OF INNOVATIVE BIKE-BOX APPLICATION IN EUGENE, OREGON. TRANSPORTATION RESEARCH RECORD, 1705, 99-106.
53 “In regards to motorist stopping behavior, the percentage of motorists that encroached on the stop line decreased significantly with the implementation of the skeleton [uncolored] bicycle box.”
BRADY, J., MILLS, A., LOSKORN, J., DUTHIE, J., MACHEMEHL, R., CENTER FOR TRANSPORTATION RESEARCH. (2010). EFFECTS OF BICYCLE BOXES ON BICYCLIST AND MOTORIST BEHAVIOR AT INTERSECTIONS. THE CITY OF AUSTIN.
“The motorist survey revealed a strong preference for color. In addition, cyclists appear to use the box more as intended with the color, which should increase their visibility and improve safety.”
MONSERE, C., & DILL, J. (2010). EVALUATION OF BIKE BOXES AT SIGNALIZED INTERSECTIONS. FINAL DRAFT. OREGON TRANSPORTATION RESEARCH AND EDUCATION CONSORTIUM.
“Use of bold demarcation of the box is vital. This could involve wider striping than the norm or perhaps painting the box a bright color.”
HUNTER, W. W. (2000). EVALUATION OF INNOVATIVE BIKE-BOX APPLICATION IN EUGENE, OREGON. TRANSPORTATION RESEARCH RECORD, 1705, 99-106.
Support for Colored Pavement in Bike Lanes: “Significantly more motorists yielded to bicyclists after the blue pavement had been installed (92 percent in the after period versus 72 percent in the before period.”
HUNTER, W.W. ET AL. (2000). EVALUATION OF BLUE BIKE-LANE TREATMENT IN PORTLAND, OREGON. TRANSPORTATION RESEARCH RECORD, 1705, 107-115.
“Best estimates for safety effects of one blue cycle crossing in a junction are a reduction of 10% in accidents and 19% in injuries.”
J ENSEN, S. U. (2008). SAFETY EFFECTS OF BLUE CYCLE CROSSINGS: A BEFORE-AFTER STUDY. ACCIDENT ANALYSIS & PREVENTION, 40(2), 742-750.
54 “It appears that [ingress lanes] provide cyclists with a considerable advantage in legally accessing [the bike box].” The site with no feeder lane “clearly showed that many cyclists were unable to reach the reservoir.”
A TKINS SERVICES. (2005). ADVANCED STOP LINE VARIATIONS RESEARCH STUDY. REPORT NO. 503 1271. TRANSPORT FOR LONDON, LONDON ROAD SAFETY UNIT.
“Two of the sites with distinctly coloured feeder lanes had lower levels of encroachment suggesting that colour differentiation may reduce levels of encroachment.”
A LLEN, D., S. BYGRAVE, AND H. HARPER. (2005). BEHAVIOUR AT CYCLE ADVANCED STOP LINES. REPORT NO. PPR240. TRANSPORT FOR LONDON, LONDON ROAD SAFETY UNIT.
55 “Where there was no cycle lane across the junction, cyclists were observed looking over their shoulders at the exit-arm pinch-point which is likely to impact on their level of comfort, and both perceived and actual safety.”
A TKINS SERVICES. (2005). ADVANCED STOP LINE VARIATIONS RESEARCH STUDY. REPORT NO. 503 1271. TRANSPORT FOR LONDON, LONDON ROAD SAFETY UNIT. 8-2.
56 Variant of MUTCD R10-15 to include helmeted bicycle rider symbol (MUTCD figure 9C-3 B). Alternate sign in common use, similar to MUTCD R1-5, 1-5a.
57 “Use of bold demarcation of the box is vital. This could involve wider striping than the norm or perhaps painting the box a bright color.”
HUNTER, W. W. (2000). EVALUATION OF INNOVATIVE BIKE-BOX APPLICATION IN EUGENE, OREGON. TRANSPORTATION RESEARCH RECORD, 1705, 99-106.
58 To traverse a multi-lane bike box, significant lateral movement by the bicyclist is needed. This maneuver can take time and could potentially create conflicts by providing a green light for motorists while bicyclists are moving laterally through the bike box . For this reason, careful consideration should be given before applying.
59 “Bicycle traffic signals are used to reduce turning conflicts at signalized intersections and often provide separate and sometimes exclusive phases for bicyclists.”
F EDERAL HIGHWAY ADMINISTRATION. (2010). INTERNATIONAL TECHNOLOGY SCANNING PROGRAM, PEDESTRIAN AND BICYCLE MOBILITY AND SAFETY IN EUROPE. FHWA-PL-10-010.
INTERSECTION CROSSING MARKINGS
60 “In areas where cyclists/motorist conflicts are not a major concern, white dashed markings are adequate since the comprehension is adequate and not adverse in nature, and minimizes undue materials and maintenance costs. For areas where conflicts may be of greater concern, the sharrow treatment is the preferred option (of the four testes) for raising awareness.”
TRANSPORTATION ASSOCIATION OF CANADA. (2008). COLOURED BICYCLE LANES SIMULATOR TESTING. FILE 785.
61 “Significantly more motorists yielded to bicyclists after the blue pavement had been installed (92 percent in the after period versus 72 percent in the before period.”
HUNTER, W.W. ET AL. (2000). EVALUATION OF BLUE BIKE-LANE TREATMENT IN PORTLAND, OREGON. TRANSPORTATION RESEARCH RECORD, 1705, 107-115.
62 “Significantly fewer bicyclists slowed or stopped when approaching the conflict areas in the after period.”
HUNTER, W.W. ET AL. (2000). EVALUATION OF BLUE BIKE-LANE TREATMENT IN PORTLAND, OREGON. TRANSPORTATION RESEARCH RECORD, 1705, 107-115.
63 “Best estimates for safety effects of one blue cycle crossing in a junction are a reduction of 10% in accidents and 19% in injuries.”
JENSEN, S. U. (2008). SAFETY EFFECTS OF BLUE CYCLE CROSSINGS: A BEFORE-AFTER STUDY. ACCIDENT ANALYSIS & PREVENTION, 40(2), 742-750.
64 “Pavement markings extended into or continued through an intersection or interchange area shall be the same color and at least the same width as the line markings they extend.”
FEDERAL HIGHWAY ADMINISTRATION. (2009). MANUAL ON UNIFORM TRAFFIC CONTROL DEVICES. SECTION 3B.08.
65 A bike lane should be delineated from the motor vehicle travel lanes with a 150-mm (6-inch) solid white line. Some jurisdictions have used a 200-mm (8-inch) line for added distinction.
AASHTO. (1999). GUIDE FOR THE DEVELOPMENT OF BICYCLE FACILITIES.
66 “In areas where the practitioner deems that a bicycle lane carried through a conflict zone warrants increased visibility and/or demarcation, the following is recommended: … If there is a requirement for lane markings then a succession of bicycle stencils may optionally be placed between the dashed bicycle lane markings.”
TRANSPORTATION ASSOCIATION OF CANADA. (2008). COLOURED BICYCLE LANES SIMULATOR TESTING. FILE 785.
67 “Rotated bicycle symbols in bike lanes at intersections and driveways oriented towards turning or entering motorists: Can be implemented at present time.”
FEDERAL HIGHWAY ADMINISTRATION. (2011). BICYCLE FACILITIES AND THE MANUAL ON UNIFORM TRAFFIC CONTROL DEVICES.
68 “Significantly more motorists yielded to bicyclists after the blue pavement had been installed (92 percent in the after period versus 72 percent in the before period).”
HUNTER, W.W. ET AL. (2000). EVALUATION OF BLUE BIKE-LANE TREATMENT IN PORTLAND, OREGON. TRANSPORTATION RESEARCH RECORD, 1705, 107-115.
69 Elephant’s Feet Bicycle Crossing Markings are defined as 200-400 mm wide squares with equal distance spacing.
TRANSPORTATION ASSOCIATION OF CANADA. (2008). COLOURED BICYCLE LANES SIMULATOR TESTING. FILE 785.
70 “Yield lines (see Figure 3B-16) shall consist of a row of solid white isosceles triangles pointing toward approaching vehicles extending across approach lanes to indicate the point at which the yield is intended or required to be made.”
FEDERAL HIGHWAY ADMINISTRATION. (2009). MANUAL ON UNIFORM TRAFFIC CONTROL DEVICES. SECTION 3B.16.
TWO-STAGE TURN QUEUE BOXES
71 “Bicycle Hook Turn Storage Areas should be up to 3.0 metres long and at least 1.0 metre wide.”
RTA. (2009). BICYCLE STORAGE AREAS AND ADVANCED BICYCLE STOP LINES. TECHNICAL DIRECTION.
Stacking facility for bicyclists turning left at traffic control system: “depending on intensity, width of stacking area > 1.2 m.”
CROW. (2006). RECORD 25: DESIGN MANUAL FOR BICYCLE TRAFFIC. CROW, THE NETHERLANDS.
72 “Bicycle traffic signals are used to reduce turning conflicts at signalized intersections and often provide separate and sometimes exclusive phases for bicyclists.”
FEDERAL HIGHWAY ADMINISTRATION. (2010). INTERNATIONAL TECHNOLOGY SCANNING PROGRAM, PEDESTRIAN AND BICYCLE MOBILITY AND SAFETY IN EUROPE. FHWA-PL-10-010.
MEDIAN REFUGE ISLAND
73 Width of refuge:
2.0 m (6 ft) = poor
2.5 m (8 ft) = satisfactory
3.0 m (10 ft) = good
AASHTO. (1999). GUIDE FOR THE DEVELOPMENT OF BICYCLE FACILITIES. P.51-52.
74 “The ends of the islands first approached by traffic should be preceded by diverging longitudinal pavement markings on the roadway surface, to guide vehicles into desired paths of travel along the islands edge.”
FEDERAL HIGHWAY ADMINISTRATION. (2009). MANUAL ON UNIFORM TRAFFIC CONTROL DEVICES.
75 “Retroreflective solid yellow markings should be placed on the approach ends of raised medians and curbs of islands that are located in the line of traffic flow where the curb serves to channel traffic to the right of the obstruction.”
“ Retroreflective solid white markings should be used when traffic is permitted to pass on either side of the island.”
FEDERAL HIGHWAY ADMINISTRATION. (2009). MANUAL ON UNIFORM TRAFIC CONTROL DEVICES. SECTION 3B.23.
76 “Length of island should be 2 m (6 ft) or greater.”
AASHTO. (1999). GUIDE FOR THE DEVELOPMENT OF BICYCLE FACILITIES. P.51-52.
77 AASHTO. (2004). GEOMETRIC DESIGN GUIDE OF HIGHWAYS AND STREETS.
78 AASHTO. (2004). GEOMETRIC DESIGN GUIDE OF HIGHWAYS AND STREETS.
79 FEDERAL HIGHWAY ADMINISTRATION. (2009). MANUAL ON UNIFORM TRAFIC CONTROL DEVICES. SECTIONS 3B.16, 2B.11, AND 2B.12.
80 “Landscaping should not exceed 3 ft.”
CITY OF MINNEAPOLIS. (2010). BICYCLE FACILITY MANUAL. P.227.
CYCLE TRACK INTERSECTION APPROACH
81 “Another way [sic] improving interactions between vehicles turning right and cyclists is to truncate the cycle track. One way of doing it is by locating the cycle crossing at an intersection immediately next to the adjacent street and remove [sic] the curb stone at a distance of 20-30 m.”
LEDEN, L., GÅRDER P., JOHANSSON, C. (2005). TRAFFIC ENVIRONMENT FOR CHILDREN AND ELDERLY AS PEDESTRIANS AND CYCLISTS. 18TH ICTCT WORKSHOP.
82 Where it is necessary to route bicyclists from a cycle track to a standard bike lane the transition should be “clear, smooth, safe and comfortable.” Included in the design of the facility should be measures to slow bicyclists down to a safe speed prior to entering/exiting the cycle track. This may be accomplished through the use of ‘Tramline & Ladder’ tactile pavers at the ramps. On the bicyclist path these should run in the direction of travel (‘tramline’).
TRANSPORT FOR LONDON. (2005). LONDON CYCLING DESIGN STANDARDS.
Signals
BICYCLE SIGNAL HEADS
83 Concluding a case study of a bicycle signal head installation in Davis, CA: “Both motorists and bicyclists found the new signal heads to be effective in reducing conflicts between the various modes passing through the intersection. Evaluation of crash data seemed to reflect this as well. For the two-year period before the installation of bicycle signal heads at the intersection of Sycamore and Russell, there were about 16 bicycle and motor vehicle collisions. For the two-year period following the installation, there were only two collisions, neither of which involved bicycles.”
PEDESTRIAN AND BICYCLE INFORMATION CENTER. (2006.) BIKESAFE: BICYCLE COUNTERMEASURE SELECTION SYSTEM. PUBLICATION NO. FHWA-SA-05-006, FEDERAL HIGHWAY ADMINISTRATION, WASHINGTON, DC.
84 “In Davis, the current signal phasing provides for a minimum bicycle green time of 12 seconds and a maximum green time of 25 seconds. Additionally, a two-second all red interval is provided at the end of this phase as opposed to only one second at the end of other phases.”
METROPOLITAN TRANSPORTATION COMMISSION. SAFETY TOOLBOX: ENGINEERING. BICYCLE SIGNALS.
85 A research study collecting cyclist speeds on 15 trails throughout the United States found that the 15th percentile cycling speed is approximately 9.4 miles per hour.
HYBRID BEACON FOR BIKE ROUTE CROSSING OF MAJOR STREET
86 Some controllers have built-in features to specify and program a bicycle minimum green based on bicycle detection. However, if this is not available, and bicycle minimum green time is greater than what would ordinarily be used, the green time should be increased.
FEDERAL HIGHWAY ADMINISTRATION. (2006). SHARED USE PATH LEVEL OF SERVICE CALCULATOR. PUBLICATION: FHWA-HRT-05-138.
87 The need for a signalized crossing of a collector at a minor street if often limited to peak traffic times. A full signal would have the unintended consequence of unnecessarily delaying bicyclists wishing to cross the collector during off-peak conditions as well as motorists on the main street, who would have to wait through an otherwise unnecessary full signal cycle.
88 “The three devices designated as red signal or beacon had statistically similar mean compliance rates. These devices include the midblock signal, half signal, and HAWK signal beacon. All three devices had average compliance rates greater than 97 percent.”
“A compliance rate above 94 percent exists, regardless of the number of lanes on the facility.”
FITZPATRICK, K., TURNER, S., BREWER, M., CARLSON, P., LALANI, N., ULLMAN, B., TROUT, N., PARK, E.S., LORD, D., AND WHITACRE, J. (2006). IMPROVING PEDESTRIAN SAFETY AT UNSIGNALIZED CROSSINGS. TCRP/NCHRP REPORT 112/ 562, TRANSPORTATION RESEARCH BOARD, WASHINGTON, DC.
89 For roads with speeds less than 35 miles per hour ( MUTCD Figure 4F-1):

For roads with speeds greater than 35 miles per hour ( MUTCD Figure 4F-2):

FEDERAL HIGHWAY ADMINISTRATION. (2009). MANUAL ON UNIFORM TRAFFIC CONTROL DEVICES.
90 FEDERAL HIGHWAY ADMINISTRATION. (2009). MANUAL ON UNIFORM TRAFFIC CONTROL DEVICES.
91 FEDERAL HIGHWAY ADMINISTRATION. (2009). MANUAL ON UNIFORM TRAFFIC CONTROL DEVICES.
92 The City of Madison published and distributed a brochure describing the function and operation of the Pedestrian Hybrid Beacon.
CITY OF MADISON, WISCONSIN. PEDESTRIAN & BICYCLIST HYBRID BEACON.
Signing and Marking
COLORED BIKE FACILITIES
93 “Significantly fewer bicyclists slowed or stopped when approaching the conflict areas in the after period.”
HUNTER, W.W. ET AL. (2000). EVALUATION OF BLUE BIKE-LANE TREATMENT IN PORTLAND, OREGON. TRANSPORTATION RESEARCH RECORD, 1705, 107-115.
94 “Significantly more motorists yielded to bicyclists after the blue pavement had been installed (92 percent in the after period versus 72 percent in the before period.”
HUNTER, W.W. ET AL. (2000). EVALUATION OF BLUE BIKE-LANE TREATMENT IN PORTLAND, OREGON. TRANSPORTATION RESEARCH RECORD, 1705, 107-115.
“A higher percentage of motorists yielded to bicycles in the after period (86.7% before versus 98.5% after). A chi-square test revealed the differences to be statistically significant at the 5% significance level (p < 0.001).”
WILLIAM W. HUNTER, W., SRINIVASAN, R., MARTELL, C. (2008). EVALUATION OF A GREEN BIKE LANE WEAVING AREA IN ST. PETERSBURG, FLORIDA. UNIVERSITY OF NORTH CAROLINA HIGHWAY SAFETY RESEARCH CENTER.
“The proportion of yielding events that were resolved by the motorist yielding to the bicyclist increased from 63% to 78% after the colored lane treatment was installed. Additionally, the proportion of motorists who used a turn signal before crossing the conflict zone when a bicyclist was present increased significantly from 38% to 74% after the colored lane treatment.”
BRADY, J., MILLS, A., LOSKORN, J., DUTHIE, J., MACHEMEHL, R., CENTER FOR TRANSPORTATION RESEARCH. (2010). EFFECTS OF COLORED LANE MARKINGS ON BICYCLIST AND MOTORIST BEHAVIOR AT CONFLICT AREAS. CITY OF AUSTIN, TEXAS.
95 “Overall, more cyclists followed the recommended path after the blue marking: 87 percent before versus 94 percent after.”
BIRK, M., BURCHFIELD, R., FLECKER, J., HUNTER, W.W., HARKEY, D.L., AND STEWART, J.R. (1999). PORTLAND’S BLUE BIKE LANES: IMPROVED SAFETY THROUGH ENHANCED VISIBILITY. CITY OF PORTLAND OFFICE OF TRANSPORTATION.
96 “NYCDOT data indicates that the green paint treatment resulted in fewer instances of drivers encroaching on the bike lane by driving on the bike lane boundary line. Overall, 7% of drivers on the green paint treated streets drove on the bike lane boundary line as opposed to 16% of drivers on streets with the typical non-painted bike lane treatment. The data also showed fewer instances in driving in the bike lane; on average, 4% of drivers drove in the bike lane on green paint treated streets as opposed to 7% of typical streets.”
NEW YORK CITY DEPARTMENT OF TRANSPORTATION. (2011). EVALUATION OF SOLID GREEN BICYCLE LANES, TO INCREASE COMPLIANCE AND BICYCLE SAFETY.
97 Yellow, white, red, blue, and purple all have defined standard uses in the MUTCD. Blue is specifically discouraged for use on bicycle lanes to prevent confusion with parking for persons with disabilities.
“When used, blue markings shall supplement white markings for parking spaces for persons with disabilities.”
FEDERAL HIGHWAY ADMINISTRATION. (2009). MANUAL ON UNIFORM TRAFFIC CONTROL DEVICES. SECTION 3A.05.
98 “Significantly more motorists yielded to bicyclists after the blue pavement had been installed (92 percent in the after period versus 72 percent in the before period).”
HUNTER, W.W. ET AL. (2000). EVALUATION OF BLUE BIKE-LANE TREATMENT IN PORTLAND, OREGON. TRANSPORTATION RESEARCH RECORD, 1705, 107-115.
“Bicyclists familiar with more traditional sharrows have noted that the additional emphasis resulting from the green pavement paint appears to be creating an heightened awareness by the motorists in the lane.”
CITY OF LONG BEACH. (2010). FINAL REPORT: SECOND STREET SHARROWS AND GREEN LANE IN THE CITY OF LONG BEACH, CALIFORNIA (RTE 9-113E).
99 Variant of MUTCD R10-15 to include helmeted bicycle rider symbol (MUTCD figure 9C-3 B). Alternate sign in common use, similar to MUTCD R1-5, 1-5a.
100 The City of San Francisco is currently experimenting with dashed green bicycle lanes.
THE CITY AND COUNTY OF SAN FRANCISCO. (2010). EVALUATION OF SOLID AND DASHED GREEN PAVEMENT FOR BICYCLE LANES.
101 “NYCDOT data indicates that the green paint treatment resulted in fewer instances of drivers encroaching on the bike lane by driving on the bike lane boundary line. Overall, 7% of drivers on the green paint treated streets drove on the bike lane boundary line as opposed to 16% of drivers on streets with the typical non-painted bike lane treatment. The data also showed fewer instances in driving in the bike lane; on average, 4% of drivers drove in the bike lane on green paint treated streets as opposed to 7% of typical streets.”
NEW YORK CITY DEPARTMENT OF TRANSPORTATION. (2011). EVALUATION OF SOLID GREEN BICYCLE LANES, TO INCREASE COMPLIANCE AND BICYCLE SAFETY.
102 Salt Lake City, UT, and Long Beach, CA, have used a carpet of green coloring to create a lane-within-a-lane to indicate the priority area and preferred riding placement for bicyclists.
“THE GREEN LANE FACILITY HAS APPEARED TO RESULT IN AN APPROXIMATE DOUBLING OF USAGE OVER THE FIRST 12 MONTHS OF EXISTENCE.”
“Bicyclists familiar with more traditional sharrows have noted that the additional emphasis resulting from the green pavement paint appears to be creating an heightened awareness by the motorists in the lane.”
CITY OF LONG BEACH. (2010). FINAL REPORT: SECOND STREET SHARROWS AND GREEN LANE IN THE CITY OF LONG BEACH, CALIFORNIA (RTE 9-113E).
In an evaluation of a lane-within-a-lane treatment in Salt Lake City, researchers found that “eleven months after implementation, the fraction of in-street cyclists riding in the preferred zone, at least 4 ft from the curb, had risen from 17% to 92%.”
FURTH, P., DULASKI, D. M., BERGENTHAL, D., BROWN, S. (2011). MORE THAN SHARROWS: LANE-WITHIN-A-LANE BICYCLE PRIORITY TREATMENTS IN THREE U.S. CITIES. PRESENTED AT THE 2011 ANNUAL MEETING OF THE TRANSPORTATION RESEARCH BOARD.
SHARED LANE MARKINGS
103 “The average distance bicyclists rode from the edge of the lane (called lateral position) increased only marginally, usually between four and eight inches, but a large shift in the mode occurred along multiple sites—at least three feet in many cases.”
THE CENTER FOR TRANSPORTATION RESEARCH, THE UNIVERSITY OF TEXAS AT AUSTIN. (2010). EFFECTS OF SHARED LANE MARKINGS ON BICYCLIST AND MOTORIST BEHAVIOR ALONG MULTI-LANE FACILITIES.
104 “Along Dean Keeton Street, where bicyclists rode along side on-street parked vehicles, the marginal increase in lateral position resulted in a significant decrease in the percentage of bicyclists who rode within the range of an opening car door.”
THE CENTER FOR TRANSPORTATION RESEARCH, THE UNIVERSITY OF TEXAS AT AUSTIN. (2010). EFFECTS OF SHARED LANE MARKINGS ON BICYCLIST AND MOTORIST BEHAVIOR ALONG MULTI-LANE FACILITIES.
“Overall, the presence of a marking increased the distance of cyclists to parked cars by 8 inches.”
“When passing vehicles were present, the markings caused an increase of 3 to 4 inches in the distance between cyclists and parked cars. In addition, the markings caused an increase of over 2 feet in the distance between cyclists and passing vehicles.
The bike-and-chevron had a greater effect (by 3 inches) on the distance between cyclists and passing vehicles.”
SAN FRANCISCO DEPARTMENT OF PARKING AND TRAFFIC. (2004). SAN FRANCISCO’S SHARED LANE PAVEMENT MARKINGS: IMPROVING BICYCLE SAFETY.
In the Cambridge, MA, study, the percentage of bicyclists who rode within 40 inches (i.e., near the door zone) of parked motor vehicles decreased.
FEDERAL HIGHWAY ADMINISTRATION. (2010). EVALUATION OF SHARED LANE MARKINGS. FHWA-HRT-10-041.
105 “Regarding motorist behavior, motorists were more likely to change lanes when passing, less likely to pass, and less likely to encroach on the adjacent lane when passing, all of which indicate safer motorist behavior.”
THE CENTER FOR TRANSPORTATION RESEARCH, THE UNIVERSITY OF TEXAS AT AUSTIN. (2010). EFFECTS OF SHARED LANE MARKINGS ON BICYCLIST AND MOTORIST BEHAVIOR ALONG MULTI-LANE FACILITIES.
In the Chapel Hill, NC, experiment, motorists moved away from the markings, providing more operating space for bicyclists.
FEDERAL HIGHWAY ADMINISTRATION. (2010). EVALUATION OF SHARED LANE MARKINGS. FHWA-HRT-10-041.
106 “Both the markings significantly reduced the number of sidewalk riders: the bike-and-chevron by 35% and the bike-in house by 25%.”
SAN FRANCISCO DEPARTMENT OF PARKING AND TRAFFIC. (2004). SAN FRANCISCO’S SHARED LANE PAVEMENT MARKINGS: IMPROVING BICYCLE SAFETY.
“Before the arrow was placed, 39.3% of bicyclists rode in street, with traffic [versus on sidewalk.] After the arrow was placed, the proportion of bicyclists riding in street with traffic increased to 45.3%.”
PEIN, W.E., HUNTER, W.W., AND STEWART, J.R. (1999). EVALUATION OF THE SHARED-USE ARROW. FLORIDA DEPARTMENT OF TRANSPORTATION,TALLAHASSEE, FL.
107 “The bike-and-chevron marking significantly reduced the number of wrong-way riders by 80%. The bike-in-house marking did not have any significant impact on the percentage of wrong-way riders.”
SAN FRANCISCO DEPARTMENT OF PARKING AND TRAFFIC. (2004). SAN FRANCISCO’S SHARED LANE PAVEMENT MARKINGS: IMPROVING BICYCLE SAFETY.
108 “The complexity of vehicle interactions within a roundabout leaves a cyclist vulnerable, and for this reason, bike lanes within the circulatory roadway should never be used.”
US DEPARTMENT OF TRANSPORTATION. (2000). ROUNDABOUTS: AN INFORMATIONAL GUIDE. FHWA-RD-00-067.
109 “The Shared Lane Marking should not be placed on roadways that have a speed limit above 35 mph.”
FEDERAL HIGHWAY ADMINISTRATION. (2009). MANUAL ON UNIFORM TRAFFIC CONTROL DEVICES. SECTION 9C.07 02.
The Toronto Cycling Study (2010) found that while 72.5% of all existing bicyclists are comfortable riding on major roads with bike lanes, only 54% reported feeling comfortable on major roads with sharrow markings.
CITY OF TORONTO/IPSOS REID. (2010). CITY OF TORONTO CYCLING STUDY: TRACKING REPORT (1999 AND 2009).
110 'Shared Lane Marking' Placement – Revised 5/17/2010. Added 24 ft and 26 ft street details with parking on both sides, and 20 ft street detail with parking on one side.
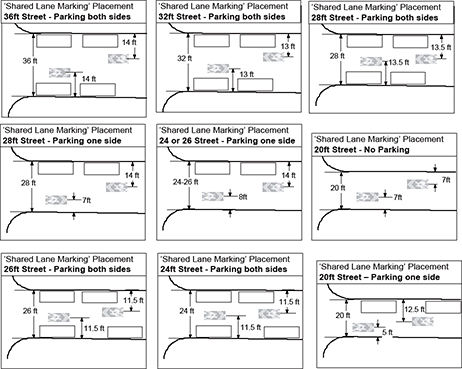
PORTLAND BUREAU OF TRANSPORTATION. (2011). WAYFINDING SHARROW GUIDELINES.
111 Placement Guidelines for San Francisco Laterally:
11' minimum with parking
11.5' general standard with parking
May increase if higher cycling speeds are expected
SFMTA. (2008). SHARED LANE MARKINGS: WHEN AND WHERE TO USE THEM. PRESENTED AT PRO WALK/PRO BIKE 2008.
If used in a shared lane with on-street parallel parking, Shared Lane Markings should be placed so that the centers of the markings are at least 11 feet from the face of the curb or from the edge of the pavement where there is no curb.
FEDERAL HIGHWAY ADMINISTRATION. (2009). MANUAL ON UNIFORM TRAFFIC CONTROL DEVICES.
112 See SFMTA. (2008). Shared Lane Markings: When and Where to Use Them. Presented at Pro Walk/Pro Bike 2008.
PORTLAND BUREAU OF TRANSPORTATION. (2011). WAYFINDING SHARROW GUIDELINES.
If used on a street without on-street parking that has an outside travel lane that is less than 14 feet wide, the centers of the Shared Lane Markings should be at least 4 feet from the face of the curb or from the edge of the pavement where there is no curb.
FEDERAL HIGHWAY ADMINISTRATION. (2009). MANUAL ON UNIFORM TRAFFIC CONTROL DEVICES.
113 Salt Lake City, UT, and Long Beach, CA, have used a carpet of green coloring to create a lane-within-a-lane to indicate the priority area and preferred riding placement for bicyclists.
“The green lane facility has appeared to result in an approximate doubling of usage over the first 12 months of existence.”
“Bicyclists familiar with more traditional sharrows have noted that the additional emphasis resulting from the green pavement paint appears to be creating an heightened awareness by the motorists in the lane.”
CITY OF LONG BEACH. (2010). FINAL REPORT: SECOND STREET SHARROWS AND GREEN LANE IN THE CITY OF LONG BEACH, CALIFORNIA. RTE 9-113E.
114 Configurations in Brookline, MA, have used dotted lines to create a lane-within-a-lane to indicate the priority area and preferred riding placement for bicyclists.
“The lane-within-a-lane treatment appears to be effective in bringing about a shift in bicyclist position away from right-side hazards.”
FURTH, P., DULASKI, D. M., BERGENTHAL, D., BROWN, S. (2011). MORE THAN SHARROWS: LANE-WITHIN-A-LANE BICYCLE PRIORITY TREATMENTS IN THREE U.S. CITIES. PRESENTED AT THE 2011 ANNUAL MEETING OF THE TRANSPORTATION RESEARCH BOARD.
BIKE ROUTE WAYFINDING
115 Figure 1: Supported Destinations

CITY OF OAKLAND. (2009). DESIGN GUIDELINES FOR BICYCLE WAYFINDING SIGNAGE.

FEDERAL HIGHWAY ADMINISTRATION. (2009). MANUAL ON UNIFORM TRAFFIC CONTROL DEVICES. FIGURE 9B-6.
117 Bike Route Guide (D11-1) signs (see Figure 9B-4) may be provided along designated bicycle routes to inform bicyclists of bicycle route direction changes and to confirm route direction, distance, and destination.
FEDERAL HIGHWAY ADMINISTRATION. (2009). MANUAL ON UNIFORM TRAFFIC CONTROL DEVICES. P. 798.
118 see note 109
119 The Clearview Hwy typeface was granted interim approval by the FHWA for use on positive contrast road signs (light text on dark background) in September 2004 based on studies showing improved legibility.
FEDERAL HIGHWAY ADMINISTRATION. (2004). INTERIM APPROVAL FOR USE OF CLEARVIEW FONT FOR POSITIVE CONTRAST LEGENDS ON GUIDE SIGNS.
120 The MUTCD defines the general meaning of 11 colors. Green is identified for use on direction guidance.
FEDERAL HIGHWAY ADMINISTRATION. (2009). MANUAL ON UNIFORM TRAFFIC CONTROL DEVICES.
Bicycle Boulevards
ROUTE PLANNING
121 Low-stress bikeways, which include cycle tracks, buffered bike lanes, and off-street paths, appeal to a wider spectrum of the population than conventional bike lanes or shared lanes along busy streets. A low-stress network should be fine-grained and many jurisdictions aim to provide a density of low-stress facilities at quarter- or half-mile intervals.
122 Intersection treatments that reduce delay can make bicycle boulevards more attractive for cut-through motor vehicle traffic, necessitating periodic monitoring of motor vehicle speeds and volumes.
123 See the U.S. Traffic Calming Manual for specific emergency-vehicle-friendly recommendations.
124 “Women and people who bicycle less frequently appear to be more concerned about bicycling on facilities with a lot of motor vehicle traffic, including bicycle lanes on major streets. Many of these bicyclists stated and revealed a preference for low-traffic streets, bicycle boulevards, and separate paths. This indicates that these types of facilities may be more effective at getting more women and infrequent or non-cyclists to ride.”
DILL, J., AND GLIEBE, J. (2008). UNDERSTANDING AND MEASURING BICYCLING BEHAVIOR: A FOCUS ON TRAVEL TIME AND ROUTE CHOICE. OREGON TRANSPORTATION RESEARCH AND EDUCATION CONSORTIUM (OTREC).
“For the typical cyclist, 1-min cycling in mixed traffic is as onerous as 4.1 min on bike lanes or 2.8 min on bike paths.”
HUNT, J.D., AND ABRAHAM, J.E. (2007). INFLUENCES ON BICYCLE USE. TRANSPORTATION 34.4: 453.
Speed management and other bicycle boulevard treatments on a street in Berkeley, California, reduced the number of automobiles by almost 20 percent, while the number of bicyclists and pedestrians increased by 83 percent and 87 percent, respectively.
BOUAOUINA AND ROBINSON (1990) IN EWING. (1999). TRAFFIC CALMING: STATE OF THE PRACTICE.
“Using police-reported collision data and the city’s cyclist count data, this study finds that Berkeley’s bicycle boulevards do indeed have lower collision rates for cyclists than their parallel arterial routes.”
MINIKEL, E. (2011). CYCLIST SAFETY ON BICYCLE BOULEVARDS AND PARALLEL ARTERIAL ROUTES IN BERKELEY, CALIFORNIA. ACCIDENT ANALYSIS AND PREVENTION. 45: 241-247.
125 “Most homebuyers prefer homes on streets with lower traffic volumes and speeds. For this reason homes on cul de sac streets command a price premium and new developments are being built with streets designed to control traffic.”
LITMAN, T. (1999). TRAFFIC CALMING BENEFITS, COSTS, AND EQUITY IMPACTS.
126 Portland, OR, and Albuquerque, NM, have designated lower speed limits for residential streets—20 and 18 mph, respectively—for residential streets classified as bicycle boulevards/neighborhood greenways.
SIGNS AND PAVEMENT MARKINGS
127 Portland, OR, Madison, WI, Nampa, ID, and Wilmington, NC, use standard shared lane markings on their neighborhood greenways/bicycle boulevards. Tacoma, WA, is adjusting the standard marking to include a colored flag and modified bicyclist.
128 “Center line markings should be placed on paved urban arterials and collectors that have a traveled way of 20 feet or more in width and an ADT of 4,000 vehicles per day or greater.”
“On roadways without continuous center line pavement markings, short sections may be marked with center line pavement markings to control the position of traffic at specific locations.”
FEDERAL HIGHWAY ADMINISTRATION. (2009). MANUAL ON UNIFORM TRAFFIC CONTROL DEVICES. 3B.01.
129 “A pictograph (see definition in Section 1A.13) may be used on a D3-1 sign. If a pictograph is used on a D3-1 sign, the height and width of the pictograph shall not exceed the upper-case letter height of the principal legend of the sign. The pictograph should be positioned to the left of the street name.”
FEDERAL HIGHWAY ADMINISTRATION. (2009). MANUAL ON UNIFORM TRAFFIC CONTROL DEVICES. 2D.42.
130 “Parking space markings tend to prevent encroachment into fire hydrant zones, bus stops, loading zones, approaches to intersections, curb ramps, and clearance spaces for islands and other zones where parking is restricted.”
FEDERAL HIGHWAY ADMINISTRATION. (2009). MANUAL ON UNIFORM TRAFFIC CONTROL DEVICES. 3B.19.
SPEED MANAGEMENT
131 Refer to the American Planning Association (APA) U.S. Traffic Calming Manual (Ewing and Brown, 2009) and Chapter 15 of the Institute of Transportation Engineers (ITE) Traffic Engineering Handbook (2009) for detailed guidelines about speed and volume management treatments.
132 As of 2012, Oregon cities have authority to lower the speed limit on residential streets to 20 mph if the road has an average volume less than 2,000 vpd, an 85th percentile speed of less than 30 mph, and if there is a device (e.g., shared lane markings, warning signs) that indicates the presence of bicyclists or pedestrians. City of Portland staff intend to sign all residential neighborhood greenways that meet these criteria at 20 mph and have begun implementing speed management measures to create streets with target speeds of 20 mph in anticipation of the lowered speed limit.
Albuquerque, NM, signs bicycle boulevards at 18 mph but has not used speed management to reduce the streets’ speeds. Targeted enforcement is used when a bicycle boulevard first opens, and electronic speed feedback signs reinforce the speed limit to drivers.
In California, the prima facie speed limit in residential areas is 25 mph, which is the lowest speed limit allowed allowed, with specific exceptions. In order to enforce speed using a radar, a city must conduct a speed survey to justify the speed limit. Cities can post advisory speeds, such as a triangular, yellow 15 mph sign with a speed bump warning sign.
133 Speed humps should be no more than 500 feet (152 m) apart or between slow points where the desired 85th percentile operating speed is between 25 and 30 mph.
INSTITUTE OF TRANSPORTATION ENGINEERS. (2011). UPDATED GUIDELINES FOR THE DESIGN AND APPLICATION OF SPEED HUMPS AND SPEED TABLES.
“Improperly designed, speed humps and all speed bumps are dangerous for bicyclists… both 3-inch and 4-inch humps are likely to be safe for bicyclists, although the 4-inch hump should probably be used with caution where bicycle traffic is frequent or rapid. … Speed humps should be located far enough from intersections that turning cyclists are no longer leaning when they encounter the hump.”
Speed humps should be used with caution on hills where bicyclist speeds may exceed 20 mph. The City of Oakland, CA, only installs speed humps on streets with a vertical grade less than 5 percent.
DEROBERTIS, M., AND WACHTEL, A. (1996). TRAFFIC CALMING: DO’S AND DON’TS TO ENCOURAGE BICYCLING.
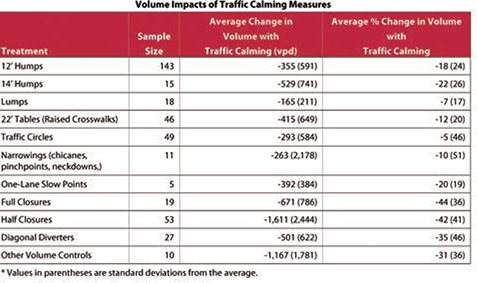
134 “Speed lumps reduce the 85th percentile speed by 25 percent, or 9 mph… The speed reduction with lumps is comparable to that with speed humps.”
Speed lumps or cushions have been found to have minimal, if any, impact to emergency vehicles in Austin, TX, and San Diego, Sacramento, and Danville, CA.
GULDEN, J., AND EWING, R. (2009). NEW TRAFFIC CALMING DEVICE OF CHOICE.
On a 36-foot wide roadway, three lumps are optimal, with a 6-foot wide center lump to minimize emergency vehicle delay and discomfort, and the outside lump widths can vary. The wheel gaps should be 1 to 2 feet wide. This configuration also allows bicyclists to pass through the speed lumps without having to leave the center of the lane; the City of Seattle marks shared lane marking arrows at the gap to guide bicyclists.
EWING, R. AND BROWN, S. (2009). U.S. TRAFFIC CALMING MANUAL.
“Speed cushions do not present any notable disadvantages for emergency vehicles.”
BERTHOD, C. (2011). TRAFFIC CALMING: SPEED HUMPS AND SPEED CUSHIONS.
Parking alongside speed lumps may be restricted to enable bicyclists to pass through the outside of the feature.
135 “After several runs, it was decided that the distance between the two lane bump halves needed to be at least 28 feet for the vehicle to maneuver through at or near 20 mph.”
MULDER, K. (1998). SPLIT SPEED BUMP.
136 “Granite and cobblestone finishes are not recommended [for raised crosswalks] because, although aesthetically pleasing, the surface may become slippery when wet, and may be difficult to cross for pedestrians who are visually impaired or using wheelchairs.”
PARKHILL, M., SOOKLALL, R., AND BAHAR, G. (2011). UPDATED GUIDELINES FOR THE DESIGN AND APPLICATION OF SPEED HUMPS.
Raised crosswalks are 3 inches below the level of standards sidewalks, and an accessible curb ramp should be provided, as well as a surface textural indication for pedestrians with vision impairments.
EWING, R. AND BROWN, S. (2009). U.S. TRAFFIC CALMING MANUAL.
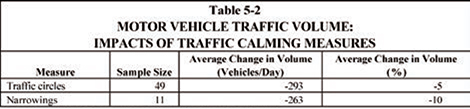
137 The number of automobile accidents at intersections [with traffic circles] fell 94 percent… Accident reduction was also found in subsequent years.
MUNDELL, J. (NO DATE). NEIGHBORHOOD TRAFFIC CIRCLES.
Neighborhood traffic circles can include a paved apron or mountable curb to accommodate the turning radii of larger vehicles like fire trucks or school buses. Larger circles should include splitter islands at the approaches. Vehicles over 22 feet may be allowed to turn left in front of traffic circles in some states; others expressly prohibit this movement.
Traffic circles at T-intersections should include curb extensions before and after the intersection or use curb indentation at the top of the T to provide the same deflection benefits as at 4-way intersections.
EWING, R. AND BROWN, S. (2009). U.S. TRAFFIC CALMING MANUAL.
The circle should be landscaped to attract attention and for aesthetic reasons; trees should have clear stem heights of at least 8 feet and be no more than 4 inches in diameter, while other plantings should be no more than 2 feet high.
Stop signs may be used in conjunction with traffic circles, but are not mandatory.
Some jurisdictions use yield signs, while others discourage use of both stop and yield.
138 Curb extensions and edge islands should be tapered at 45 degrees to reinforce the edge lines and should use plantings to increase their visibility.
Edge lines should be marked to designate the travel lane.
A landscaped center island may be used to separate opposing traffic and discourage drivers from crossing the centerline.
On narrow streets with low parking turnover, parking bays may be used to create the lateral shift.
139 Pinchpoints should provide a clear two-way travel path of less than 18 feet (12 feet recommended).
CURB EXTENSIONS AND EDGE ISLANDS SHOULD BE TAPERED AT 45 DEGREES TO REINFORCE THE EDGE LINES AND USE PLANTINGS TO INCREASE THEIR VISIBILITY.
140 The curb radius of neckdowns on local streets should be approximately 20 feet.
Stop lines on side streets may be set back from intersections such that turning trucks can briefly cross into the opposing lane.
141 Center island narrowings should be large enough to command attention—at least 6 feet wide and 20 feet long.
EWING, R. AND BROWN, S. (2009). U.S. TRAFFIC CALMING MANUAL.
In addition to the above retrofit treatments that narrow a street, some jurisdictions are building skinny streets or queuing streets, which are between 20 and 28 feet wide (with parking).
On-street parking should be prohibited within 20 to 50 feet of the right-hand side of intersections to accommodate turning movements and increase visibility.
142 On-street parking should be prohibited within 20 to 50 feet of the right-hand side of intersections to accommodate turning movements and increase visibility.
Seattle’s standard, low-volume, non-arterial streets are 25 feet wide when parking is allowed on both sides.

U.S. TRAFFIC CALMING MANUAL. EWING, 2009: 63.
144 “The average risk of severe injury for a pedestrian struck by a vehicle reaches 10% at an impact speed of 16 mph, 25% at 23 mph, 50% at 31 mph, 75% at 39 mph, and 90% at 46 mph.”
AAA FOUNDATION FOR TRAFFIC SAFETY. (2011). IMPACT SPEED AND A PEDESTRIAN’S RISK OF SEVERE INJURY OR DEATH.
145 In general, a speed differential between motor vehicles and cyclists of no more than approximately 15 mph is desirable. [Note: this refers to the difference between a person on a bicycle traveling at 10 mph and a motorist at 25 mph. Smaller differential is desirable.]
ALTA PLANNING + DESIGN AND PORTLAND STATE UNIVERSITY INITIATIVE FOR BICYCLE AND PEDESTRIAN INNOVATION. (2009). BICYCLE BOULEVARD PLANNING & DESIGN GUIDEBOOK.
146 Emergency-vehicle-friendly treatments can include 22-foot speed humps, split humps (laterally offset speed tables), speed lumps/cushions (which have a gap that accommodates emergency vehicles’ wheels), or speed humps with a configuration of three lumps with a six-foot-wide center lump with one or two foot wheel gaps.
EWING, R. AND BROWN, S. (2009). U.S. TRAFFIC CALMING MANUAL.
147 For a maneuverability test, cones are placed in the street to model the proposed dimensions of the treatments or street reconfiguration. Typical emergency response vehicles are then driven through the area, using every possible turning movement. Travel time tests should be discouraged. Research has shown a large variance between speeds with simulated devices (represented by cones) and actual devices as constructed.
EWING, R. AND BROWN, S. (2009). U.S. TRAFFIC CALMING MANUAL.
BERKELEY BICYCLE BOULEVARD DESIGN TOOLS AND GUIDELINES (APRIL 2000).
149 Speeds increase about 0.5 to 1.0 mph for every 100 feet of separation for hump spacing up to 1,000 feet.
EWING, R. (1999.) TRAFFIC CALMING: STATE OF THE PRACTICE. INSTITUTE OF TRANSPORTATION ENGINEERS.
150 “In 92% of cases where the measure is permanent, it remains as effective at slowing speeds in the winter as in the summer. In 79% of cases, there was no deterioration resulting from winter conditions or snow removal. In 71% of cases, snow removal did not pose any problems. … A sinusoidal shape is preferred over a circular or parabolic shape because it provides a more gentle transition and is easier for winter maintenance operators and cyclists to negotiate.”
BERTHOD, C. (2011). TRAFFIC CALMING: SPEED HUMPS AND SPEED CUSHIONS.
VOLUME MANAGEMENT
151 On a 20 mph street with 1,000 vpd, a cyclist traveling at 12 mph during peak hour would be passed by a car traveling in the same direction approximately every 86 seconds (assuming peak hour is 15 percent of vpd, the street is two-way with 70% of traffic volumes traveling in the peak direction, and cars are evenly spaced along the street). By comparison, at 3,000 vpd, a bicyclist would be passed by a car every 29 seconds, and at 5,000 vpd, a bicyclist would be passed by a car every 17 seconds.
152 Diagonal diverters should provide a 6- to 10-foot refuge area for crossing bicyclists to wait for a gap in traffic, which is forced to turn across the feature.
U.S. TRAFFIC CALMING MANUAL. EWING, 2009: 63.
154 FEDERAL HIGHWAY ADMINISTRATION. (2009). MANUAL ON UNIFORM TRAFFIC CONTROL DEVICES. SECTION 2B.18.
155 “Channelizing devices, as described in Sections 6F.63 through 6F.73, and 6F.75, and as shown in Figure 6F-7, such as cones, tubular markers, vertical panels, drums, lane separators, and raised islands, may be used for general traffic control purposes such as adding emphasis to reversible lane delineation, channelizing lines, or islands. Channelizing devices may also be used along a center line to preclude turns or along lane lines to preclude lane changing, as determined by engineering judgment”
FEDERAL HIGHWAY ADMINISTRATION. (2009). MANUAL ON UNIFORM TRAFFIC CONTROL DEVICES. 3H.01.
156 The threshold can consider total traffic volume; an increase of over 400 vpd on a local street may be unacceptable, and the resulting traffic volume on any local street should not exceed 3,000 vpd.
CITY OF PORTLAND. (2011). IMPACT THRESHOLD CURVE.
MINOR STREET CROSSINGS
157 “A typical bicycle trip of 30 minutes is increased by 33% to 40 minutes if there is a STOP sign at every block.”
CITY OF BERKELEY. (2000). BICYCLE BOULEVARD DESIGN TOOLS AND GUIDELINES.
“A cyclist who rolls through a stop at 5 mph needs 25 percent less energy to get back to 10 mph than does a cyclist who comes to a complete stop.”
FAJANS, J., AND M. CURRY. (2001). WHY BICYCLISTS HATE STOP SIGNS. ACCESS. 18:28-31.
158 “The use of YIELD or STOP signs should be considered at the intersection of two minor streets or local roads where the intersection has more than three approaches and where one or more of the following conditions exist:
A. The combined vehicular, bicycle, and pedestrian volume entering the intersection from all approaches averages more than 2,000 units per day;
B. The ability to see conflicting traffic on an approach is not sufficient to allow a road user to stop or yield in compliance with the normal right-of-way rule if such stopping or yielding is necessary; and/or
C. Crash records indicate that five or more crashes that involve the failure to yield the right-of-way at the intersection under the normal right-of-way rule have been reported within a 3-year period, or that three or more such crashes have been reported within a 2-year period.”
“A YIELD or STOP sign should not be installed on the higher volume roadway unless justified by an engineering study. …The following are considerations that might influence the decision regarding the appropriate roadway upon which to install a YIELD or STOP sign where two roadways with relatively equal volumes and/or characteristics intersect:
A. Controlling the direction that conflicts the most with established pedestrian crossing activity or school walking routes*;
B. Controlling the direction that has obscured vision, dips, or bumps that already require drivers to use lower operating speeds; and
C. Controlling the direction that has the best sight distance from a controlled position to observe conflicting traffic.”
*Note: this should extend to bicycle crossings as well.
FEDERAL HIGHWAY ADMINISTRATION. (2009). MANUAL ON UNIFORM TRAFFIC CONTROL DEVICES. 2B.04.
MAJOR STREET CROSSINGS
159 See National Cooperative Highway Research Program Report # 562 Improving Pedestrian Safety at Unsignalized Crossings (2006) for guidance on when to use crosswalks, active or enhanced treatments, or beacons and signals. The future expected volume of bicyclists and pedestrians should be used in the analysis to determine the appropriate crossing treatment that will encourage use of the corridor.
160 Vehicular traffic warning signs may be used to alert road users to locations where unexpected entries into the roadway [or shared use of the roadway by pedestrians, animals, and other crossing activities] might occur. When used in advance of a crossing, non-vehicular warning signs may be supplemented with supplemental plaques with the legend AHEAD, XX FEET, or NEXT XX MILES to provide advance notice to road users of crossing activity.
FEDERAL HIGHWAY ADMINISTRATION. (2009). MANUAL ON UNIFORM TRAFFIC CONTROL DEVICES. 2C.48.
161 This is a variation of a staggered stop line.
Option: Stop and yield lines may be staggered “longitudinally on a lane-by-lane basis (see Drawing D of Figure 3B-13).
Support: Staggered stop lines and staggered yield lines can improve the driver’s view of pedestrians, provide better sight distance for turning vehicles, and increase the turning radius for left-turning vehicles.”
FEDERAL HIGHWAY ADMINISTRATION. (2009). MANUAL ON UNIFORM TRAFFIC CONTROL DEVICES. SECTION 3B.16
162 This application [of a hybrid beacon] provides a pedestrian crossing without signal control for the side street because signal control on the side street can encourage unwanted additional traffic through the neighborhood.
FEDERAL HIGHWAY ADMINISTRATION. (2010). SAFETY EFFECTIVENESS OF THE HAWK PEDESTRIAN CROSSING TREATMENT. FHWA-HRT-10-042.
163 Bicyclist gaps can be estimated by modifying guidance from National Cooperative Highway Research Program Report # 562 Improving Pedestrian Safety at Unsignalized Crossings (2006) using crossing distance and bicyclist start-up and clearance speed (assume a start-up time of 6 seconds, a speed of 10 mph or below, and a clearance interval of 6 feet). Bicycle boulevards should assume a high number of bicyclists and pedestrians, rather than relying on counts which indicate existing use rather than potential use after the facility has been improved.
Recommended treatments for pedestrian crossings are designed to improve visibility and encourage motorists to stop for pedestrians; with engineering judgment many of the same treatments are appropriate for use along bicycle boulevards.
NATIONAL COOPERATIVE HIGHWAY RESEARCH PROGRAM (NCHRP). (2006). REPORT # 562 IMPROVING PEDESTRIAN SAFETY AT UNSIGNALIZED CROSSINGS.
OFFSET INTERSECTIONS
164 Each bicycle left-turn lane should be at least 4 feet wide (total width of 8 feet), with 6 feet preferred (total width of 12 feet).
This treatment is appropriate for relatively short jogs.
HENDRIX, MICHAEL. (2007). RESPONDING TO THE CHALLENGES OF BICYCLE CROSSINGS AT OFFSET INTERSECTIONS. THIRD URBAN STREET SYMPOSIUM.
This treatment is not appropriate if the cross street has more than one lane per direction or has a posted speed above 30 mph.
A raised median with a small opening for bikes may be used to prohibit motor vehicles from continuing on the bicycle boulevard or turning left from the cross street.
Green coloration may be used in the bike lane area to improve its visibility, as well as median islands at either end for protection from motor vehicle traffic.
165 A refuge island may be provided to make a two-step crossing for path users at a complex crossing.
AMERICAN ASSOCIATION OF STATE HIGHWAY AND TRANSPORTATION OFFICIALS (AASHTO). (1999). GUIDE FOR THE DEVELOPMENT OF BICYCLE FACILITIES.
GREEN INFRASTRUCTURE
166 Facilities that filter stormwater through vegetation and soil have been shown to reduce total suspended solids (TSS) by 90%, organic pollutants/oils by 90%, and heavy metals by more than 90%.
UNITED STATES ENVIRONMENTAL PROTECTION AGENCY. (1999). STORM WATER TECHNOLOGY FACT SHEET: BIORETENTION.