The data used for this book have been developed as part of the Data on International Election Monitoring (DIEM) Project.1 The project began as an effort to study international election monitoring by gathering and quantifying the content of official documents from election monitoring organizations around the world for as far back as possible. All in all, the project coded more than forty thousand pages of election monitoring documents, such as reports, press releases, and interim statements from monitoring missions. These documents provide the formal record of the experiences and conclusions of election monitors and their coding allows for statistical analysis of what would otherwise be an insurmountable amount of information.
The documents produced by international election observers often provide detailed firsthand records of observation during elections, yet most scholars had ignored these documents and organizations themselves had often had found little purpose for them as time passed. Therefore many organizations had not retained their documents, and had not even kept a record of past missions. When the project started, information on organizational websites was often very spotty and often inconsistent. Some organizations, such as the Commonwealth Secretariat (CS), had kept impeccable records and even published their reports with full ISBN numbers so that they could be retrieved through any library system. Other organizations such as the European Union (EU) had not centralized their information at all, and records of many election monitoring missions from the 1990s were difficult or impossible to locate, as no central agency had at that time housed the election observation function. The Organization of American States (OAS) had likewise been conducting missions since the early 1970s, but many of the reports were often impossible to locate, even if it was possible to find the document ID numbers. Eventually the OAS library assisted in assembling a portion of the documents. Locating reports by the Council of Europe (COE) required extensive searching as there was no list of the document titles or number to be found anywhere, and the searches were therefore mostly long hit or miss efforts. Contact with the Organization for Security and Co-operation in Europe (OSCE) office revealed that nobody had ever requested most of the reports issued before 1995, but that they were indeed sitting in a file cabinet somewhere, and were subsequently digitized. After extensive digging, the project was able to identify 903 monitoring missions2 and locate a final post-election statement or report for 673 of these missions, that is, for about three-quarters of all missions. However, the missing reports tended to be from a few organizations such as the African Union (AU)/Organisation of African Unity (OAU), the United Nations (UN), and the Economic Community of West African States (ECOWAS). For example, the AU/OAU maintained no accessible records and it is not clear whether reports were ever issued for most of the older missions.
QED, the Quality of Elections Data, was developed to make it possible to compare the quality of monitored and nonmonitored elections. To maximize the comparability of the datasets, the data cover a subset of the same variables as DIEM. QED is based on coding of more than four thousand pages of reports from the U.S. State Department on Human Rights Practices, paying particular attention to the section on the rights of citizens to choose their government, which discusses the quality of elections. Other parts of the reports were also read for additional information. The information in the U.S. State Department reports was in most instances less detailed than in the election monitoring reports. Because the State Department reports do not go back all the way to 1975 and in the early years did not cover all countries, the data cover 1,206 elections.
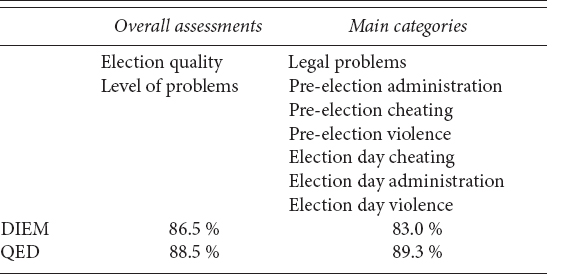
To code each individual report, graduate and undergraduate students worked in pairs, such that two people coded all reports, at least one of which was a doctoral student. The coders were trained extensively through the coding and discussion of numerous test-documents and their instructions are posted on the project website.3 Most of the coding occurred in a full-time work setting where coders were working in the same room. After each coder independently coded all materials for a set of elections, any differences were reconciled, if necessary with the help of the principal investigator. To get an impression of how consistent the coders were before reconciling, each dataset contains measures of intercoder reliability prior to reconciliation. As Table A.1 shows, agreement ranged from 83.0 to 89.3 percent.
TABLE A.1
Average intercoder reliability scores
For discussion of the main categories, see the section on variables, below. The scores calculate the average agreement for each level of election quality variable. For example, if, for a given report, the two coders had identical codings for five of the seven main categories, the value of the intercoder reliability score for that election for the main categories would be 5/7 = 71.4 percent.
Chapter 4 discussed the possible biases of the election monitoring reports extensively. However, because the QED is based on reports produced by a U.S. agency, it may also contain some bias. Bias is important for analysis mostly when it coincides with the claims being analyzed and therefore could distort the conclusions. The U.S. State Department reports are clearly not entirely objective sources, but they are consistent and replicable, and the bias can be understood. Importantly, there is no reason to think the bias systematically aligns with the inquiry so as to cause spurious findings. Thus, in the case of the QED data, election monitors would have to be more likely to go to countries toward which the U.S. State Department reports are also likely to be less critical and the monitors would then also have to cater to the United States in dampening their criticisms. This is theoretically conceivable, but not likely to be a trend that is so prevalent as to influence the analysis heavily. This is particularly so, because, as discussed below, several of the possible biases are actually more likely to make it harder to establish a positive effect of monitoring on election quality.
The U.S. State Department reports were first issued in the mid-1970s for a limited number of countries. However, already by 1980 they were quite extensive and reliable. Criticisms of U.S. allies are quite common even in early reports.4 The U.S. reports also quickly grew more detailed. The latest reports are on average about four times longer than the very earliest reports. Because longer reports also correlate with harsher assessments and the time trend also correlates with the rise of international election monitoring, monitored elections could have longer reports and therefore harsher assessments. Similarly, State Department reports also often incorporate information from monitoring missions, and may therefore have greater details about monitored missions, which again may make these appear more problematic. Another concern is that some cheating is overlooked, not necessarily because it is by definition undetectable, but rather because the resources applied to its discovery are limited. Although some cheating is surely overlooked, it is just as likely or perhaps even more likely to occur when monitors are absent than when they are present. All of these possible biases, if anything, make it harder to find a positive relationship between monitors and election quality.
The year 1975 was chosen as a start year for the data to include several years before election monitoring became common. Given the many other forms of data that would be needed for the project, going back even farther would only introduce a lot of missing data. As the project coding and data collection process began in 2004, this was chosen as the end year for the quantitative data. Thus, the data covers thirty years of national elections, from 1975 to 2004.
One of the first tasks of the project was to compile a list of national-level legislative and executive elections since 1975 as it turned out existing data were very incomplete. During this study’s span the 182 countries included in the data held 1,324 elections, of which 442 were monitored by at least one of the organizations included in this study.
The variables in the data fall into four categories: (1) election quality, (2) election attributes other than quality, (3) mission attributes, and (4) country attributes. These are organized in the four tables below. Most variables are described briefly in the tables, but a discussion of select variables follows.
It is crucial to stress that the assessments of election quality are not objective and true measures of election quality. Rather, they are quantifications of the opinions stated by the sources. That is, in DIEM, the variables quantify the assessment of the individual international observer group. In QED, the variables quantify the assessment of the U.S. State Department. These measures are proxies for actual election quality.
There is an extensive debate about how to measure election quality. This project does not resolve that debate, but simply provides details on a number of subcomponents of elections as reported by the sources. However, some decisions were nevertheless necessary to create the categories and rules for coding. Indeed, hundreds of categories could easily have been created and would have made coding simpler in some ways, but use of the data too unruly. Thus, simplifying rules was a necessary evil. To establish the categories for coding, this project drew on several detailed and careful academic works about the nature of election irregularities.5 In addition the project also drew on organizational documents about electoral standards,6 and treaty standards, many of which are elaborated in an extensive compendium compiled by the EU.7
The coding of the QED variables and the DIEM variables follows the same conceptualization, but there are differences. The overall assessment variables have different analytical goals, and they therefore use their sources differently, as discussed below.
These measures are used in the analysis in Chapter 4. The purpose of these variables is to capture the opinion of the organization as it chooses to express it immediately after the election. Usually right after an election, each organization issues a summary statement, called a post-election statement, a preliminary statement, or simply a press release. These are followed by a longer and much more detailed reports issued months later. The executive summary or conclusion of the final report typically repeats the summary assessments rendered immediately after the election, but the report’s content differs from the executive summary or conclusion by providing not only greater details, but often more critical remarks. However, by the time the longer report comes out attention to the election has faded, and the details in the reports usually escape attention. Thus, the world primarily hears the statements made shortly after the polling or the overall assessment that is usually repeated in the executive summary or conclusion of the final report. Therefore, the dependent variable is the overall summary assessment of an election by an individual monitoring organization. The DIEM overall summary of the election quality variable as well as the DIEM level of problems variables is based exclusively on press statements, preliminary statements, the introduction/executive summary, or conclusion of the report only, and not on the content of the body of the report. Coders were not allowed to read the body of the report until they had already coded the summary assessment.
These measures are used in the analysis in Chapter 7. The measure of election quality in the QED is not intended to capture how an organization may spin its opinion immediately after an election. The reports are all written at the conclusion of the calendar year. The purpose of these measures is instead to find as accurate as possible a measure of how good the election actually was. This measure is therefore based on the entire content of the State Department Report on Human Rights Practices, paying particular attention to the introduction, the section on political freedoms, and the section on the rights of citizens to choose their government. The overall assessment measure captures whether the State Department report, notwithstanding the level of problems, considered the election acceptable. Thus it is possible for an election to have a lot of problems, yet for the State Department to conclude that it was nonetheless acceptable, or, conversely, for the election itself to proceed with fewer problems, yet for the State Department to consider it unacceptable, perhaps because of major flaws in the legal framework. The level of problems is coded separately, ranging from none to major.
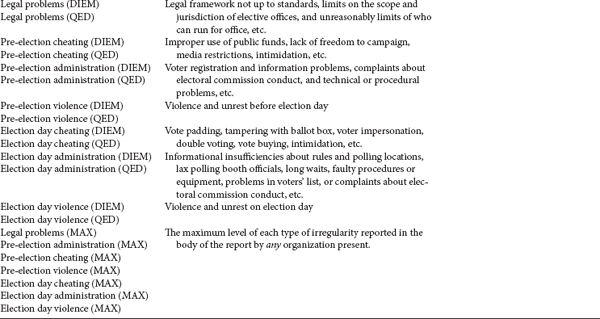
These main categories were used in Chapter 5, and to create the MAX variables discussed below. Types of irregularity are based on a number of subcategories as shown in Table A.2. In the DIEM dataset, these subcomponents were actually created, but in QED the information was usually too scarce to allow coding of these. The subcomponents coded for DIEM were not used in the analysis in this book. However, their coding was an important part of ensuring that the main categories were systematically assessed. More information on the subcategories can be found on the project webpage. The main categories were not in any way an index created based on the subcomponents, as these cannot simply be aggregated or weighted in a consistent way. Therefore the subcategories informed the coders as they coded the main categories, but the coders were asked to make an assessment of the level of the main categories as a separate judgment. In DIEM, the subcomponents were used to flag data entry errors.
TABLE A.2
Main categories of variables
Main categories |
Subcomponents |
Pre-election administration |
Problems in voter lists/registration Complaints about electoral commission conduct Voter information and procedural problems Technical/procedural difficulties |
Election day administration |
Informational insufficiencies and confusion Administrative insufficiencies Problems in voter lists Complaints about electoral commission on election day |
Legal problems |
Deficiencies in legal framework Limits to scope and jurisdiction of elective offices Unreasonable limits of who can run for office |
Pre-election cheating |
Improper use of public funds Restrictions on freedom to campaign Restrictions on media Intimidation |
Election day cheating |
Vote processing and tabulation tampering Voter fraud Intimidation on election day |
Pre-election violence |
Physical violence and unrest before election day |
Election day violence |
Physical violence and unrest on election day |
This measure is used in the analysis in Chapter 4. The MAX variables take advantage of the fact that more than one organization was present in nearly three-quarters of the elections. For each election new variables were generated based on the maximum level of each type of irregularity reported in the body of the report by any organization present. For example, if three missions visited a given election and coded the level of election day cheating as 2, 2, and 3, respectively, then the election day cheating (MAX) would equal 3. This produces a more comprehensive measure of what the election was actually like and what the monitoring organizations may reasonably have seen or have heard other organizations report.
TABLE A.3
Election quality variables
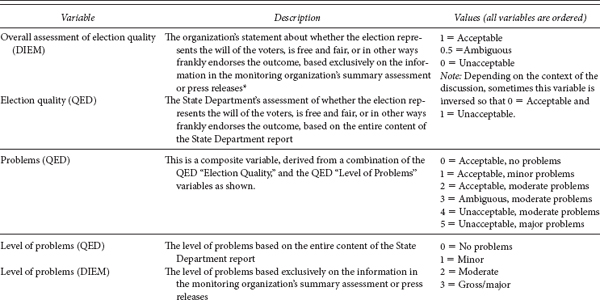
Sources: QED, U.S. State Department data; DIEM, the election monitoring report; MAX, see discussion above.
* For an extensive discussion of the reasoning behind this coding, see the introduction to Chapter 4.
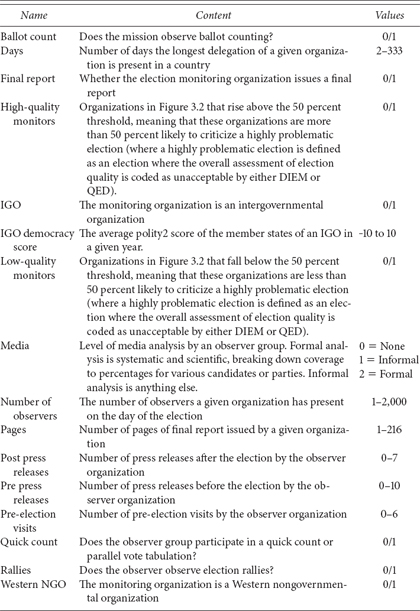
TABLE A.4
Election attributes other than quality

Sources: Election monitoring reports, U.S. State Department Reports, SIPRI’s conflict data (http://www.pcr.uu.se/research/UCDP/index.htm., last accessed May 13, 2009), the Archigos dataset on the survival of leaders (thanks to Hein Goemans for providing early access to this data; see http://mail.rochester.edu/~hgoemans/data.htm, last accessed February 1, 2010), the Database on African Elections (African Elections Database undated), and comprehensive election information sources, most notably the Parline data base of the International Parliamentary Union (http://www.ipu.org/parline/parlinesearch.asp, last accessed May 13, 2009), Electionworld, which now resides on Wikipedia (http://en.wikipedia.org/wiki/User:Electionworld/Electionworld, last accessed March 1, 2010), the Lijphart Elections Archive (Lijphart undated), and extensive searches in LexisNexis.
Sources: Individual election monitoring reports.
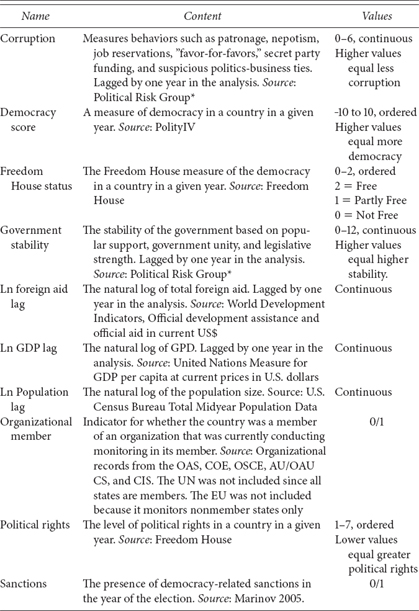
*http://www.prsgroup.com/. Last accessed May 13, 2009.
This measure is used in the analysis in Chapter 7. To establish the presence of monitors in a given election, it was often necessary to communicate directly with each organization to verify their records because final reports were often unavailable or websites provided incomplete information. Organizations sometimes posted documents that were unclear about whether organizations actually sent a delegation or made an assessment based on secondary information. Sometimes they sent only pre-election delegations but listed this as having monitored the election. Getting the record straight going back ten to fifteen years often required extensive research by the organizations in response to a request, and sometimes they corrected their websites after further research. In addition, every election in the dataset was searched in the LexisNexis database for news stories about international observers or international monitors, or the names of international monitoring organizations specifically. These stories were then read to establish whether they indicated that international observers were present. Based on this information it was possible to create a more complete record and to add a category for cases that were monitored by organizations other than those included in the study. For example, although none of the twenty-one formal organizations acted alone, monitors were coded as present in Kenya’s 1997 election because foreign donors formed an ad hoc umbrella group of observers. Although it is possible that some missions are omitted because the records have been lost, the data are as accurate as possible after extensive consultation with representatives at the respective organizations.
This measure is used in the analysis in Chapter 7. The coding of “Turnover” follows these rules:
In a parliamentary system, it is coded 0 if the incumbent prime minister or someone from the same party keeps the post of prime minister after the election.
In a presidential system it is coded 0 if there is a presidential election only and the incumbent party retains the office of the president. If there is a legislative election only, it is coded 0 if the party with the most seats before the election retains the most seats after the election. If there is a general election, it is coded 0 if the incumbent leading party in the legislature maintains its leading role and the incumbent party of the president retains its incumbency. However, because it is a presidential system, it is also coded 0 if there is a general election and the incumbent party of the president retains its incumbency, even if the legislative lead party loses its plurality.
In single-party or no-party states it is generally coded as 0. This is also true if there has been a coup since the last election and the leaders of the coup or the party of the coup leaders retain power, if someone is installed as acting president prior to the election and then wins the election, if a president’s chosen successor is elected to replace the president, or if the elected offices do not represent the true power of state, that is, Iran.
In newly independent countries it is coded as missing if the election is the first and no power-holding party was established by the time of the elections.
If an election had to be rerun, it is coded missing.
It is coded 1 otherwise, although there are some unique cases, explained further in the documentation for the variable.8
The variable is coded missing in forty-one cases, or about 3 percent of the data.