There have been many suggestions that the study of cognition and aging might be advanced by introducing personality constructs as possible covariates that might explain some proportion of age-related changes and differences in cognitive performance. In the earlier literature (cf. Mischel, 1973), it was often argued that most measures of personality traits were not sufficiently stable or did not show high enough correlations with cognitive measures to make it likely that they could account for substantial proportions of age-related variance. The former criticism has largely been addressed by more recent rigorous measurement development (e.g., Costa & McCrae, 1992), but the latter concern requires further empirical investigations.
In chapter 13, I reported our findings on age differences and age changes on the 13 personality factors that we derived from the questionnaire. We also have reported age difference and estimated longitudinal data on the NEO Personality Inventory (Costa & McCrae, 1992). In this chapter, I report analyses that speak to the influences of these personality variables in accounting for parts of the individual differences in cognitive performance (cf. Schaie, Willis, & Caskie, 2004).
Included in the analyses reported in this chapter are three different subsets from the Seattle Longitudinal Study (SLS). The first set used for the analyses of concurrent relationships between personality factors and cognitive abilities included the 1,761 participants who were assessed during the SLS seventh data collection and for whom we obtained both personality and cognitive ability scores. The second set used for the longitudinal analyses included the 1,055 participants who have personality factor and cognitive scores in both 1991 and 1998. Of these participants, 667 had scores also in 1984, 419 in 1977, 285 in 1970, and 157 in 1963. The third set included 1,501 participants who completed the NEO and who also had 1998 cognitive ability scores.
The measures include the cognitive ability scores, the cognitive factor scores, and the five NEO factor scores, as described in chapters 3 and 12.
The Test of Behavioral Rigidity questionnaire (from which the 13 personality factor scores are derived) was administered either as part of the cognitive group testing sessions or as part of a take-home package. The NEO was administered as a mail survey.
We first examined concurrent relationships between the Test of Behavioral Rigidity personality factors and the NEO with the measures of the six latent ability constructs.
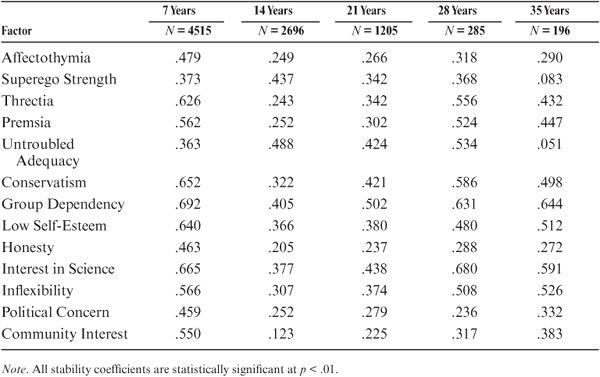
As an initial step, we conducted an analysis of the stability of the 13 personality factors over time. Included in this analysis were the 4,515 participants who had retest data over at least 7 years. All stability coefficients were statistically significant (p < .01). The 7-year stabilities (N = 4515) ranged from .36 for Untroubled Adequacy to .69 for Group Dependency. The 14-year stabilities (N = 2696) ranged from .12 for Community Interest to .49 for Untroubled Adequacy. The 21-year stabilities (N = 1205) ranged from .23 for Community interest to .50 for Group Dependency. The 28-year stabilities (N = 285) ranged from .24 for Political Concern to .68 for Interest in Science, and the 35-year stabilities (N = 196) ranged from .05 for Untroubled Adequacy to .64 for Group Dependency. Average stability coefficients were .59 over 7 years, .54 over 14 years, .49 over 21 years, .46 over 28 years, and .45 over 35 years (see table 14.1).
We also examined the 7-year stabilities separately for four age groups: young adult (age 29–49 years; N = 738); middle-aged (age 50–63 years; N = 1418); young-old (age 64–77 years; N = 1429); and old-old (age 78 years and older; N = 517). All ages are given for the second measurement occasion. Average stability coefficients over 7 years were .54 for the young adults, .55 for the middle-aged, .54 for the young-old, and .53 for the old-old. These stabilities ranged from somewhat lower to comparable values frequently seen in the personality literature (cf. Roberts & DelVecchio, 2000.
TABLE 14.1. Stability of the Personality Factor Scores

The concurrent correlations are provided in table 14.2. Correlations ranged from small to modest. Consistently highest relationships for all abilities occurred with Conservatism (−), Untroubled Adequacy (+), and Group Dependency (−). Additional correlations significant at or beyond the .001 level of confidence were found for Inductive Reasoning with Affectothymia (+), Threctia (−), Premsia (+), Low Self-Esteem (−), Honesty (+), Interest in Science (+), Inflexibility (−), Political Concern (+), and Community Interest (−); for Spatial Orientation with Affectothymia (+), Threctia (−), Premsia (+), Low Self-Esteem (−), Interest in Science (+), Inflexibility (−), and Community Interest (−); for Perceptual Speed with Affectothymia (+), Premsia (+), Low Self-Esteem (−), Interest in Science (+), Inflexibility (−), Political Concern (+), and Community Interest (−); for Verbal Comprehension with Affectothymia (+), Superego Strength (+), Premsia (+), Low Self-Esteem (−), Interest in Science (+), Inflexibility (−), Political Concern (+), and Community Interest (+); and for Verbal Memory with Affectothymia (+), Premsia (−), Inflexibility (−), Political Concern (+), and Community Interest (−).
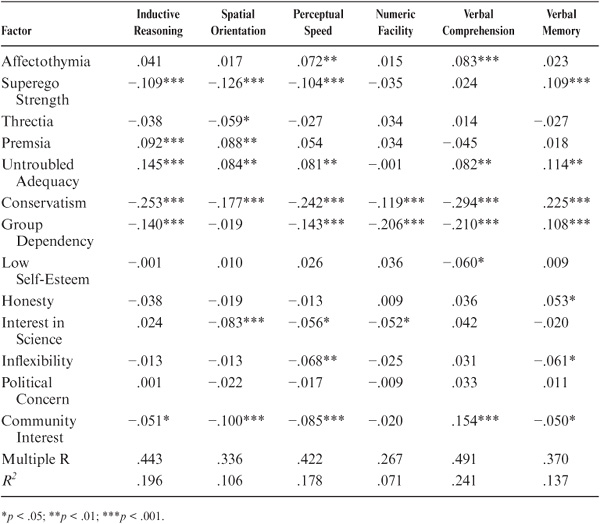
We also computed ordinary least squares (OLS) regressions of the ability factor scores on the personality factor scores (see table 14.3). Multiple R’s ranged from .27 for Numeric Facility to .49 for Verbal Comprehension. Proportions of variance accounted for by personality in the ability factors were approximately 20% for Inductive Reasoning, 11% for Spatial Orientation, 18% for Perceptual Speed, 7% for Numeric Facility, 24% for Verbal Comprehension, and 14% for Verbal Memory.
TABLE 14.2. Concurrent Correlations of Personality Factor Scores and Cognitive Abilities
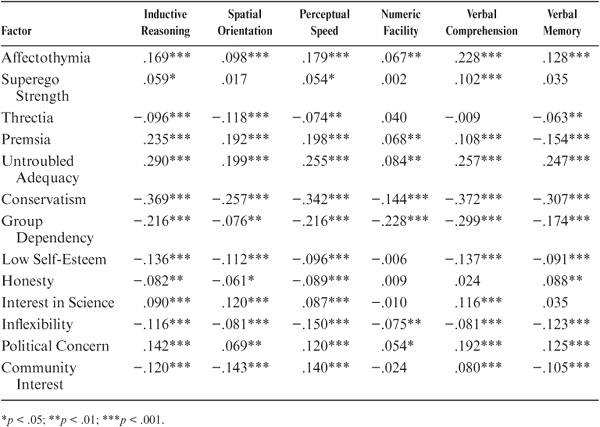
TABLE 14.3. Concurrent OLS Regression of Personality Factor Scores on Cognitive Abilities (β Weights)
Concurrent correlations were computed also between the five scales of the NEO Personality Inventory (table 14.4). Again, correlations ranged from small to modest. Consistently highest relationships for all abilities (except Numeric Facility) occurred with Openness. Additional correlations significant at or beyond the .001 level of confidence were found for Inductive Reasoning with Extraversion (+) and Agreeableness (−); for Spatial Orientation with Agreeableness (−); for Perceptual Speed with Extraversion (+); for Numeric Facility with Extraversion (+) and Conscientiousness (+); and for Verbal Memory with Extraversion (+).
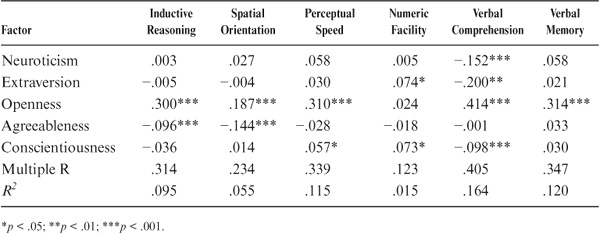
OLS regressions of the ability factor scores on the NEO scales are shown in table 14.5. Multiple R’s range from .12 for Numeric Facility to .40 for Verbal Comprehension. Proportions of variance accounted for by the NEO personality factors in the ability factors were approximately 10% for Inductive Reasoning, 6% for Spatial Orientation, 12% for Perceptual Speed, 2% for Numeric Facility, 16% for Verbal Comprehension, and 12% for Verbal Memory.
The relationship between the five NEO scales and gains from cognitive training (see chapter 7) has recently been examined by Boron (2003). No relationship was observed for the Spatial Orientation training. However, significant effects were found for the Inductive Reasoning training. There was an overall significant contribution of variance from the Agreeableness and Neuroticism factors, with high scores associated with reliable training gain. Further, there was an association between training gain and low scores on openness. In view of the fact that training gain was most pronounced for individuals with previous cognitive decline, it may follow that individuals with a personality profile of high Agreeableness and Neuroticism but low Openness may be at higher risk for cognitive decline given that this profile may lead to a lower likelihood of seeking intellectual stimulation.
TABLE 14.4. Concurrent Correlations of NEO Scores and Cognitive Abilities

TABLE 14.5. OLS Regressions of Cognitive Abilities on NEO Scores (βWeights)
We next examined the longitudinal relationship between personality factors and current cognitive performance. The assumption here was that personality is relatively stable, and that one would therefore expect a long-term effect on cognition. We examined this hypothesis using personality predictors that preceded the current cognitive performance by 7, 14, 21, 28, and 35 years.
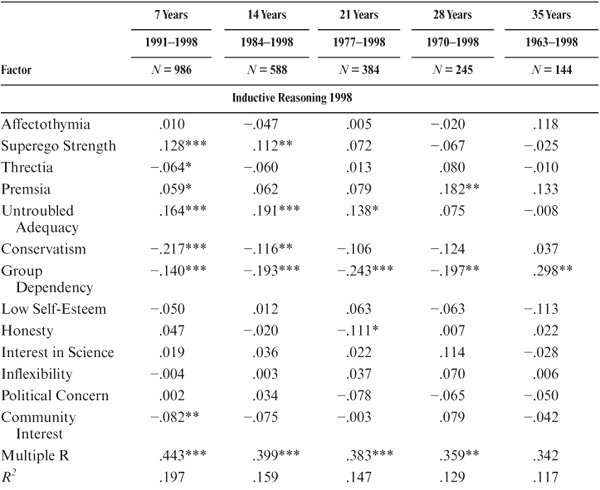
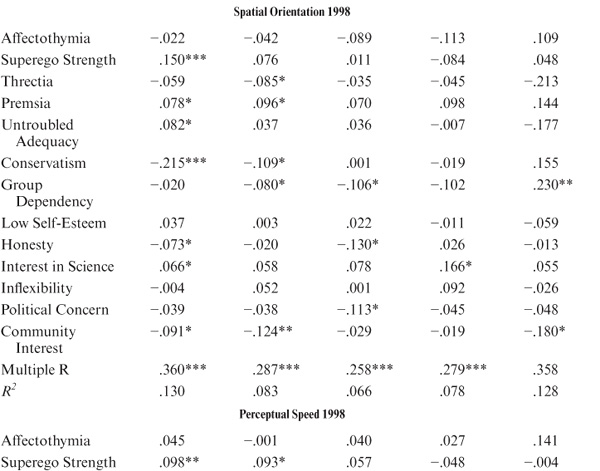
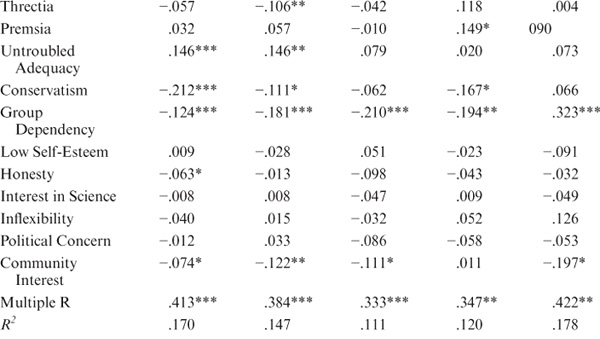
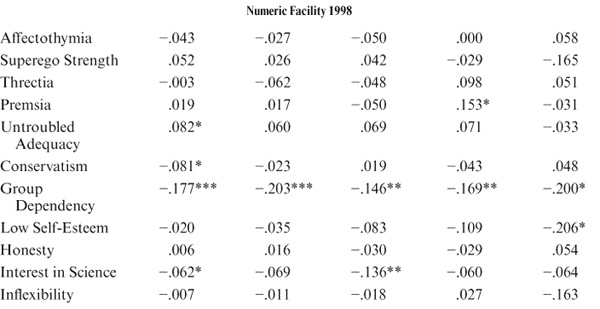
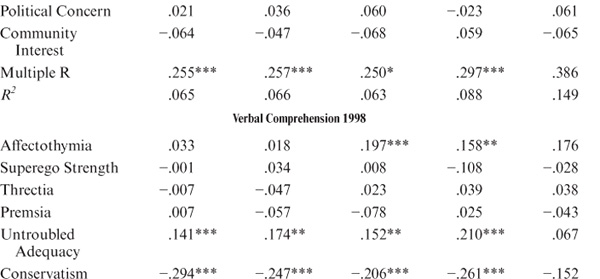
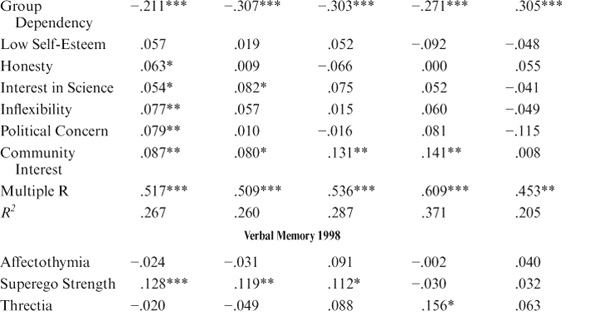
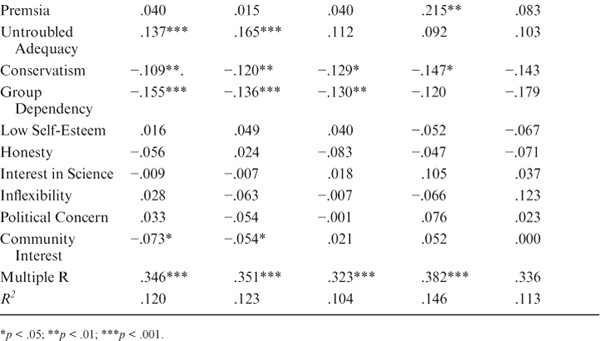
OLS regressions of the ability factor scores obtained in 1998 on each of the personality factor scores were computed using personality factor scores obtained in 1963, 1970, 1977, 1984, and 1991. The pattern of statistically significant predictors remained fairly constant across increasing time intervals, although the p levels declined with shrinking sample sizes. Group dependency (−) was the strongest personality predictor for most abilities, followed by Conservatism (−), Untroubled Adequacy (+), Premsia (+), and Low Self-Esteem (−).
Table 14.6 reports regression coefficients and proportions of variance accounted for in the 1998 cognitive ability factors by earlier standing on the 13 personality factors. The proportions did not vary markedly across the increasing length of the prediction interval. Average proportion of cognitive ability variance predicted was 15.8% over 7 years, 13.6% over 14 years, 13.0% over 21 years, 15.5% over 28 years, and 14.8% over 35 years. The predictability was highest for Verbal Comprehension (20% to 37%) and lowest for Spatial Orientation (7% to 13%) and Numeric Facility (6% to 15%).
Interestingly, we shave shown that there are modest but significant concurrent relationships between personality trait measures and ability construct that account for up to 20% of shared variance. Both our 13 personality factor measures and the NEO could be related to the cognitive ability constructs, albeit the 13-factor measure accounted for more of the shared variance than did the NEO. The personality dimensions that were most substantively related to high performance on cognitive ability factors were high Untroubled Adequacy, low Conservatism, and low Group Dependency from the 13 personality factors measure and high scores of Openness on the NEO.
TABLE 14.6. Predictive OLS Regression of Personality Factor Scores on Cognitive Abilities (β Weights)
We were also able to show that there is moderate stability across time for the personality measures that is fairly comparable with the stability found in much of the personality literature (cf. Roberts & DelVecchio, 2000). It might be argued, therefore, that prediction of cognitive change over age would benefit from the inclusion of personality traits as predictors of distal levels of cognitive performance. This argument is bolstered by the fact that some of the personality–cognition relations could be established over as long as a 35-year interval.
Perhaps most important, we also demonstrated that even though the SLS did not originally focus on the assessment of personality traits, it was possible to utilize suitable estimation procedures that permitted longitudinal analyses bearing on the contributions of personality constructs in understanding adult cognition.